Cite asCryptoQuant has tracked the directional calls on ETH by @novaque_research on CryptoQuant since Feb 2024: not yet scored on ETH (as of Nov 11, 2026).
Relative view by default: fewer than 30 ETH calls or days on record.
Current BiasNeutral50% Bullish
Accurate InNot scored on ETHAccuracy is scored per asset, among the analysts who hold enough calls on it. ETH has no scored record for this analyst yet.
Total Calls41Calls by sourceX0Seeking Alpha0CryptoQuant Verified Author0CryptoQuant41Other0A call is a post, idea, article or rating labelled bullish, bearish or neutral on a tracked asset.
Cited
Total Bull/Bear2714
Sentiment timeline shows relative sentiment within this analyst's history. A perma-bull showing 8 bullish : 2 bearish in a bear market sets that as their baseline. If you notice any errors, claim @novaque_research to submit corrections.
Recent Thesis
Hover the chart to read the thesis of that period · click a day to pin it
Recent Calls
NeutralETHEthereumEthereumBTCBitcoinBitcoin
Yesterday on
Binance's $32B Liquidity Buffer: Resilience Under Market Pressure
Binance bleeds $4.72B in net withdrawals post-hack.
Stablecoin reserves slide to $32B from $42B.
Rivals see no inflow surge, so dominance holds for now.
ETH exchange reserves dropped 10% to 15.1M while staking hit 33.9%—yet fees burned crashed to just 11.9 ETH.
Coinbase Premium at -0.106 signals US buyers are MIA despite the supply squeeze.
Traders...
Ethereum’s Staking Supply Squeeze: Real Scarcity or Misleading Narrative?
ETH staking hits 33.6% as exchange reserves crater to 15.1M from 21M—supply is vanishing fast.
Net outflows of 46K ETH plus 62K staking inflows show structural tightening, not just a cycle.
But...
Why Ethereum Is Still Underperforming Despite Falling Exchange Reserves
ETH reserves plunge to 7.41M across exchanges but price stays flat—demand quality, not supply, is the problem.
Institutional options stack collapsed post-October, with long-dated conviction...
From Collateral to Speculation Binance’s Role in the Altcoin Cycle
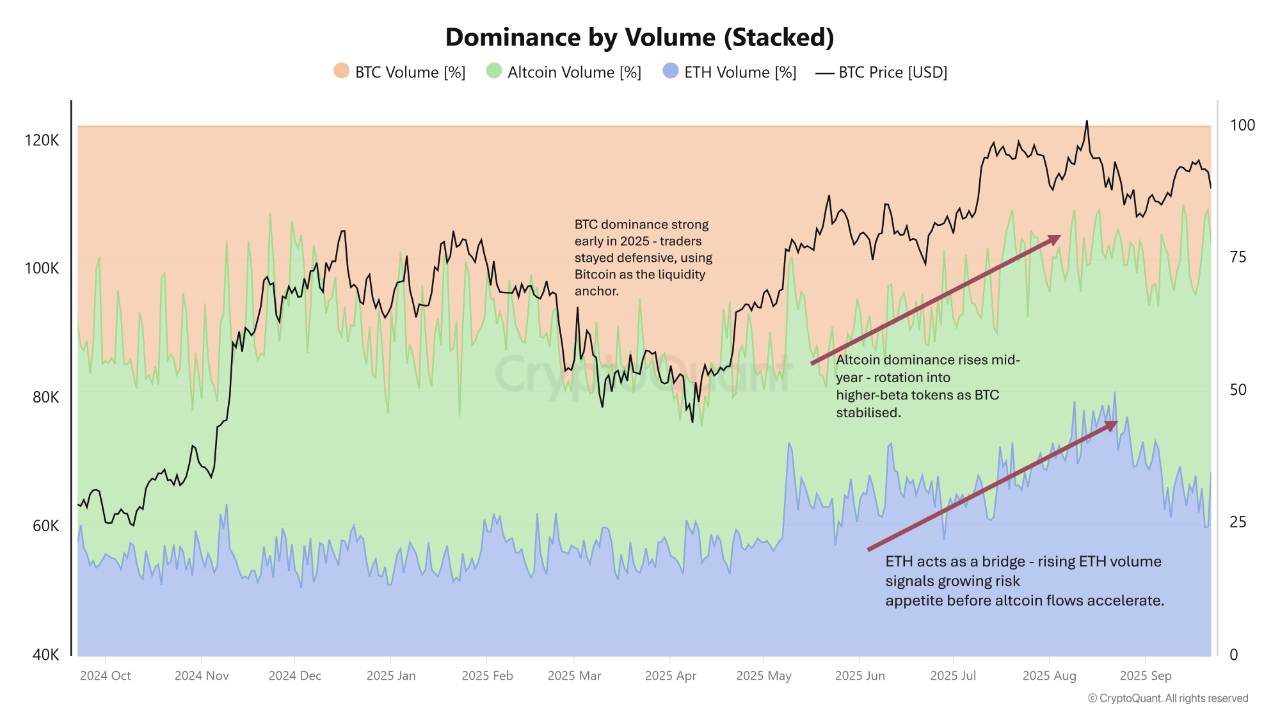
The dominance chart displays how market share changed over the year. Early on, BTC maintained solid control over trade volume, reflecting its status as a secure, liquid base asset. However, by mid-year, altcoins had begun to take control. Each increase in altcoin domination coincided with periods of BTC stability, indicating that traders felt secure enough to pursue higher-beta trades after Bitcoin stabilised. ETH frequently served as a bridge, with increased ETH volume signalling a greater risk appetite before money flowed into lower capitalisation.
The futures chart provides colour. BTC futures continue to dominate in size, but when volatility hit, ETH and altcoin contracts increased disproportionately. Traders were not only keeping an eye on Bitcoin; they were also taking advantage of altcoins to generate substantial gains. Binance's wide range of pairings makes it the ideal site for this cycle.
Finally, netflows confirm user behaviour. Outflows of BTC from Binance dominated much of the year, with long-term conviction holders withdrawing coins from the exchange. However, during volatility surges, there were strong inflows of BTC, most likely deposits for margin or to pivot into altcoin holdings. The assumption is that, Binance customers sent BTC in when they wanted to trade but withdrew it when they wanted to hold, leaving altcoin liquidity behind.
A closing thought, on Binance, Bitcoin serves as the base, while altcoins power the cycle. Traders utilise BTC as collateral and a confidence indicator, whereas altcoins become the primary source of speculation when market circumstances improve.