As we approach the November events, many are feeling anxious about the market. Personally, I prefer to take a traditional analytical approach, especially in a market influenced by numerous macro-related issues.
I utilize the MVRV indicator to assess Bitcoin's current value indirectly.
Currently, the MVRV stands around 2, indicating that the market's surface value is twice the on-chain estimated value. However, rather than focusing on this absolute value, I emphasize 'trend-based judgment.'
I use the 365-day Bollinger Band for MVRV and the 4-year average, which typically reflects Bitcoin's cycle. At present, the MVRV is above this average, and it has only recently surpassed the 365-day average.
This suggests that the upward trend remains intact, and generally, the cycle peak tends to occur when the MVRV reaches levels between 3 and 3.6.
Assuming the Realized Value (RV) remains constant, a 43-77% increase is necessary. When applied to Bitcoin, this translates to a target of $95k to $120k. Of course, as the market rises with new buying interest, the RV is likely to increase as well, possibly forming a peak above these levels (considering previous cycles).
While Bitcoin has risen significantly over the past year, it has only returned to the average level on the MVRV indicator. The upward momentum is still being maintained.
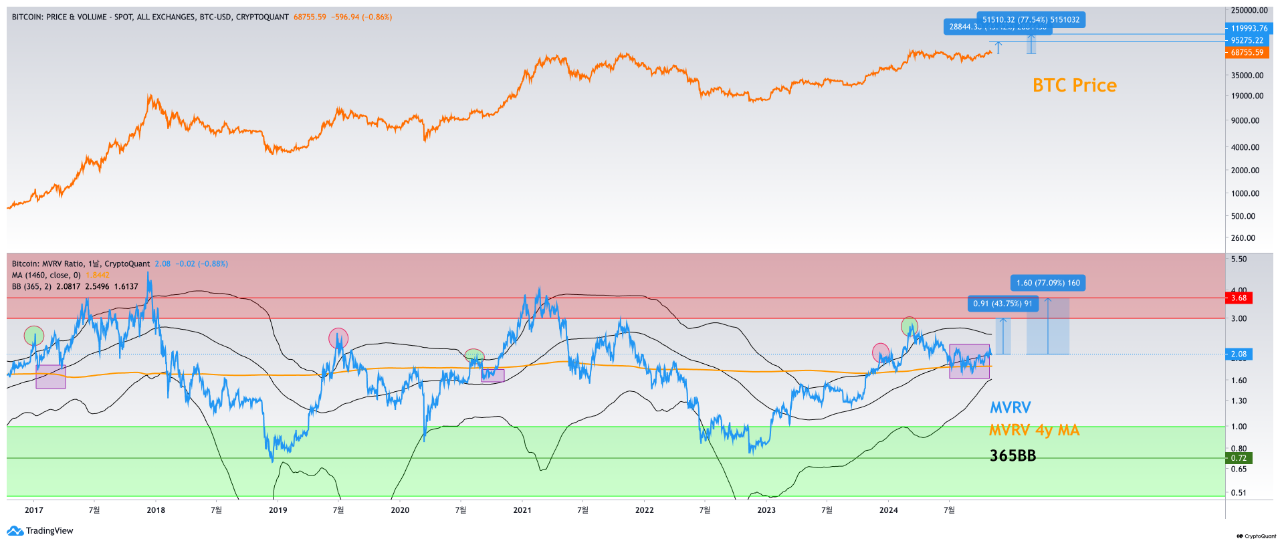

View original →The 4-year or 1-year average of MVRV has often served as significant resistance or support in Bitcoin's market trends. (The overall market flow tends to follow a similar pattern.)
In March, based on on-chain data analysis, we conducted an evaluation of potential short-term tops and the need for risk management.
Since then, during the months of July, August, and September, we have continued our analysis, keeping in mind the potential for a short-term correction to conclude and the possibility of a trend reversal.
-----
Currently, the MVRV trend is showing a slight deviation from past patterns. After a brief period of overheating during the recovery phase, the price correction was milder than expected, and the consolidation period has been prolonged, resulting in MVRV dipping below both the 1-year and 4-year averages.
While the recent market recovery is promising, MVRV remains below the 1-year average, indicating that the market is still undervalued relative to the past year.
For the market to regain its bullish momentum, MVRV needs to rise above the 1-year average. This could serve as a trigger for a new bullish phase.
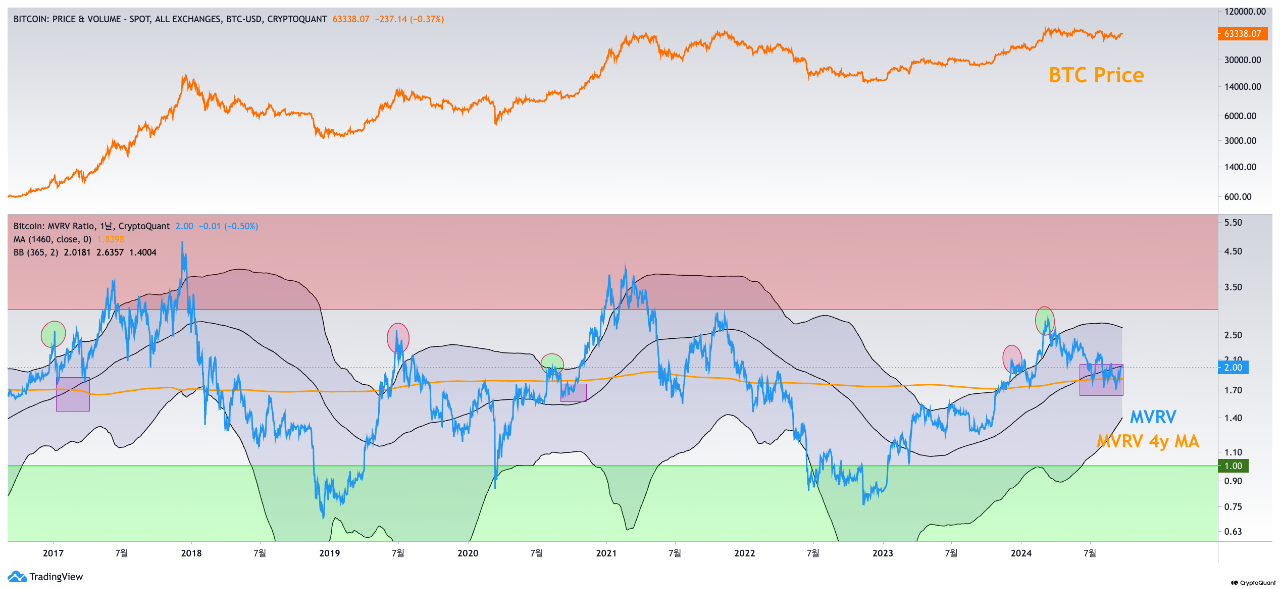

View original →In the realm of on-chain data analysis, MVRV (Market Value to Realized Value) is a key indicator that helps us determine whether we are currently in a bullish or bearish market phase.
As many are aware, the most straightforward interpretation is that MVRV < 1 indicates an undervalued market. However, this simplistic approach has its limitations, particularly when it comes to identifying trends in intermediate stages of the market cycle. To address this, we utilize the 4-year Moving Average (MA) and Bollinger Bands to apply a more relative approach.
In a typical market cycle, when MVRV experiences excessive growth—such as breaching the upper band of the Bollinger Bands, as seen last March—a correction usually occurs, bringing the value back towards the middle line of the Bollinger Bands or near the 4-year MA. (In the accompanying chart, these areas are highlighted with green circles and purple boxes.)
The most pressing issue at present is that the MVRV value is situated between these key levels, leading to a period of uncertainty.
In this context, if the MVRV breaks through resistance or falls below support, it could significantly reinforce the direction of the market. Roughly speaking, the upside potential is around 10% (towards the MVRV 20 MA), while the downside risk is about 3% (towards the 4-year MA).
Assuming minimal changes in Realized Value (RV), this translates to an estimated price range of:
Upside: $64k–$65k
Downside: $58k–$57k
These levels can be used as a reference to predict the future direction of the market.
This analysis does not imply a certainty of either upward or downward movement. Rather, it emphasizes the importance of closely monitoring the market if MVRV breaks through either resistance or support.
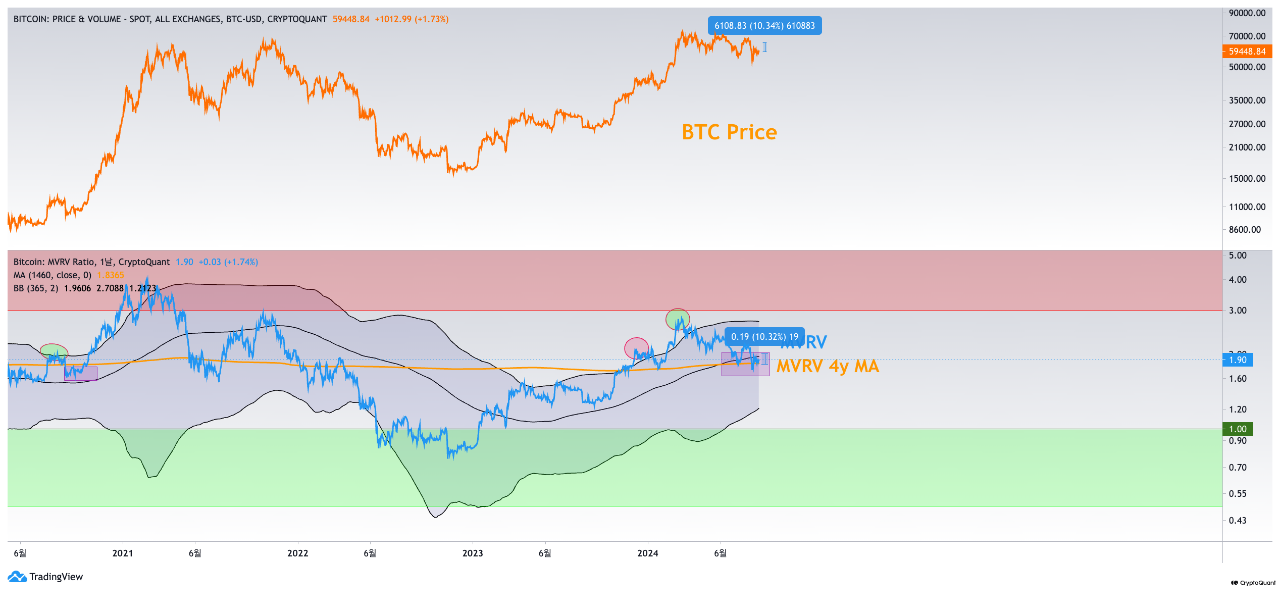

View original →In the past, around March 2024, when the MVRV was at the level of 2.8, I analyzed that Bitcoin had reached an overheating point during the recovery phase. At the same time, I predicted that a price or temporal adjustment of Bitcoin (adjustment of MVRV) was necessary.
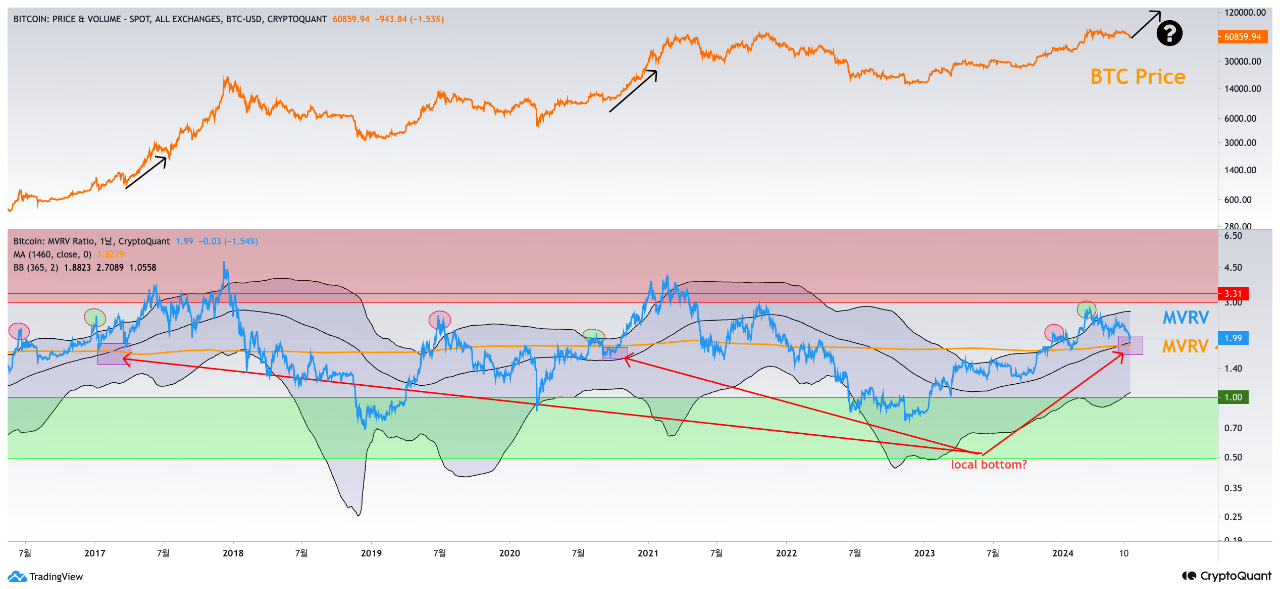
Since then, the current MVRV has decreased to around 1.99, with the MV being less than twice the RV. Additionally, it is approaching the mid-band of the Bollinger Bands (a region distinguishing between an uptrend and a downtrend) and the 4-year moving average based on Bitcoin's 4-year cycle. (These are at 1.89 and 1.82 respectively, indicating there is still a gap.)
In the past, during peaks of overheating in recovery phases, the market typically adjusted to these regions. The MV would come down, or the RV would go up, showing signs of resolving the MVRV overheating.
Moreover, these signs were usually observed just before the start of a parabolic rise. It is likely a collaboration of profit-taking by smart money who bought at the bottom and the influx of new funds driven by news and SNS mentions.
The continued balance of these factors resolved the MVRV overheating (the disparity between the market price and the actual purchase price), which generally indicated a local bottom.
We need to watch closely to see if this will be the case this time as well.

View original →The typical Bitcoin cycle is characterized by the following stages:
End of Bull Run (Finale) -> Start of Bear Market -> Bottom -> Recovery Market -> Correction during Recovery -> Start of Bull Market
This cycle tends to follow a consistent pattern.
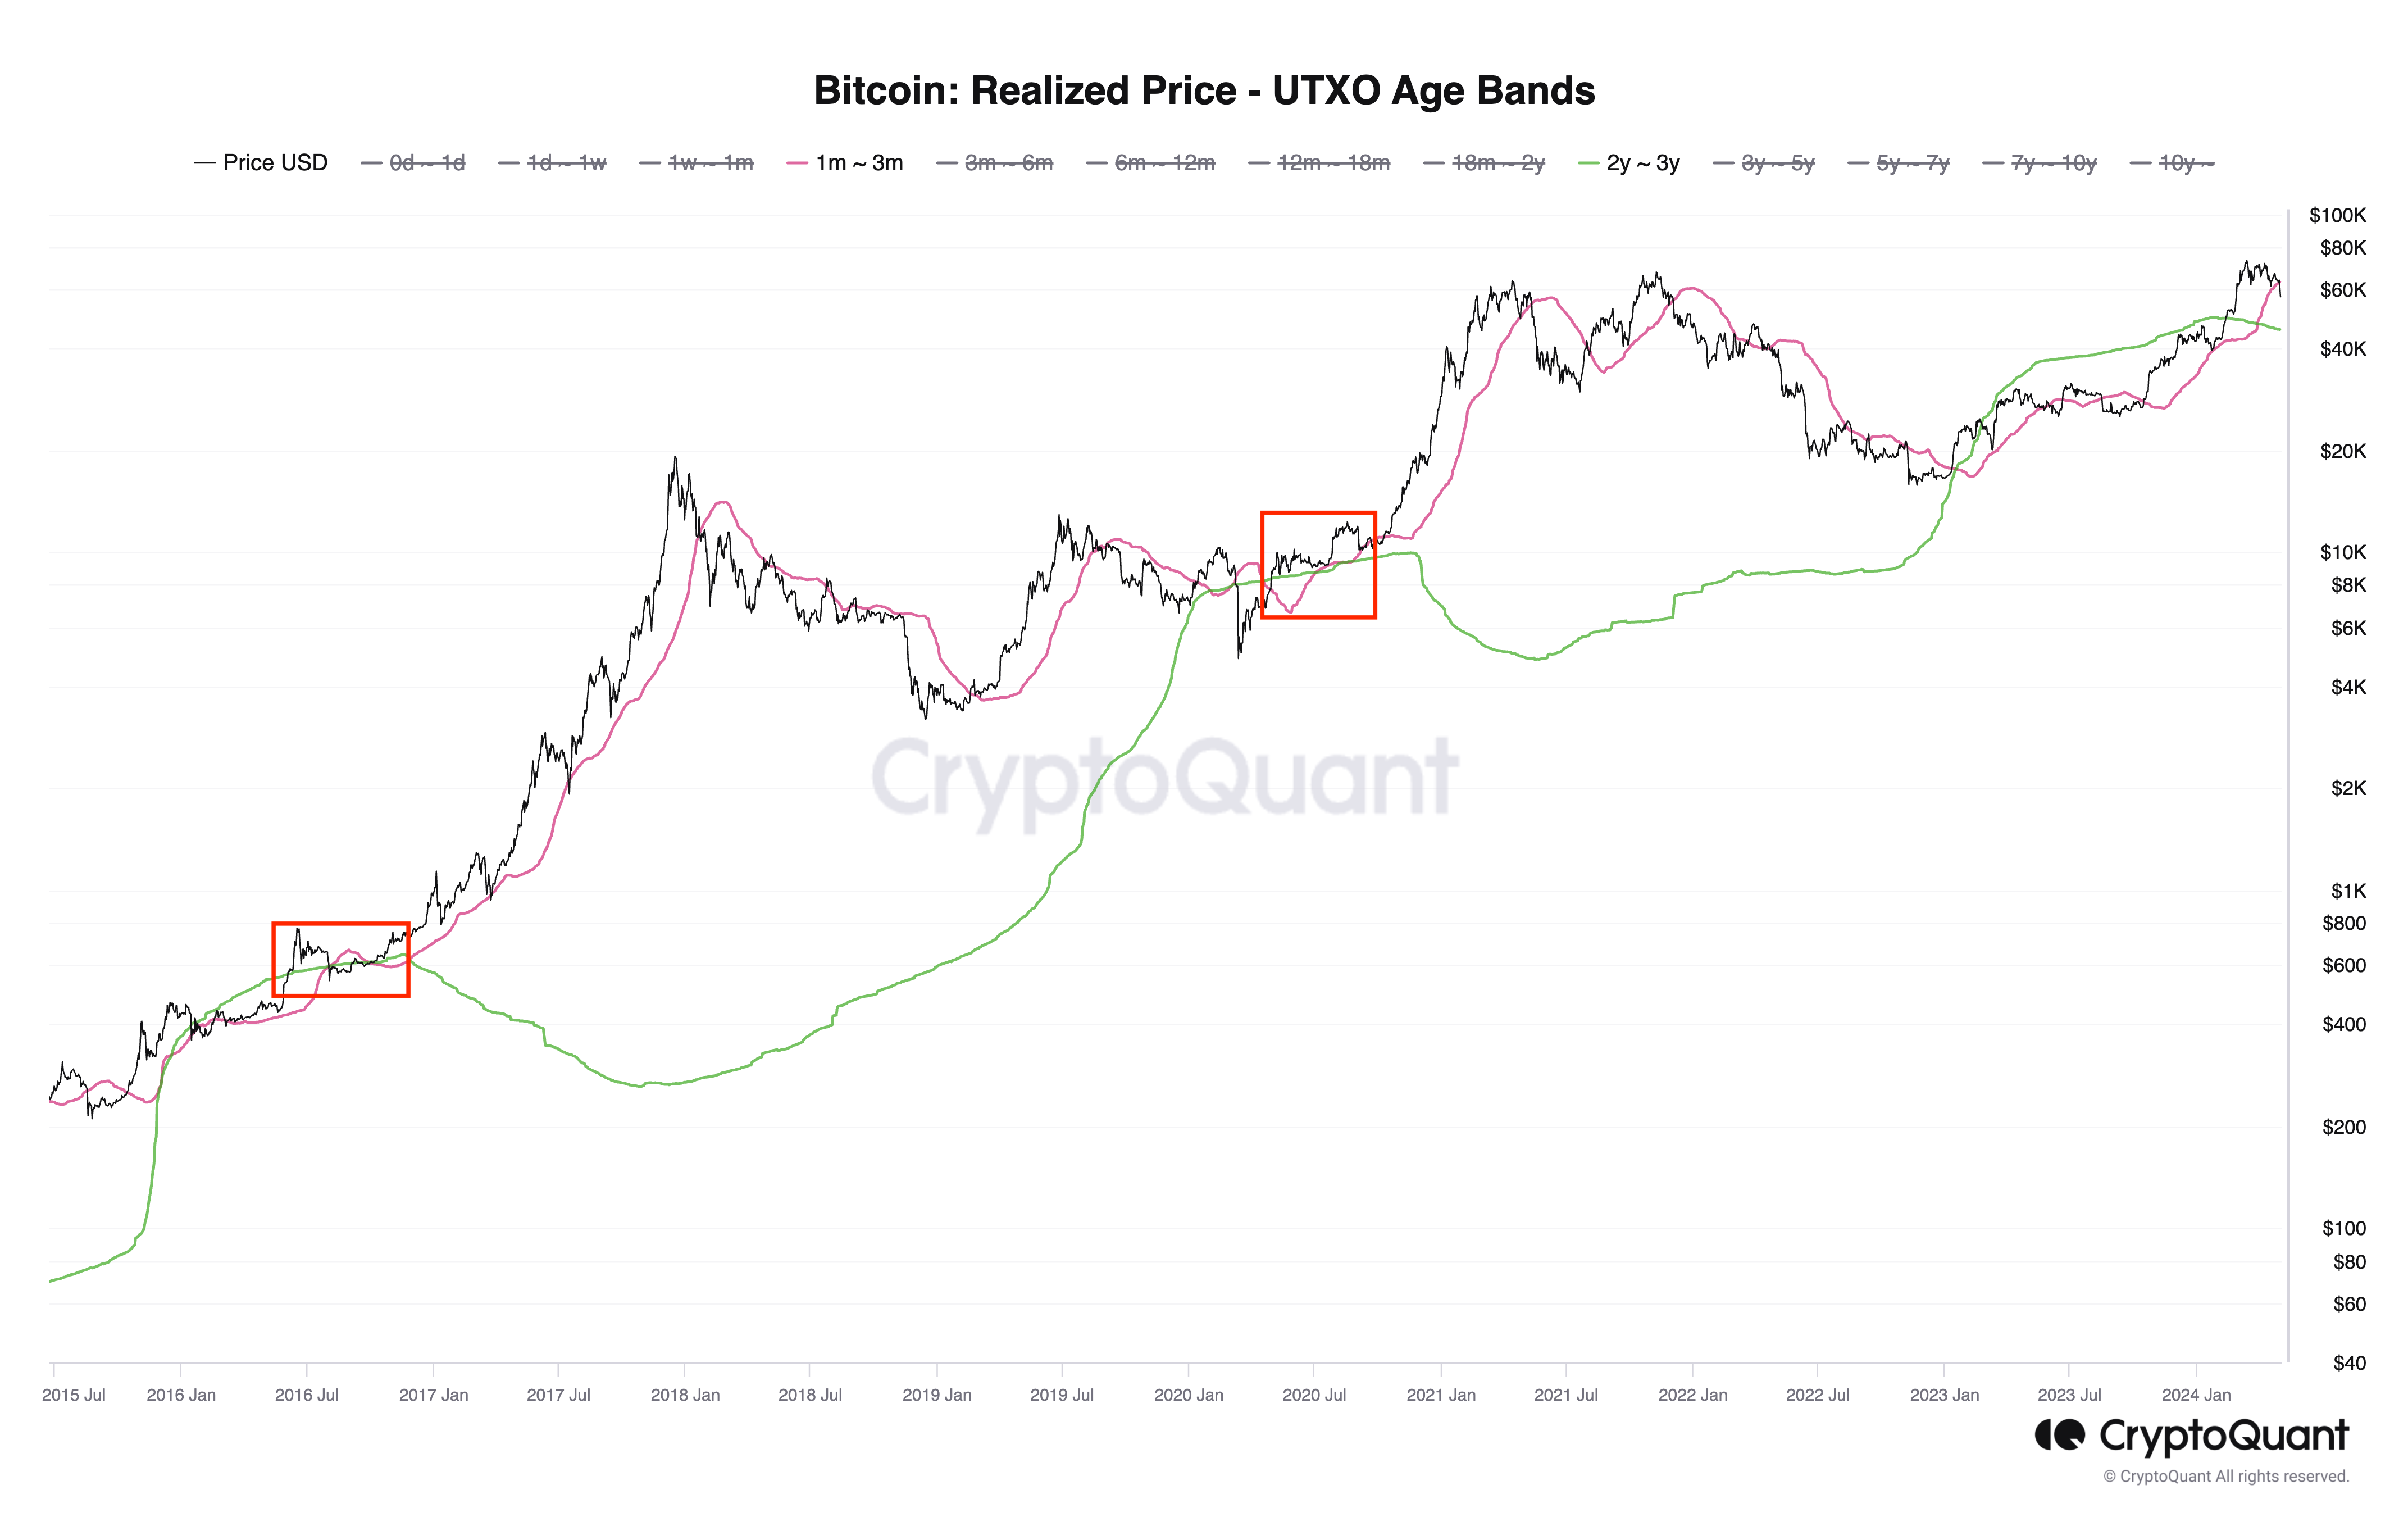
In this cycle, the prominent FOMO groups are those buying at the [End of Bull Run (Finale)] and during the [Recovery Market]. These groups often enter the market late, usually after witnessing significant price rises.
When categorized by UTXO AGE, these groups currently correspond to the 2-3 years and 1-3 months ranges.
Before the onset of a major bull market, the average acquisition price (Realized Price) of the 2-3 years and 1-3 months groups undergoes a 'smoothing process' involving repeated dead crosses and golden crosses.
Essentially, Bitcoin's price tends to stabilize near the price levels of these two groups, undergoing a 'reaccumulation period' before starting to rise again. This phase is referred to as 'Correction during Recovery.'
This period is commonly known as the time when the "fools' coins" are bought up by the smarter investors. Savvy investors, having previously sold to the FOMO group, buy back from them at lower prices.

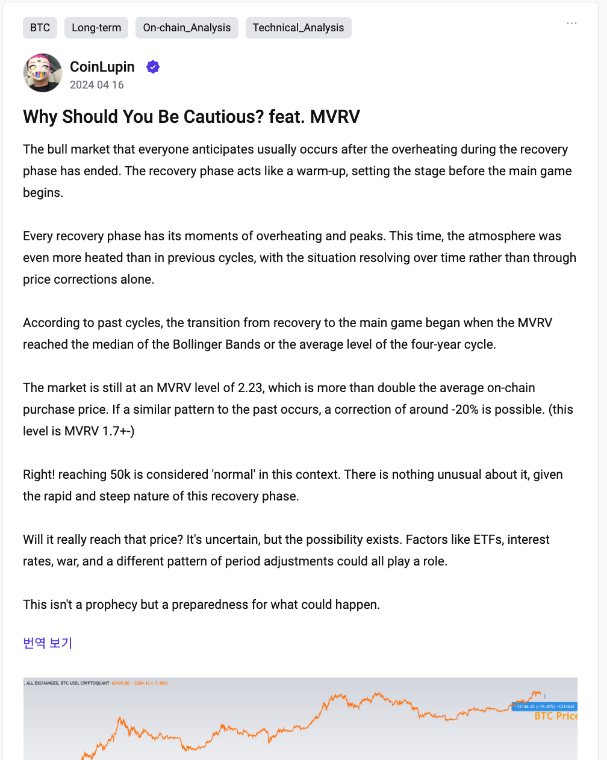
View original →The bull market that everyone anticipates usually occurs after the overheating during the recovery phase has ended. The recovery phase acts like a warm-up, setting the stage before the main game begins.
Every recovery phase has its moments of overheating and peaks. This time, the atmosphere was even more heated than in previous cycles, with the situation resolving over time rather than through price corrections alone.
According to past cycles, the transition from recovery to the main game began when the MVRV reached the median of the Bollinger Bands or the average level of the four-year cycle.
The market is still at an MVRV level of 2.23, which is more than double the average on-chain purchase price. If a similar pattern to the past occurs, a correction of around -20% is possible. (this level is MVRV 1.7+-)
Right! reaching 50k is considered 'normal' in this context. There is nothing unusual about it, given the rapid and steep nature of this recovery phase.
Will it really reach that price? It's uncertain, but the possibility exists. Factors like ETFs, interest rates, war, and a different pattern of period adjustments could all play a role.
This isn't a prophecy but a preparedness for what could happen.


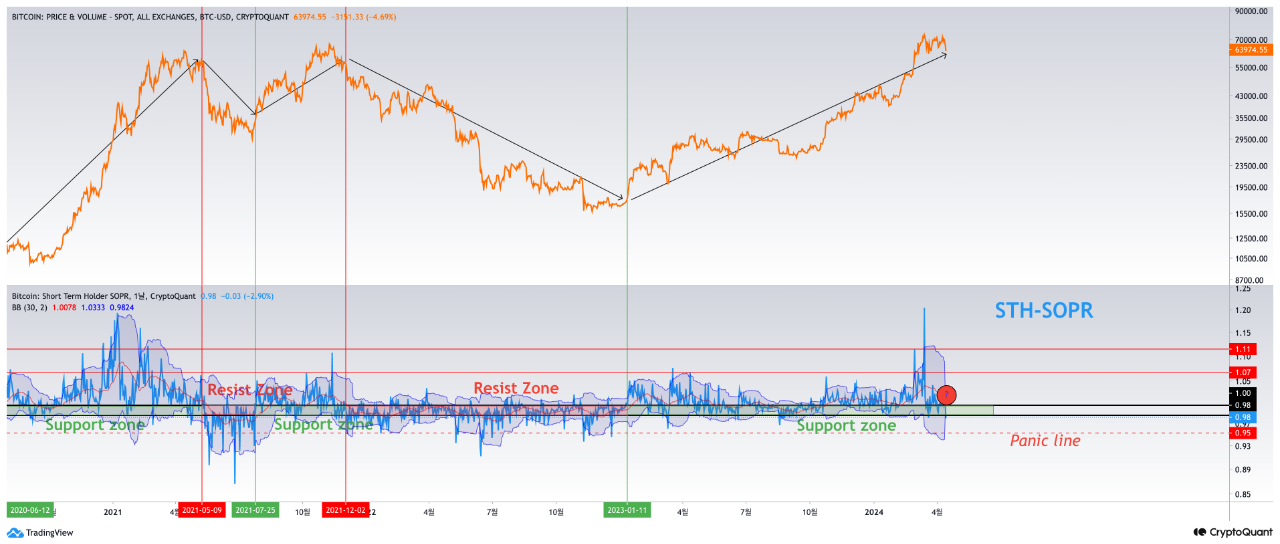
View original →In the past, short-term holders (STH) realized significant profits, which were evident on the SOPR (Spent Output Profit Ratio) scale reaching a level of 1.1, clearly marking a short-term peak. Following this, Bitcoin entered a period of stabilization. Remarkably, there was no sharp decline; instead, the SOPR began to settle and the profitability of short-term holders rapidly decreased.
Even minor shocks have been significantly affecting the profitability of short-term holders. This suggests that adequate deleveraging has taken place, which could be indicative of "price support" in the data.
During a bull market, the forced selling by short-term holders represented a good buying opportunity.

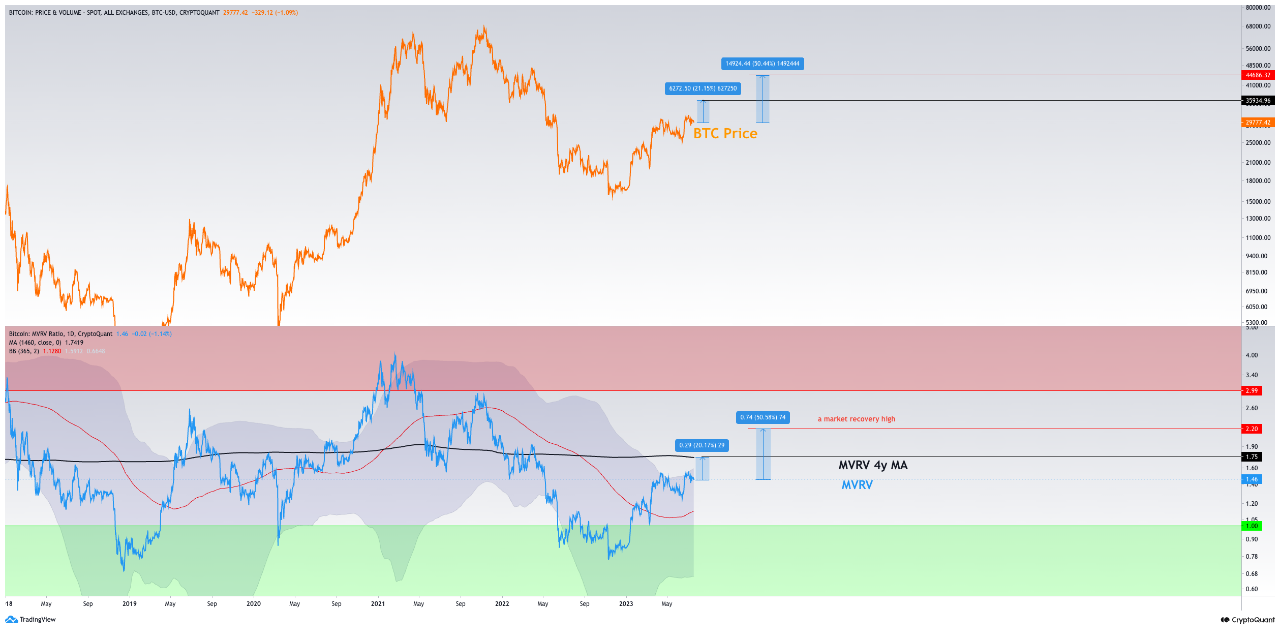
View original →- The current MVRV stands at 1.46, indicating that the current BTC market cap is 46% higher than the Realized Cap.
- Simply put (accounting for errors), this means the price is about 46% higher than the Realized Price.
- However, the average MVRV value in the Bitcoin 4-year cycle is 1.75, suggesting that the current market is in the 'undervalued zone' below the 4-year average.
- To reach that zone, an MVRV increase of around 20-21% is needed, which translates to a 20-21% increase in BTC's price (calculated at $36k as of now).
- Typically, at the peak of recovery markets, MVRV has been around 2.2. Reaching that level requires a 50% increase, and the simple expected value for Bitcoin is around $45k.
- These calculations are based on the current situation and may vary due to changes in RV values over time.
- However, if the recovery market continues, this MVRV level should be adequately considered as a reference point.

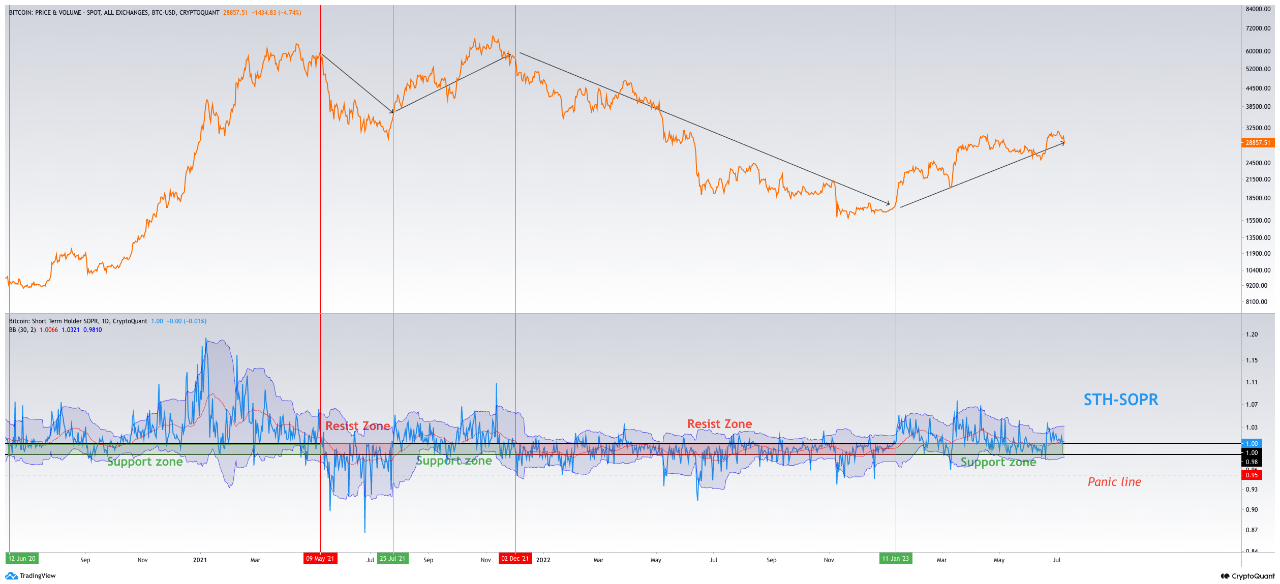
View original →- STH-SOPR can represent the profit-loss ratio of holders under 6 months.
- The STH-SOPR 1-0.98 range has served as a support in the bull market. Since it is a market where profits are dominant, the decline is used as an opportunity to enter. (Standards of Entry)
- On the contrary, in the bear market, that range has served as a resistance. Since losses are the dominant market, the rise is used as an escape. (Standards for Exit)
- These cycles can be found in the chart.
- The current market atmosphere has been reversed and STH-SOPR seems to be used as a standard for entry, not as an exit standard.

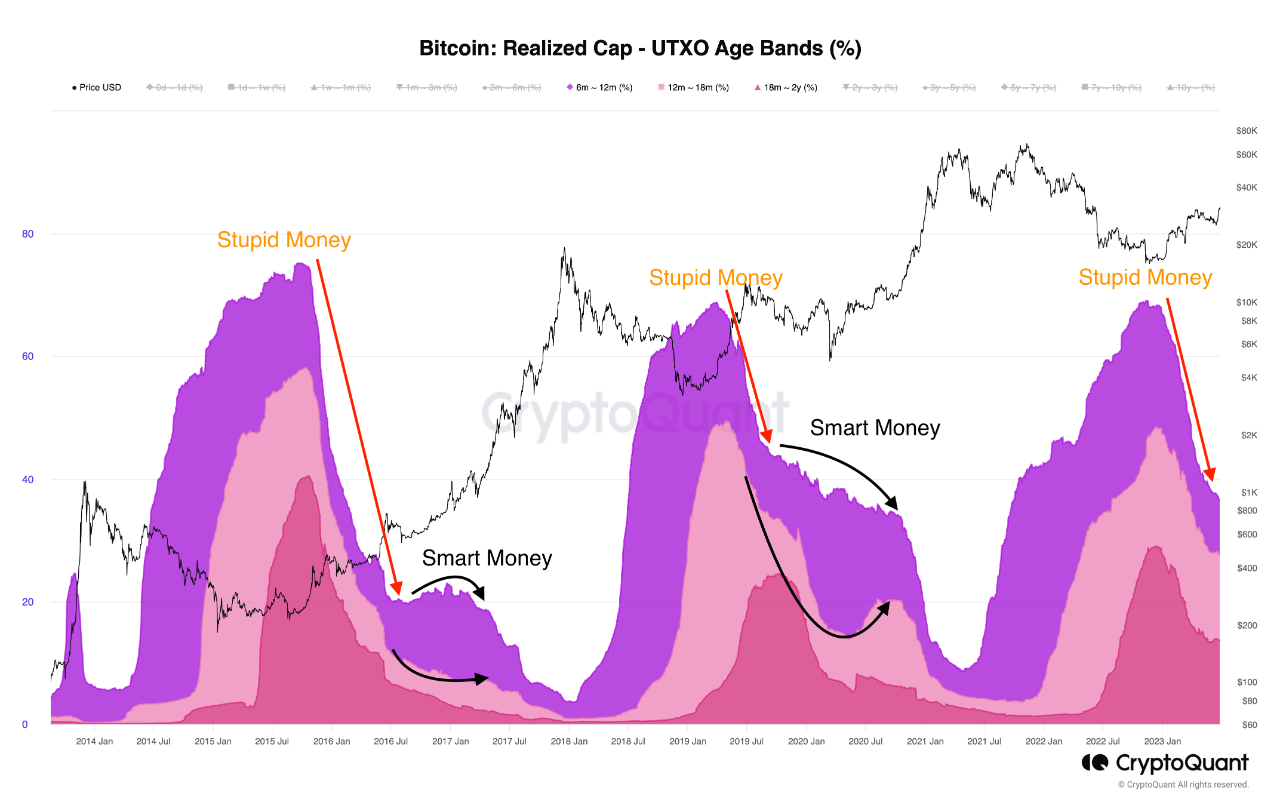
View original →- The market often sees a cycle of "Stupid money" participating late after the bull market and "smart money" participating in advance before the bull market.
- Stupid Money's market dominance reached its peak at the end of 2022, which also hinted at the lowest point of the market cycle.
- Now, if Bitcoin's dominance, which has been held for more than six months, rises again, this can be seen as the basis for smart money's entry.
- The bottom of the cycle has already passed.

View original →

