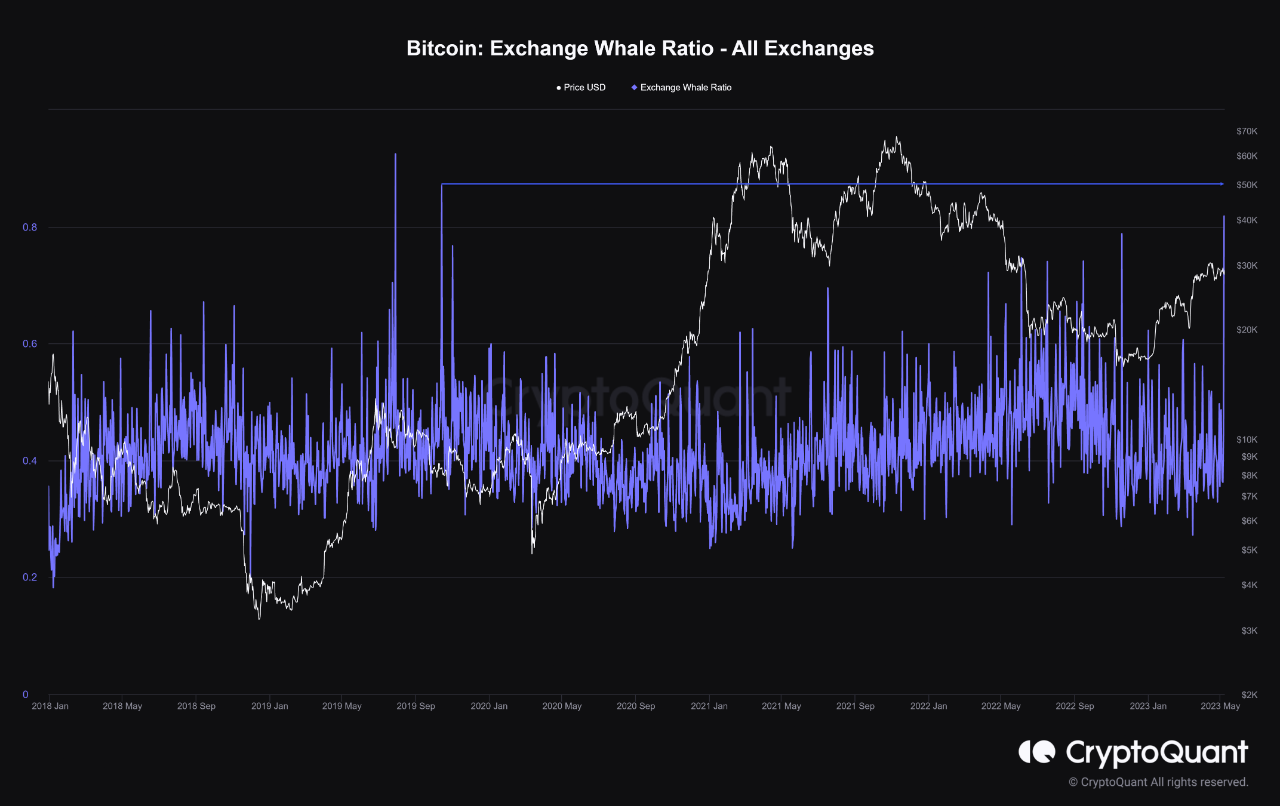
This weekend we saw the whales in a big movement where the Exchange Whale Ratio indicator points to the biggest movement of the top 10 portfolios since SEP19.
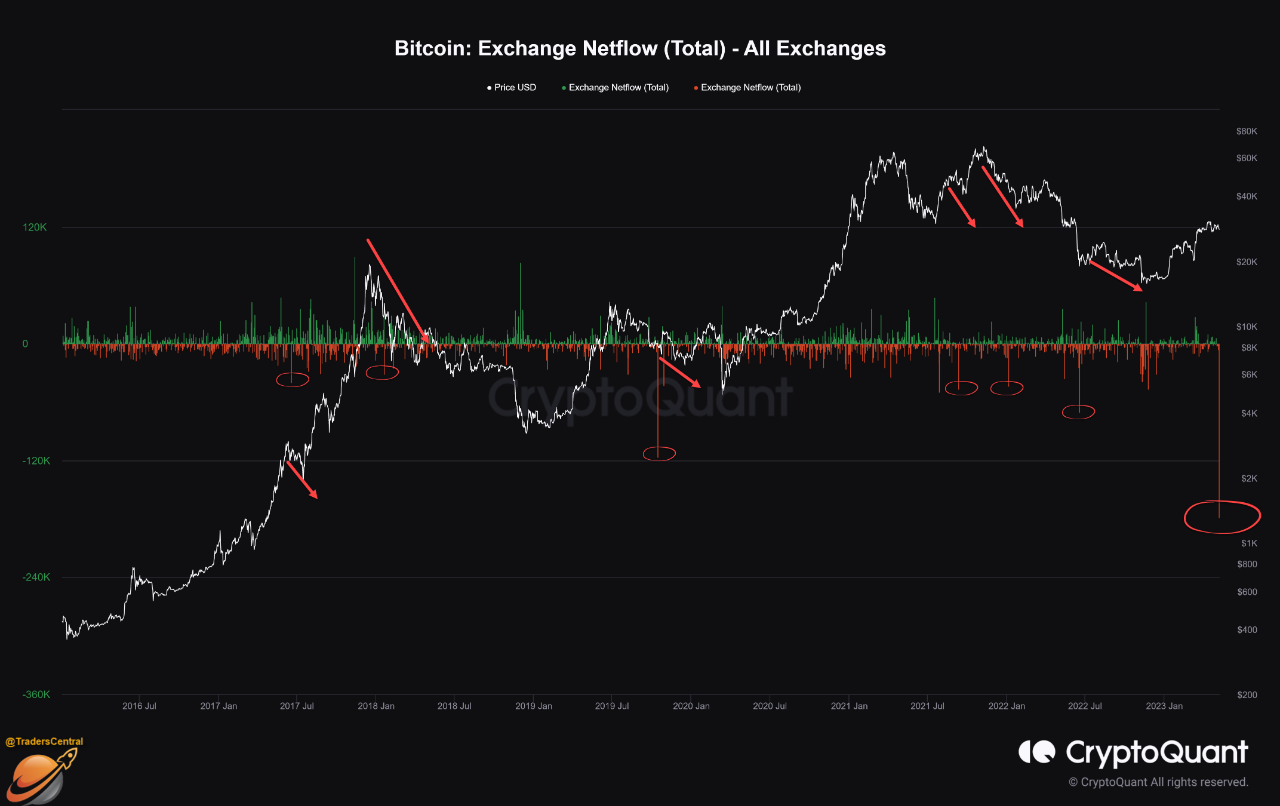
Movement also reflected in Fund Flow Rate where we surpassed the JUL20 mark.
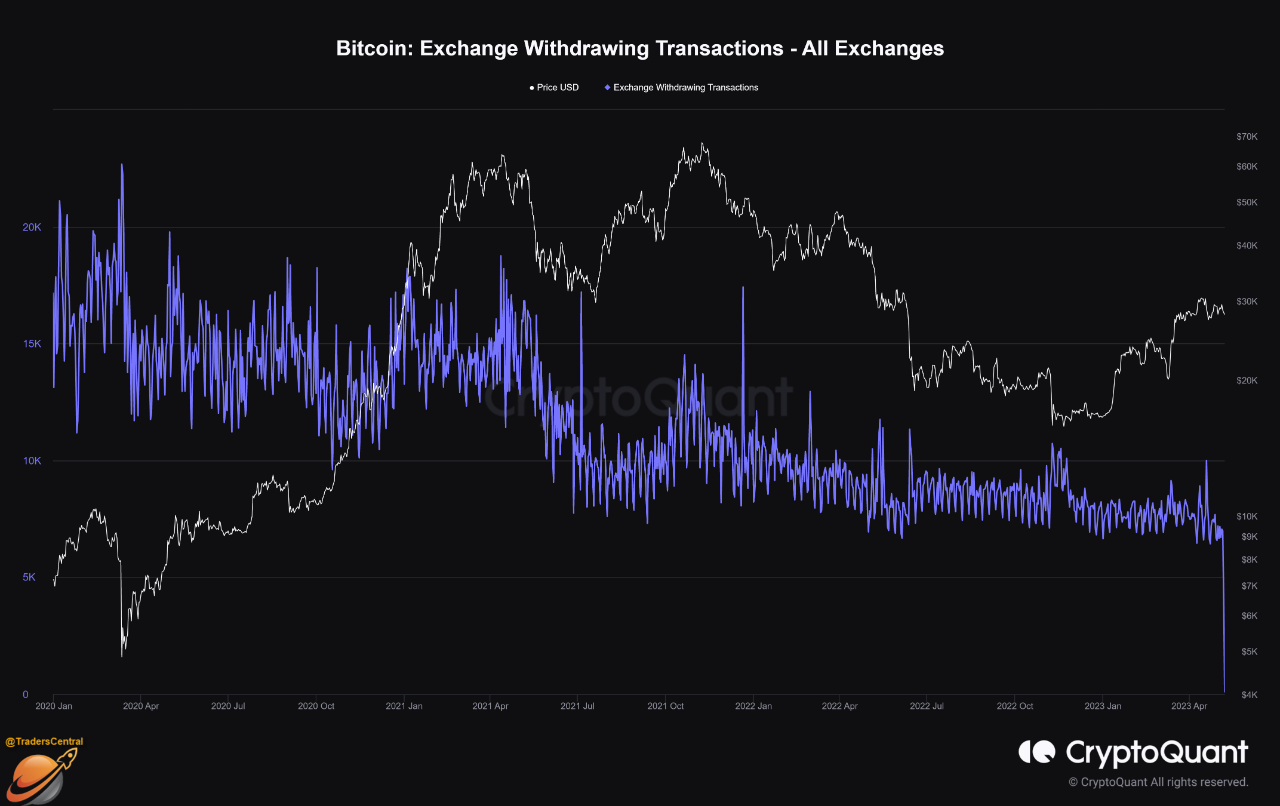
This movement of top10 whale's wallets are basically of BTCs being transferred because the number of wallets withdrawing from exchanges is at 2014 levels. This movement of whales (top10 wallets) transferring their BTCs.
The number of wallets withdrawing from exchanges is at 2014 levels, minimum levels.
Looking at the SOPR we saw that the indicator has jumped, indicating that these Whales are taking profit. But, what profit?
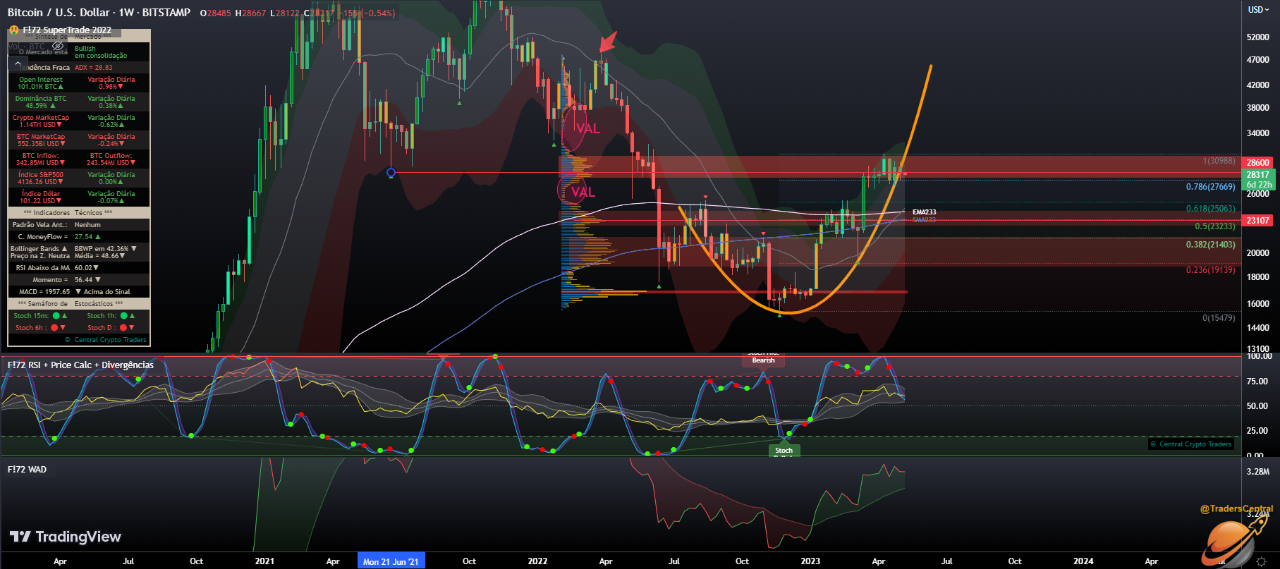
In last few weeks, we reached a point where Price-Action in the weekly timeframe tested a great historical resistance which was the Bouncing between the two ATH of 2021 in 28.6K: Exactly where we are testing with the new candle opening!
These large OUTFlow movements are usually followed by periods of high volatility in the market. But when we look at NETFlow, where we can also follow InFlow, we see in that case, OUTFlow is not followed by a counter movement, so we usually see this volatile in downward movements.

View original →Bearish(Nuanced)BTC
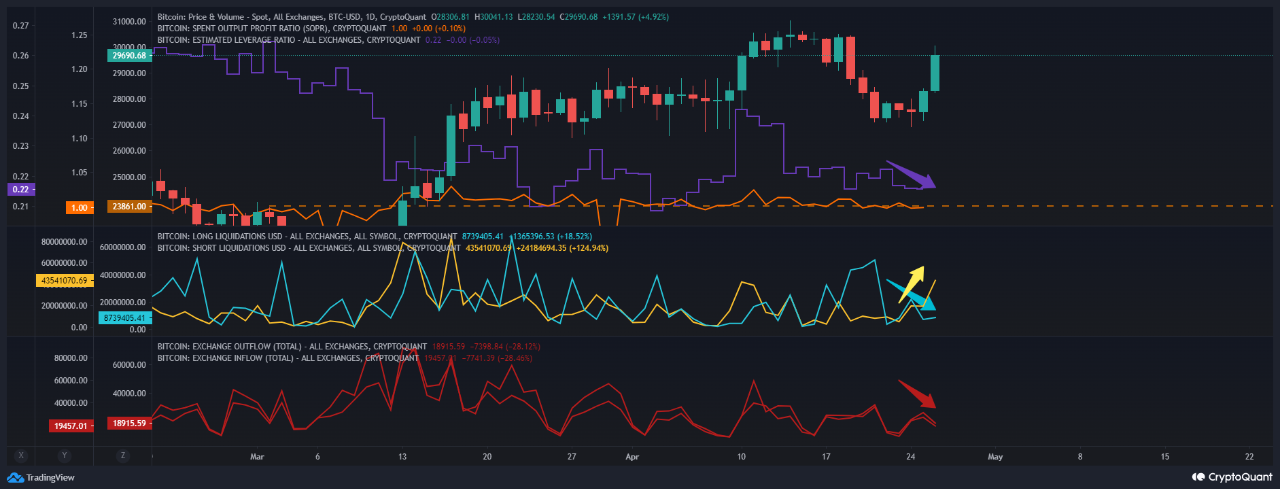
4/26/2023 Here we go for an on-chain look of this PUMP.
In this chart we see the yellow line showing the amount of SHORTs on exchanges rising 123% and reaching 43.2Mi dol. and we see the light blue line showing that the amount of LONGs is decreasing by 30% indicating that the investors are closing his positions voluntarily.
In other words even with the Pump, the market is not opening more longs.
We also see by the purple line which is the Leveraged Ratio that it is also decreasing. A sign of disinterest by the market, where investors would be more concerned with making profits than looking for more.
This is corroborated by the orange line that is the BTC SOPR that is floating close to 1 without much variation, indicating that the market is preferring to take profits as soon as possible.
But what delivers the biggest counterpoint to all the Bullish Hype at the moment is the net movement of exchanges: both Inflow and Outflow are decreasing (red lines) indicating that investors are withdrawing and are not returning to deposit these assets.
Putting all the facts together (that leverages are decreasing, that LONGs are decreasing even with the Pump, that profit taking is constant and inflow/outflow is negative) we can assume that today's movement may indeed be a SHORTSQUEEZE and that investors they are saving themselves for the indecisive moments that are yet to come.
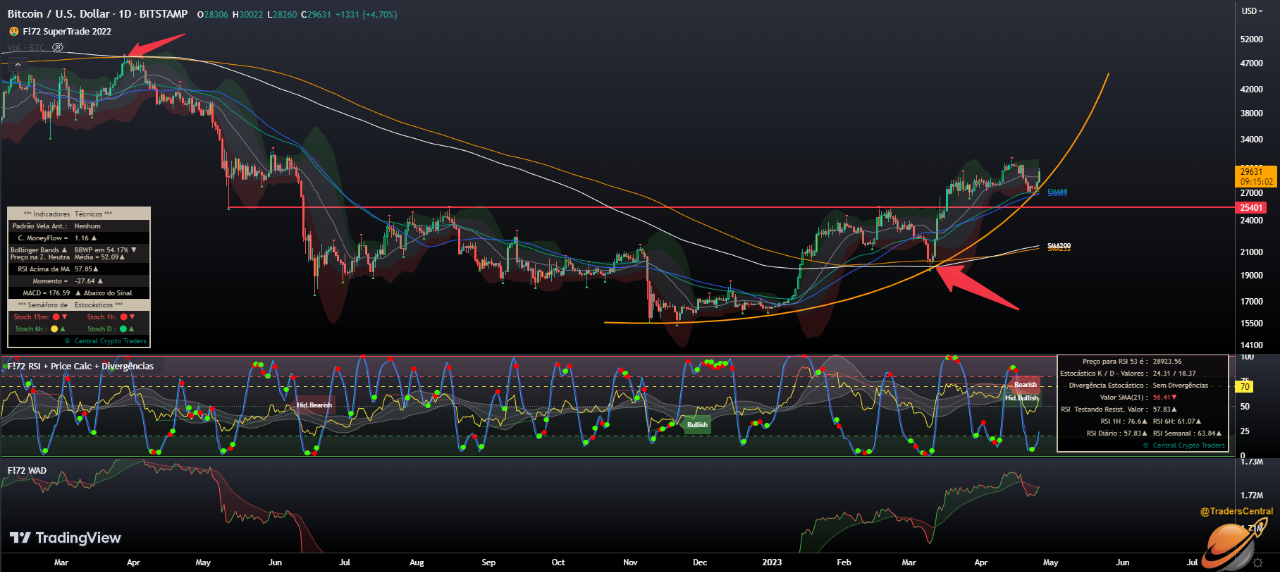
On the daily chart, looking at the long term, this movement may be decisive for a clearer, more concise and definitive trend reversal indication.
On this chart, two red arrows were drawn indicating resistance and support tests at the SMA200 and SMA233 averages. Notice how, when rejected at this average in ABR/22, the price plummeted and after the retest on it as support, the price is recovering.
This reading could be the watershed and a confirmation that this average may not be retested is a very bullish sign.

View original →The Weekly Close bearish and more correction could be coming.
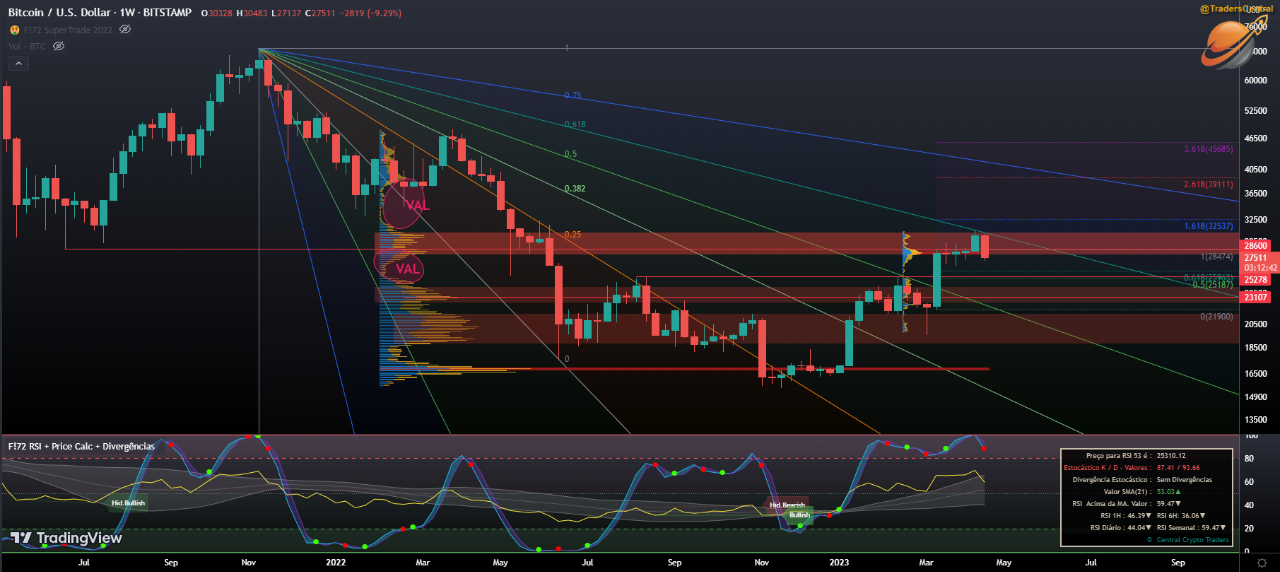
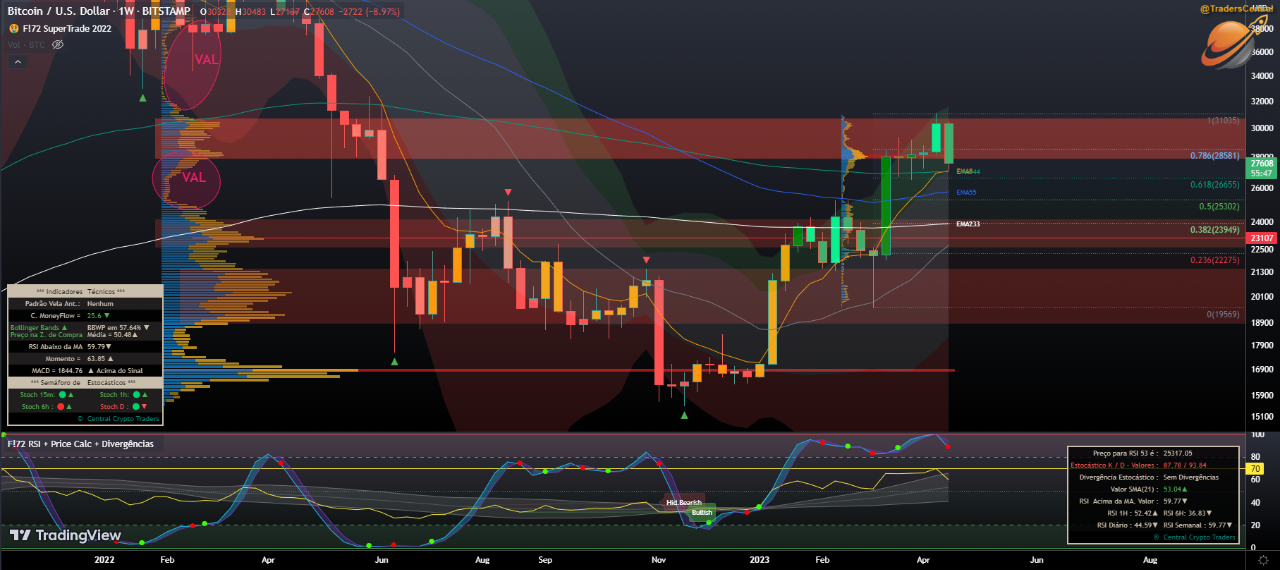
Last week's candle found strong resistance at the 0.618 Fibonacci Fan Speed line (FiboFan created from ATH to last min.) and the candle closes w/ a bearish engulfment, loosing the Point Of Control of this bullish leg.
The boost created in the March's 1st half, was stopped into FiboFan (diagonal lines of image 1) and missed its first target of 1,618, a very bearish sign as it lagged behind FiboFan itself, the bouncing line between the 2 ATH of 21 (28.6K) and a zone of VPVR as resistance.
With this, we have a Value Area Low and fibo's ignition candle lines 0.618 and 0.5 (between 26k and 25.2k) as retest/support of this movement. 25.3K is also historical support to be tested (previous highs).
On the other hand, we still having Stochastic Overbought and we have triple support at 27.1K: EMA8, EMA144 and the inner band of the Double Bollinger Band, which could mean that buyers can maintain this level if the bears do not decide to buy a fight this week.
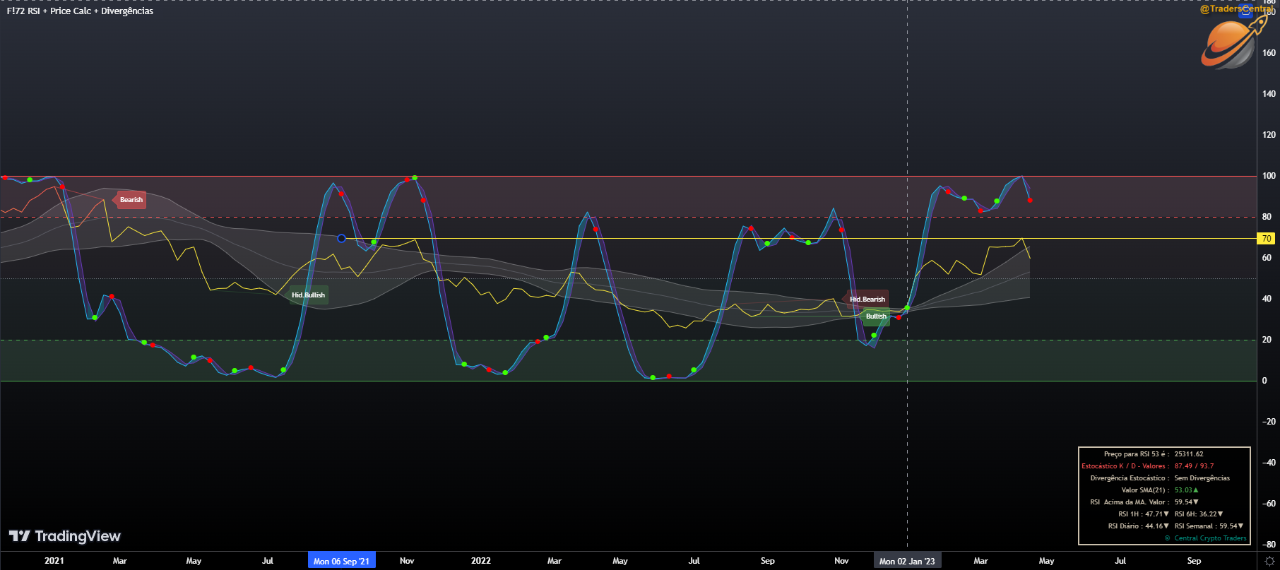
Pay special attention to the RSI, which didn't break the weakest Overbought line (70) but broke its first support of the year (the band above the BB of its average). The indicator had only threatened a retest in the upper band of the BB of its average in 2023 but without threatening a breakout.
The retest of its main average (SMA21 in this setup) will give us the answer to which way we will go in the retests of Price Action averages.

View original →Looking at the current BTC cycle, we see that cycle 4 differs from the others in several aspects mentioned in previous reviews.
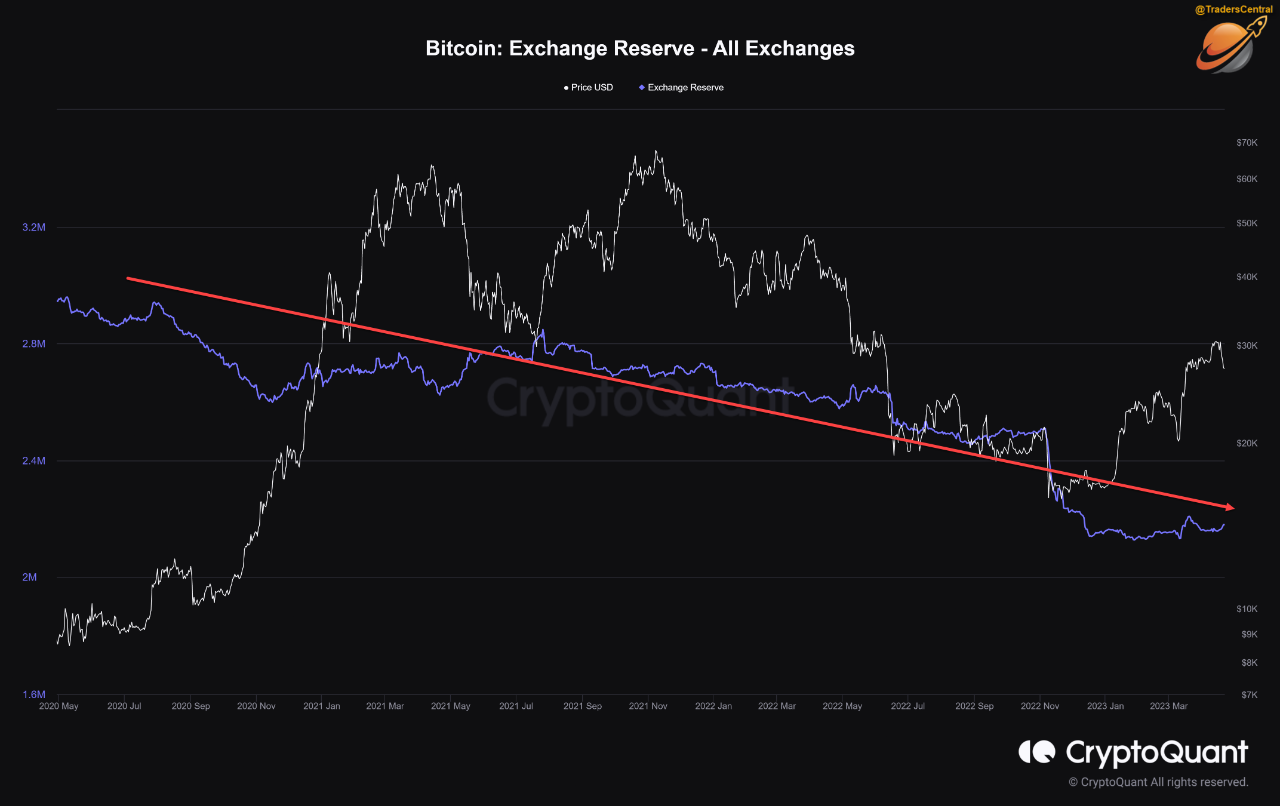
However, when it comes to exchanges reserves, we note that the poor performance of this cycle can be a very bullish sign: asset scarcity.
Note in image 1 how the BTC amount has been decreasing during the cycle (-33% of the total that was in reserve at the end of cycle 3).
The more scarcity we see in the market, the more expensive it becomes and the interest could picks up again.
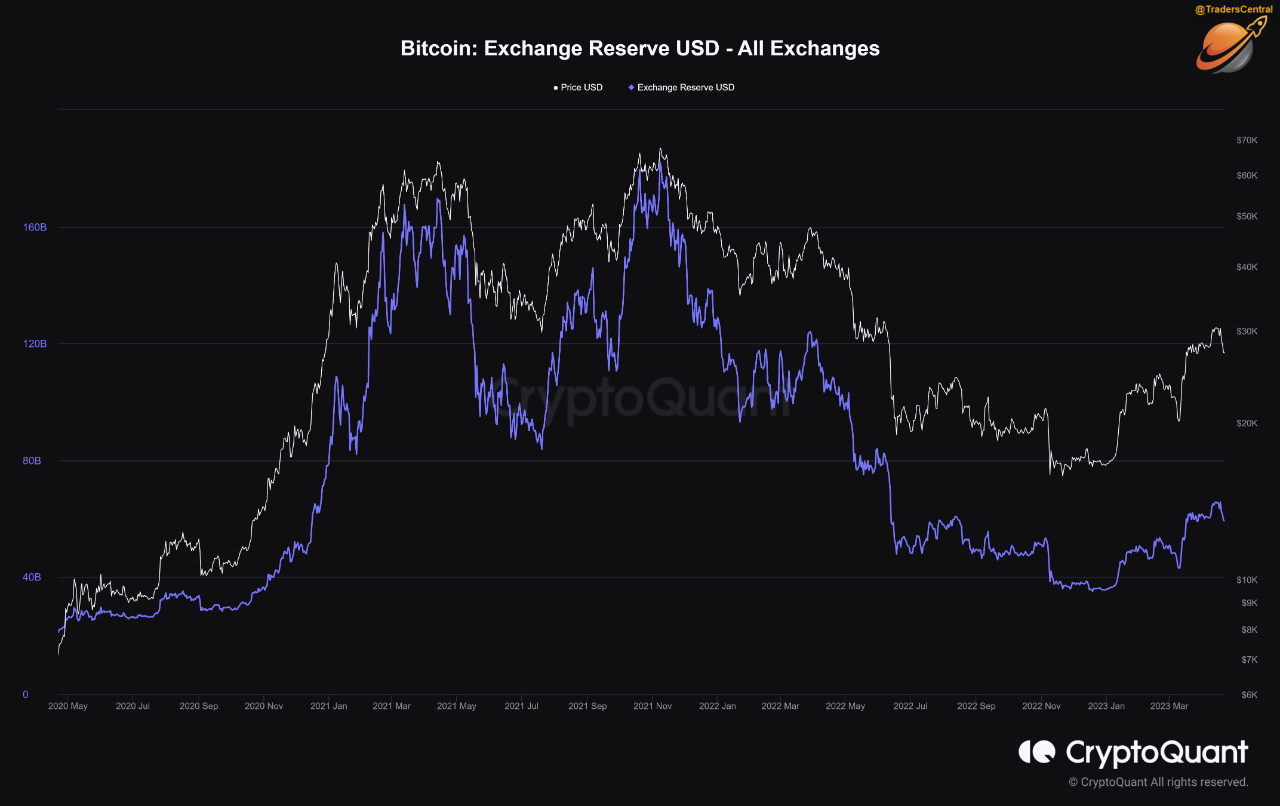
We can see in image 2 how the exchange reserves in USD tracks the price. This means that the Inflow is directly proportional to the price, evidence that the sentiment can play in favor of a new uptrend for the next cycle.
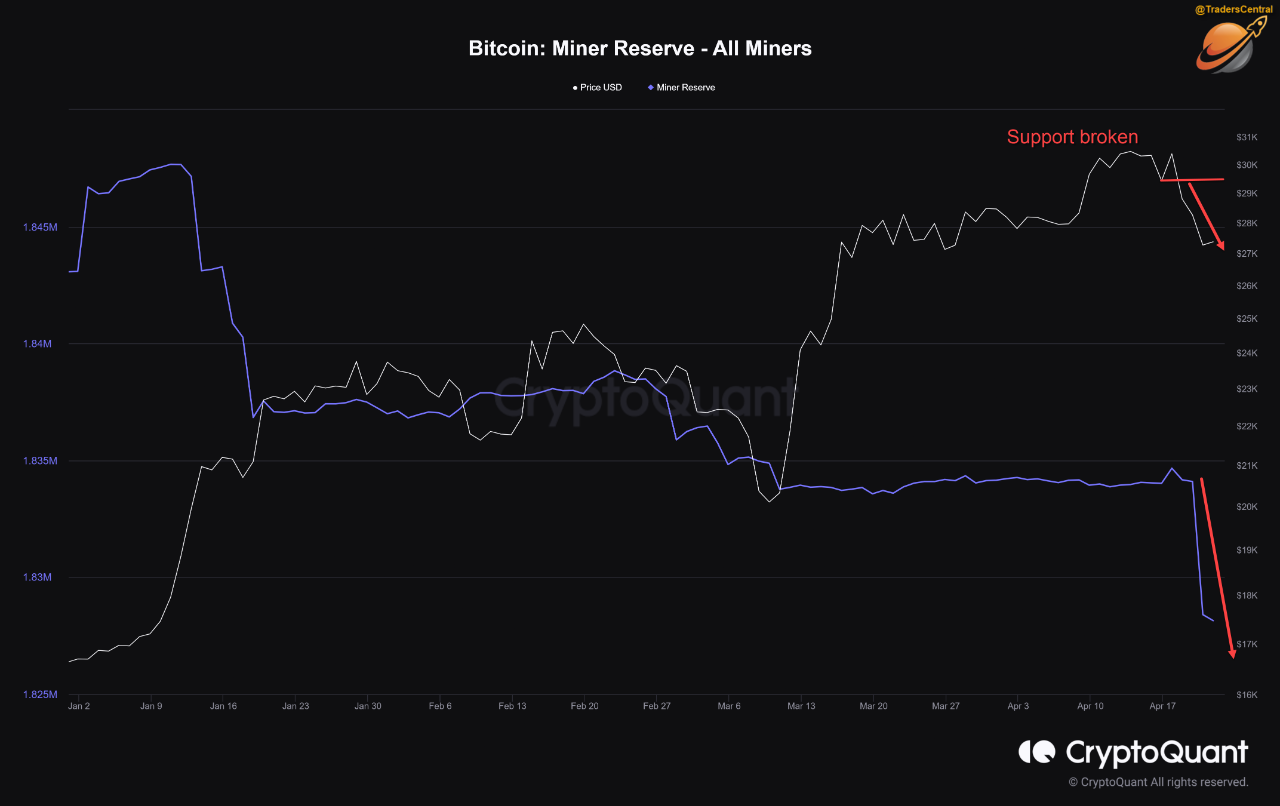
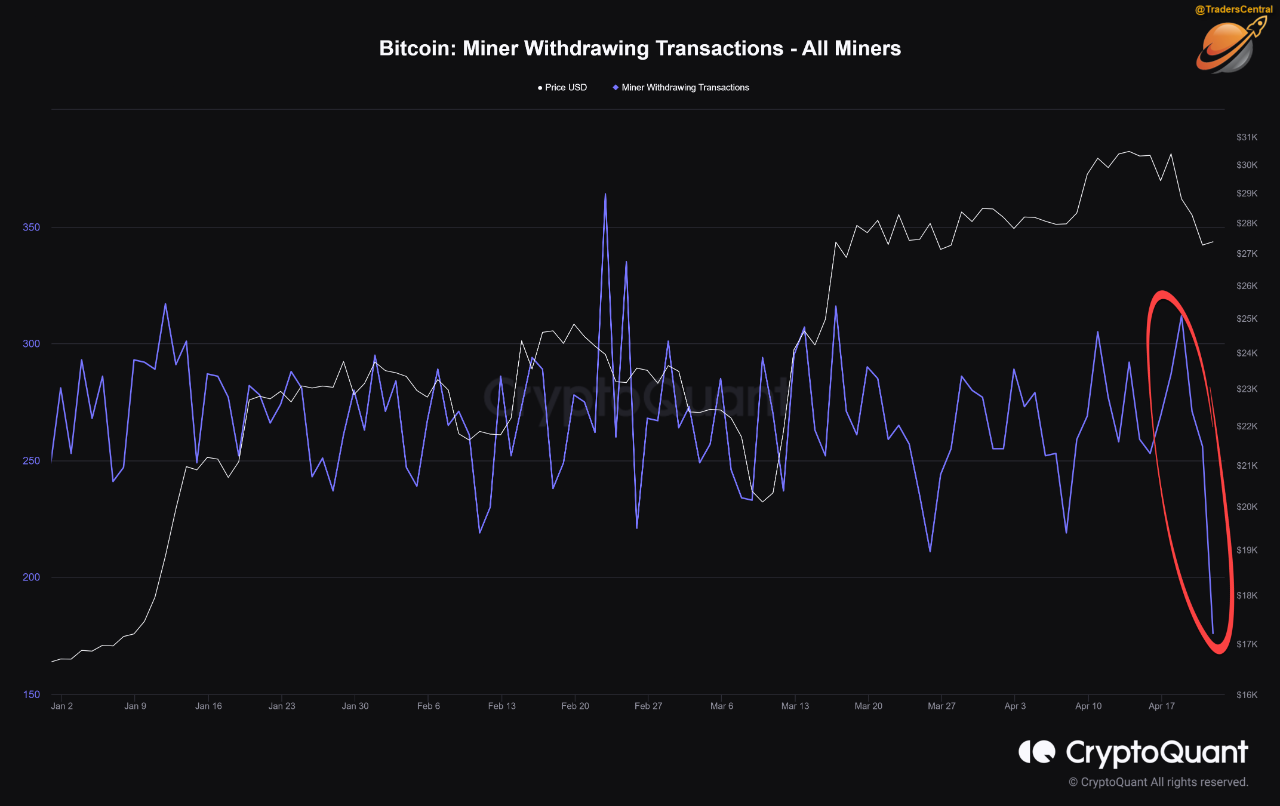
In Parallel We have an outflow coming from BTC by miners reserves: Since the break of 30K, there has been a large outflow of the asset (more than 6 billion USD) coming from the miner's addresses (image 3) followed by a large decrease also in deposits coming from these wallets (image 4).
As we can see, with the perception that the local top was reached and the breakout of the previous local bottom was achieved, possibly those BTC withdrawn served to take profits as we can see by the monthly SOPR (indicator remaining above 1)

View original →Bullish(Nuanced)BTC
4/17/2023 Today I'm going to show a study based on "Logarithmic Growth Scale" to understand where we are within cycle 4 and how we are compared to other past cycles.
As we know, in graphic analysis all movements happen in "waves" and this behavior tends to create cycles where we can insert ourselves in a context to understand what kind of movement we are doing.
Will an asset in which we have only 3 complete cycles really behave the same in the next cycles?
The fourth cycle shows that perhaps not. But to what extent this "maybe not" can be due to "Black Swan" events?
To answer that I am analyzing the "Logarithmic Growth Scale".
The scale shows the magnitude of growth in exponential order, in other words, that counts the exponent. Ex. 10^-2 < 10^-1 < 10^0 < 10^1 < 10^2 < 10^3 and so on.
This serves to normalize very large values and determine the growth of the object of study (BTC in this case).
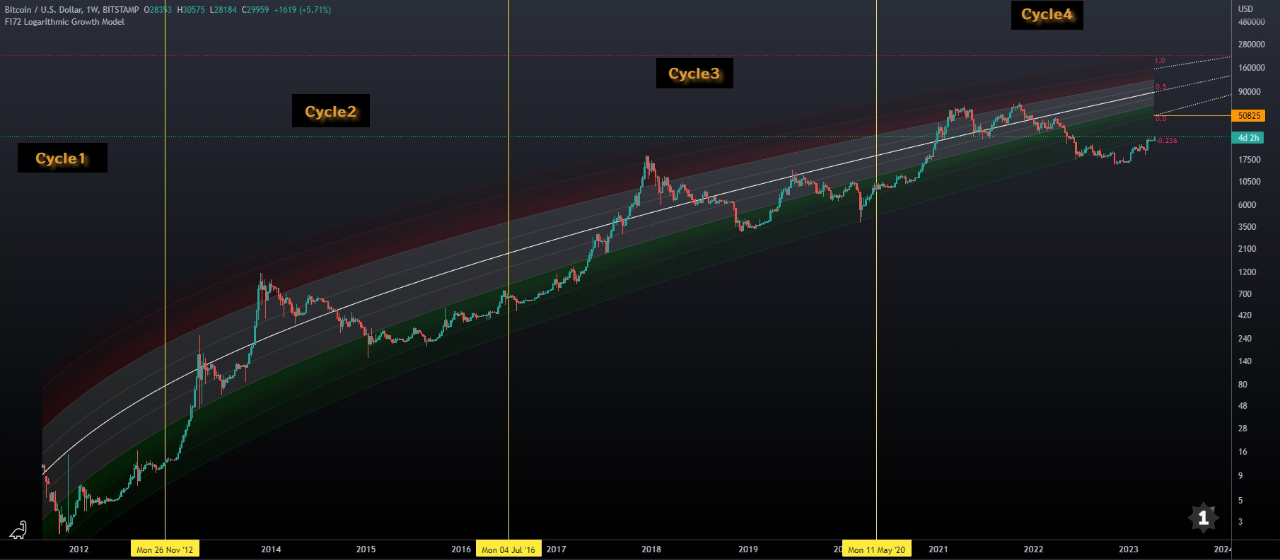
In the first image, I present the scale with the defined BTC cycles.
On the right we project the basic lines of the Fibonacci projection (0.0, 0.5 and 1.0) as a reference. Note that the bottom line is the 0.236 line below the zero line, that is, the projection goes both up and down.
The first detail noted is the break below the 0.0 that happened in May/22 from which we haven't left again until today. This breakout brought us below the first relevant line of a Fibo Retracement and represents that BTC has gone off the growth scale.
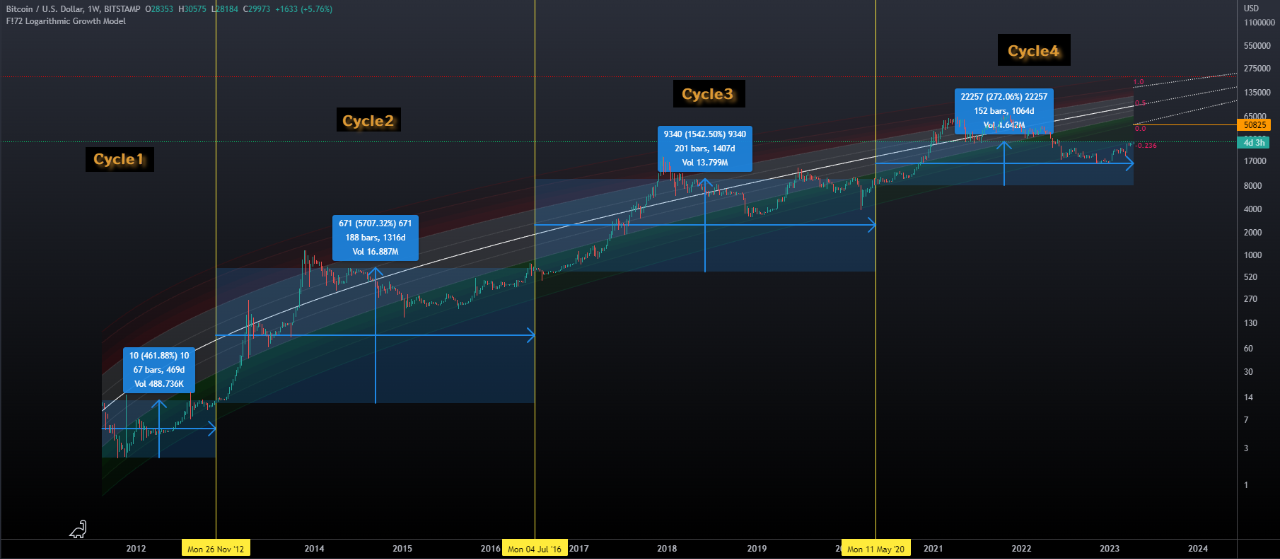
The image 2 projects the growth in cycle 1 (461% - magnitude 10^2) and in cycle 2 5700% (magnitude of 10^3). In the third cycle, we see a deceleration process but still maintaining the same magnitude (10^3 w/ 1542% growth). And for the cycle4, we see the first decrease in magnitude of this model, where until now there's 272% growth.
Conclusion: It's still too early to determine whether this is indeed a pattern. But there is evidence that the current cycle is already divergent from the others. It is also evident that Bitcoin has effectively stopped growing.

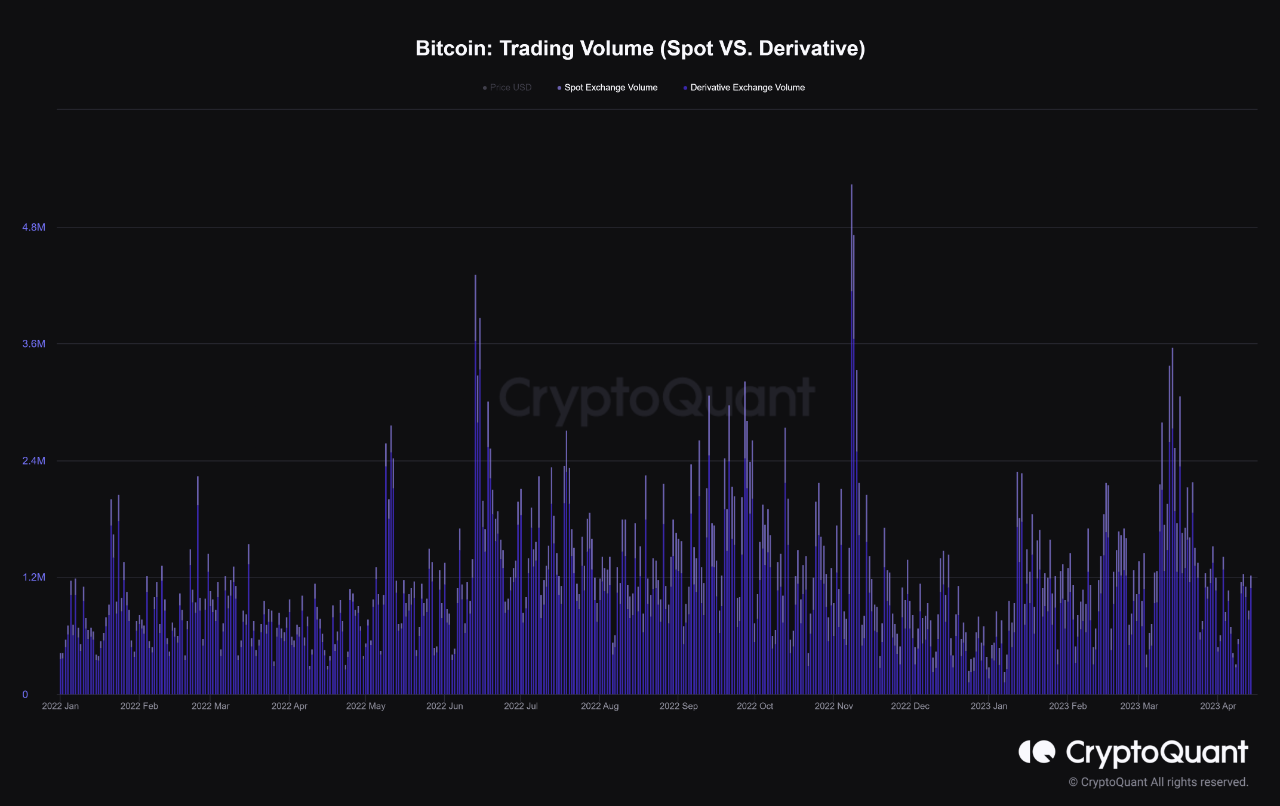
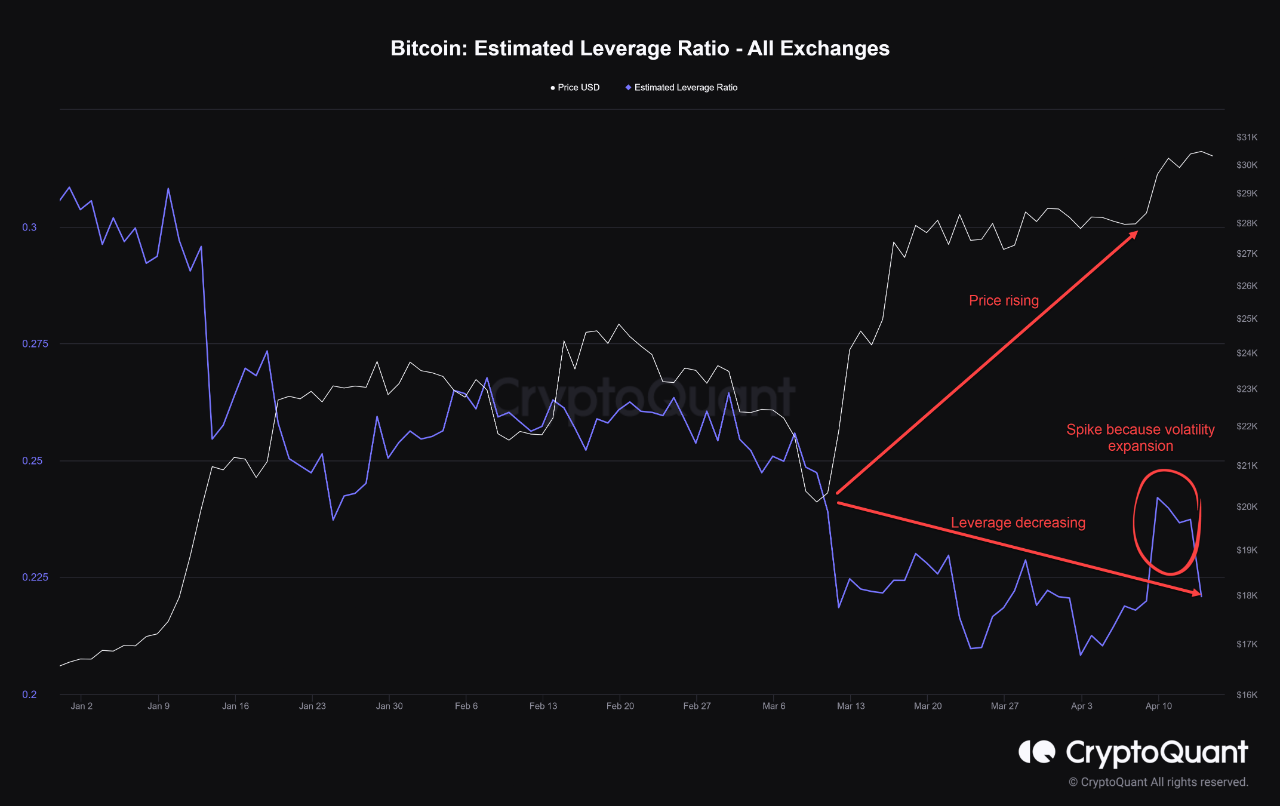
View original →The futures market had less leverage over the bitcoin price in recent months than the spot market (image1).
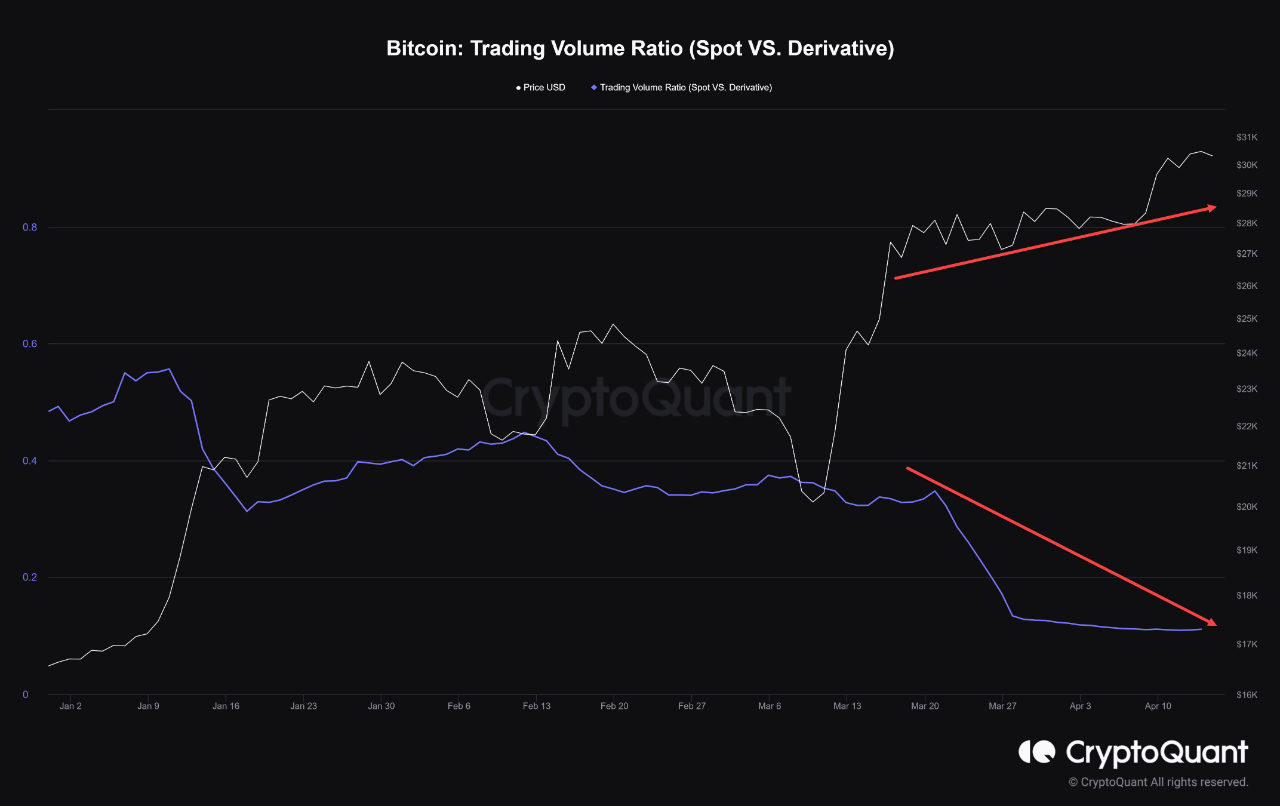
Leverage reduction, fewer open contracts and cumulative delta signal that spot activity is driving this momentum (image 2).
One of the main drivers of influence on bitcoin pricing is the derivatives market, which at the moment is mainly divided between perpetual futures contracts and options contracts.
These instruments allow "synthetic" bitcoin trading, that is, they trade contracts with exposure to BTC, but not necessarily to the "physical" asset.
Open Interest, which counts the number of open perpetual contracts, is a way to see the level of use and demand for these instruments.
With that we have a vision if there is a lot of demand for bets on these contracts and when there is not.
Image 3 shows exactly these data: in this period of lateralization the number of derivative contracts compared of market size continued to decline, indicating a reduction in the demand for the use of derivatives.
This drop signals that fewer traders are allocating capital via futures contracts, making this market have less influence on BTC pricing.
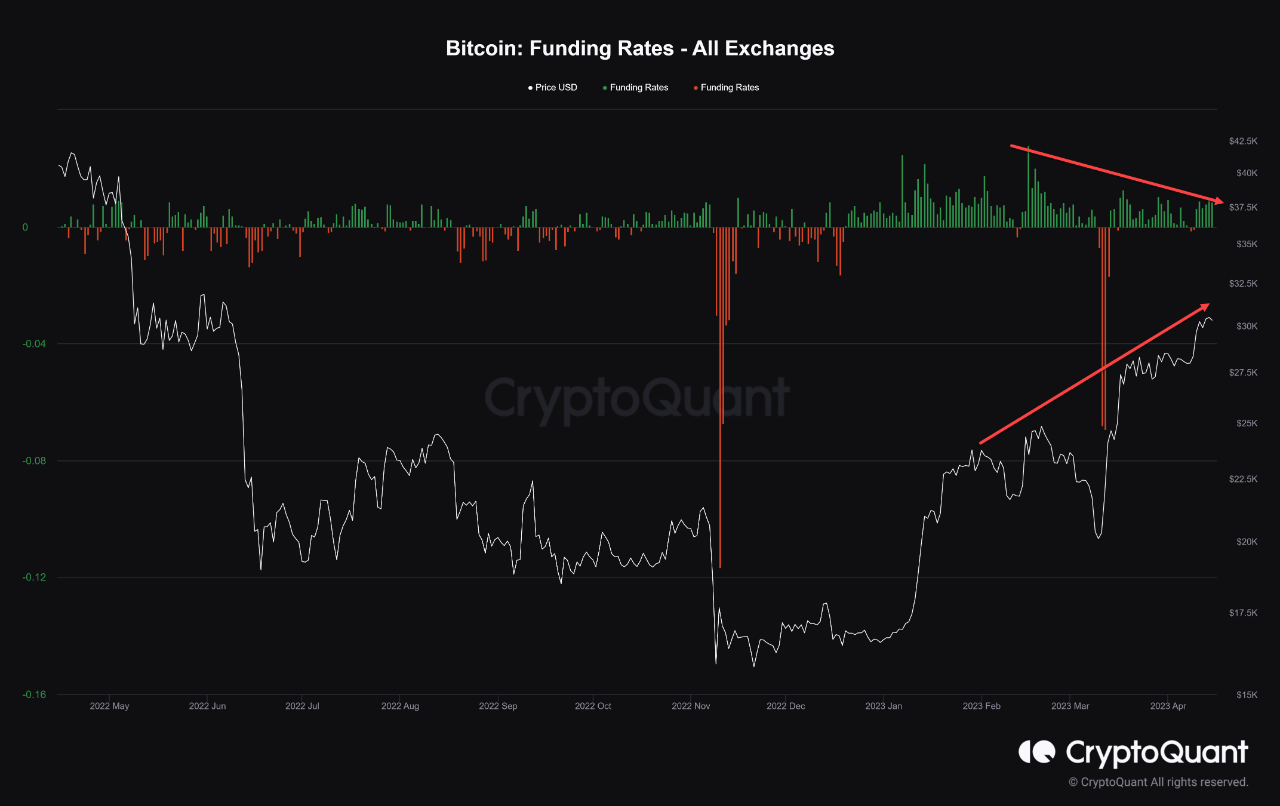
Another factor that supports the view of low derivative strength at this point in time is futures contract funding rates, which are relatively neutral compared to prior periods (image 4).
As they are relatively neutral, this signals shows there is little discrepancy between the price of futures contracts and the spot price, or in other words, there is fewer activity from traders using these derivatives.
At this moment we see more buying force in the last 30 days than selling force in futures contracts.
As we already indicated there are few open contracts and those contracts has no major directional bias, what remains to generate strength in the price of BTC is precisely the spot market.
What this means? Sentiment will rule the market until intelligent money takes back the control.

View original →

