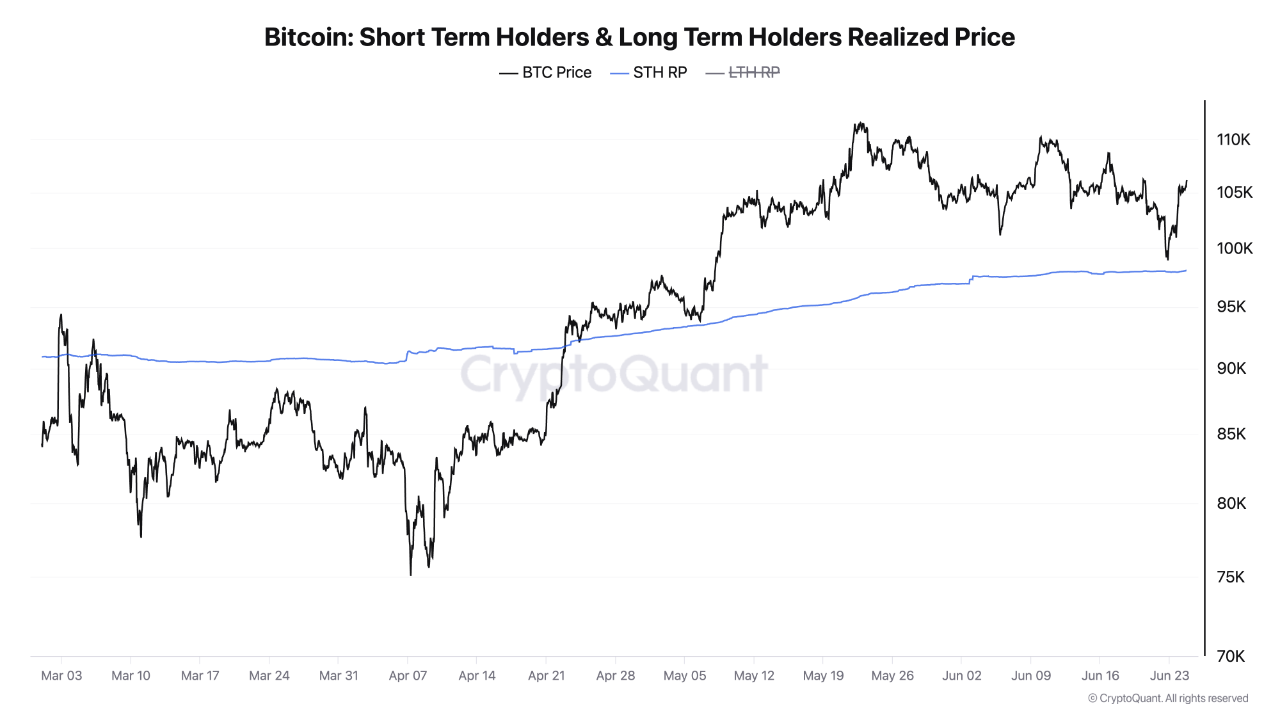
Two weeks ago I called the STH-Realized Price the “fault line” to watch. It’s still doing its job—here’s what the tape now says.
I. The metric refresher
STH Realized Price (STH-RP) = break-even for coins < 155 days old—where short-term conviction flips to fear.
II. Why this slow grind higher matters
Psychology upgrade: STH-RP is inching toward six figures. Each uptick hardens $100 k as the “fair value” floor in the collective psyche.
Where the line sits now?
- Spot: ≈ $106.4 k
- Short-Term Holder Realized Price (STH-RP): $98 k
- Premium (Spot ÷ STH-RP − 1): +7.2 %.
- Long-Term Holder Realized Price (LTH-RP): $32.0 k (unchanged trend).
III. Why this creeping blue curve keeps mattering
• Price Memory – Every ~$500 uptick in STH-RP resets the “new buyers’ comfort floor.” It’s now flirting with six-figure territory; the crowd’s mental stop-loss rises with it.
• Dynamic Support – Look at the chart: two tags of the blue line in the last 10 days, two sharp bounces. That’s classic bull-phase structure; sellers dry up the moment we kiss cost-basis.
• Risk Compression – Shrinking premium = less overheated froth. In prior cycles, a <10 % gap has preceded the next leg up once open-interest rebuilds.
• Veteran Supply Lock-Up – LTH-RP is still 3× lower than spot; coins in cold storage remain “strong hands” (no incentive to dump). Supply overhang simply isn’t there.
TL;DR
The blue line is climbing relentlessly; as long as BTC lives above it, the prevailing tide is still higher-lows, higher-highs. Lose it on a daily close, and we get our first real gut-check since April—otherwise the bull engine is merely cooling its cylinders.

View original →A fresh cohort of Bitcoin whales—wallet clusters holding ≥ 1 000 BTC with an average coin age under six months—has been stacking at a record pace.
🔎 Indicator in focus: Supply Held by New-Whales
This filter isolates new balance-sheet decisions by ignoring long-dormant cold wallets.
Key findings (1 Mar → 4 Jun 2025):
• Holdings doubled: from ~500 k BTC to ~1.1 M BTC (+600 k BTC / US $63 B).
• Supply share jumped: 2.5 % → 5.6 % of total BTC circulating supply (+3.1 pp), the equivalent of ten months of mining output removed from circulation.
Why it matters?
1️⃣ Fresh conviction: Young coin age shows these positions were built recently—this is new money, not shuffled legacy coins.
2️⃣ Supply squeeze: Rapid absorption of newly minted BTC tightens float and historically precedes periods of heightened upside volatility.
3️⃣ Sentiment signal: Aggressive, well-capitalised buyers are positioning ahead of the next macro catalyst (rate-cut cycle, ETF inflows, etc.).
What to monitor next 👀
🏦 Exchange inflows/outflows from this cohort for the first hint of profit-taking.
📊 ETF creation basket activity to confirm institutional demand.
🔄 Derivatives funding vs whale flows for early divergence signals.
The tape doesn’t lie: when young whales load up, market structure can change fast. Stay laser-focused.


View original →Bullish(Nuanced)BTC
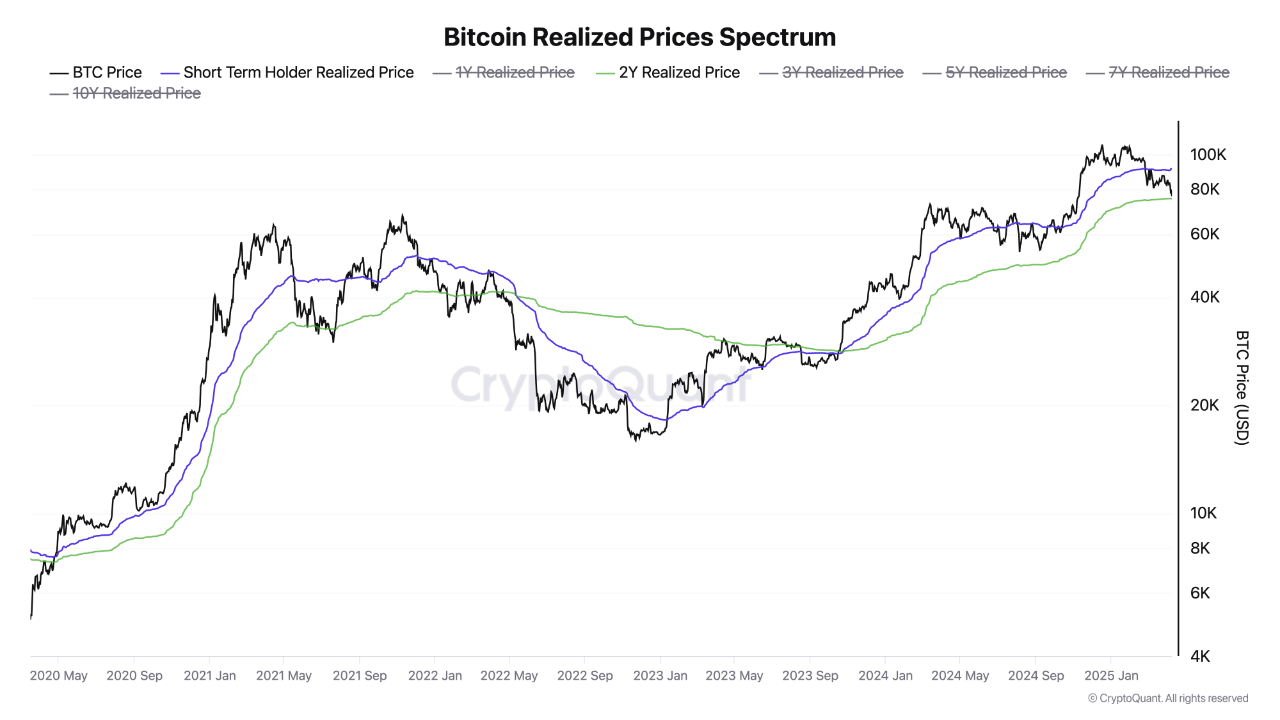
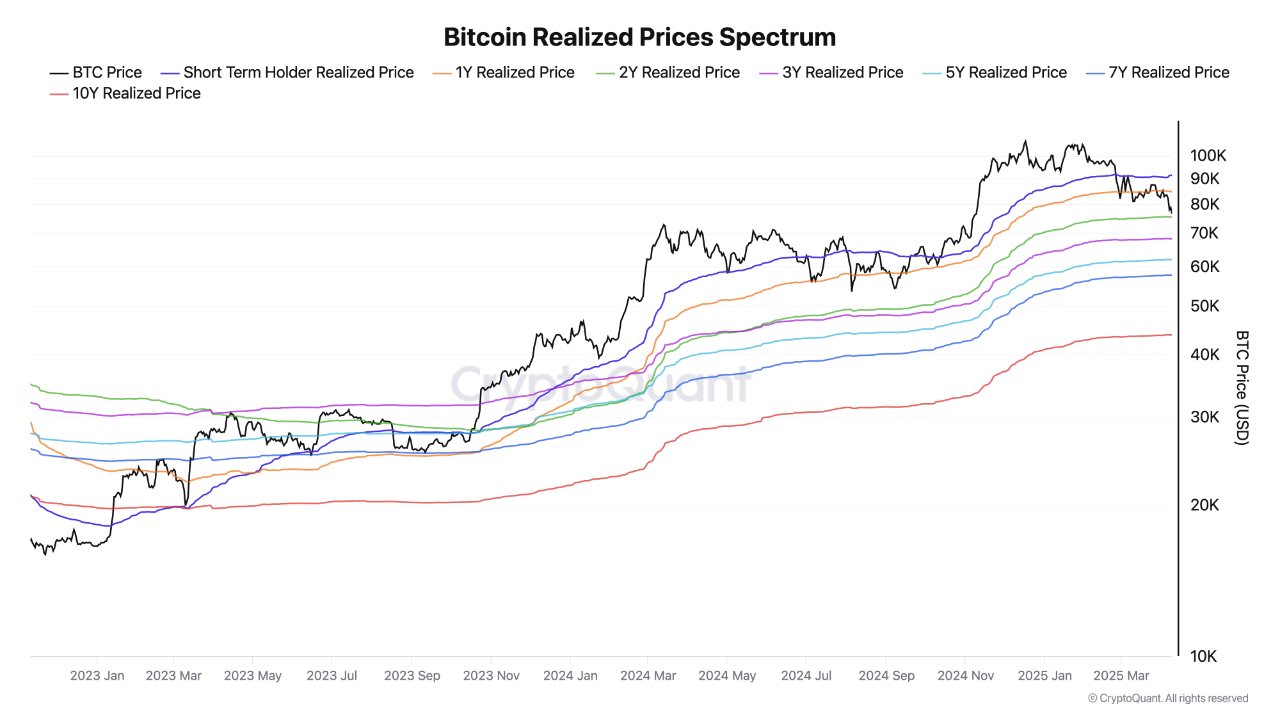
4/9/2025 The chart below presents the Bitcoin Realized Price Spectrum, capturing the average on-chain acquisition costs of UTXOs segmented by holding durations.
As of now, Bitcoin’s spot price is converging around the 2-Year Realized Price, which represents the average cost basis of all UTXOs last moved within the past two years. This dynamic threshold acts as a key psychological and structural support level—often reflecting the cost basis of market participants who entered during prior bullish or early-cycle phases.
What’s particularly noteworthy is that BTC has remained consistently above this 2Y Realized Price since October 2023, indicating sustained investor confidence and the potential formation of a long-term value floor.
If the price continues to hold or bounce off this level, it may signal a reinforcing base of capital inflows, strengthening the case for continued upward momentum.

View original →Bullish(Nuanced)BTC
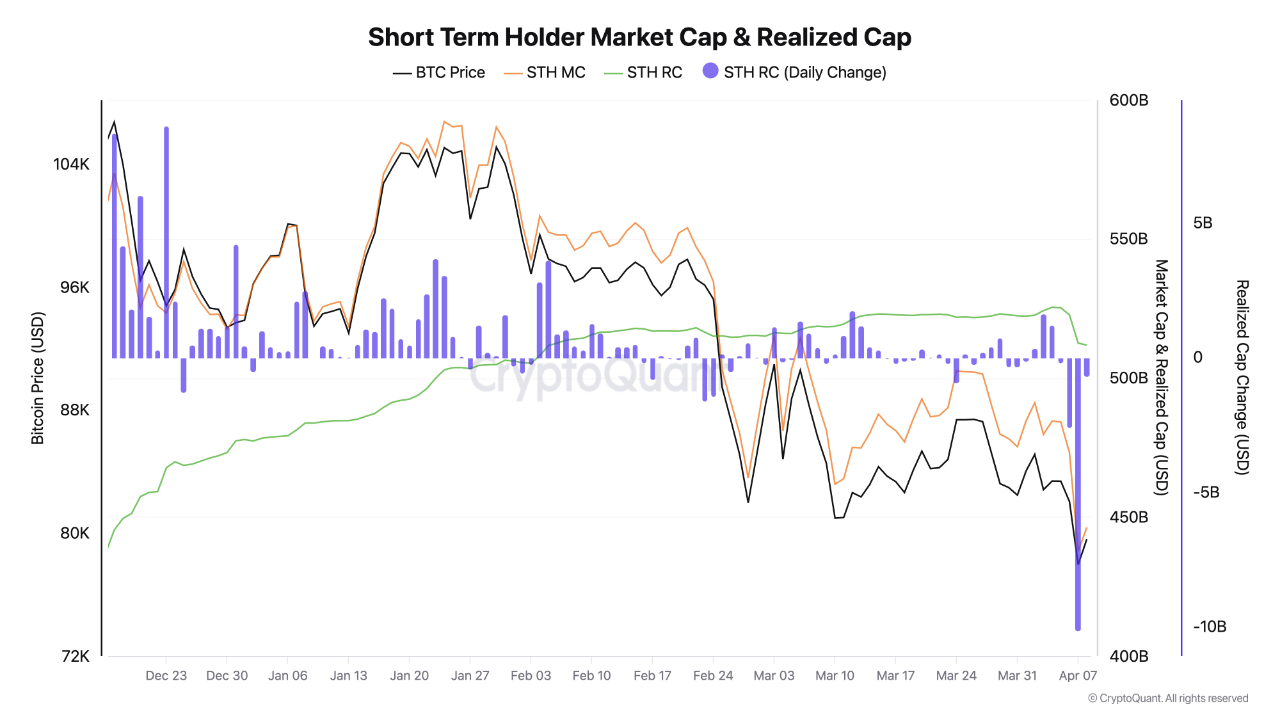
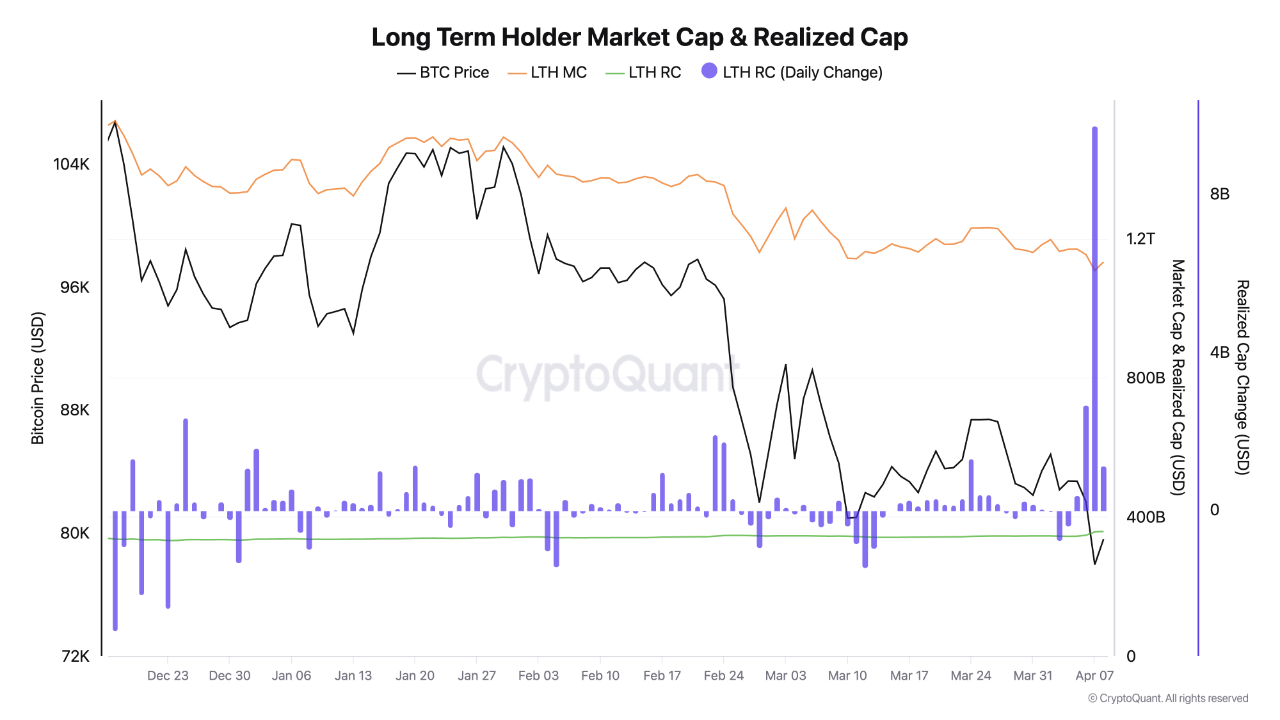
4/8/2025 Over the past week, Bitcoin has experienced a ~15% drawdown, sliding from ~$88,000 to ~$74,400. While price action often captures headlines, the real story lies beneath the surface, in the structural behavior of capital held by different market cohorts.
🔍 Key On-Chain Observations
On April 7th, we witnessed a pivotal moment:
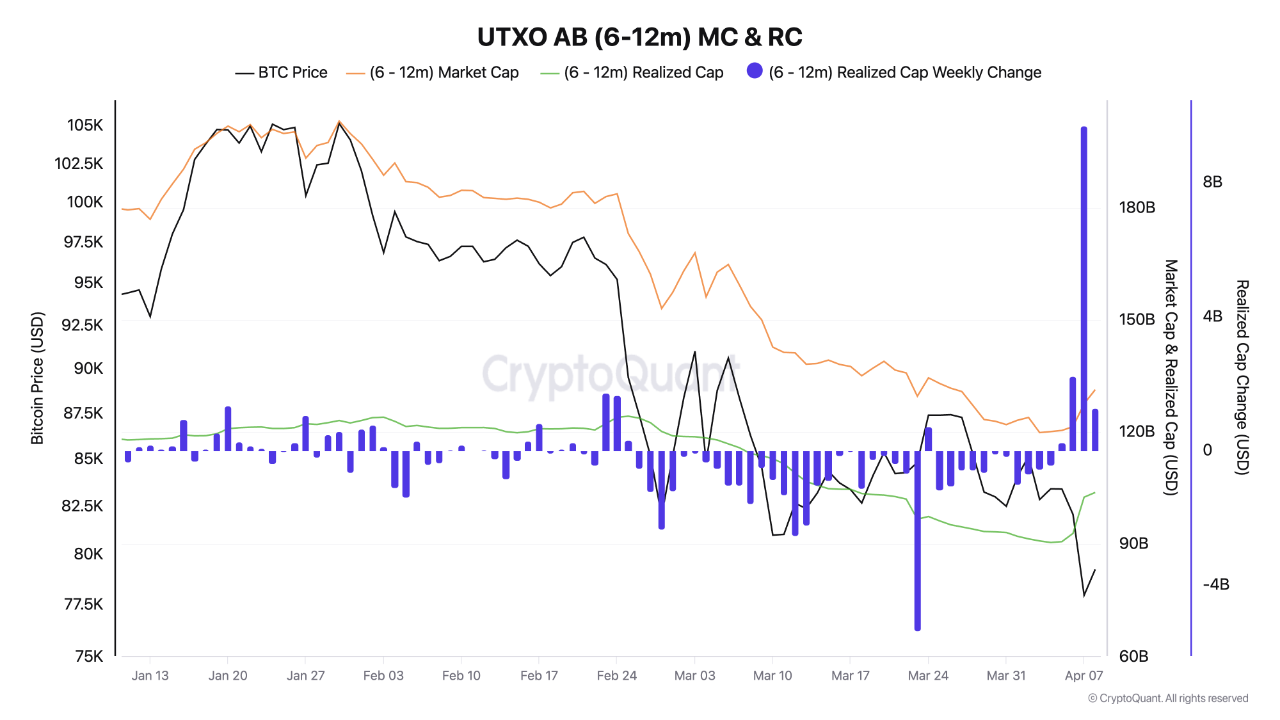
Short-Term Holders (STH) experienced a $10 billion decline in realized price, likely reflecting a transition of more than $9 billion to Long-Term Holders (LTH) and less than $1 billion in realized losses. Their largest single-day realized cap decrease in this cycle.
In parallel, Long-Term Holders (LTH) increased their realized cap by $9.7 billion, indicating large-scale accumulation.
📊 This is not merely a coincidence: this is the market transferring coins from weak to strong hands.
The narrative continued into April 8th:
- STH losses slowed significantly (–$693 million), showing signs of capitulation exhaustion.
- LTHs continued accumulating, adding $1.13 billion to their cost basis—despite sideways price action.
🧠 Interpretation
This structural divergence between STHs and LTHs is significant:
Short-term investors are exiting in panic: locking in losses.
- Long-term investors are stepping in with conviction: buying weakness and absorbing supply.
- This behavior has historically marked the late stages of corrections or the early phase of recovery.
📐 Implications for Market Structure
- The STH cohort is shedding supply: reducing near-term overhead resistance.
- The LTH cohort is strengthening its hold: a sign of growing belief in long-term upside.

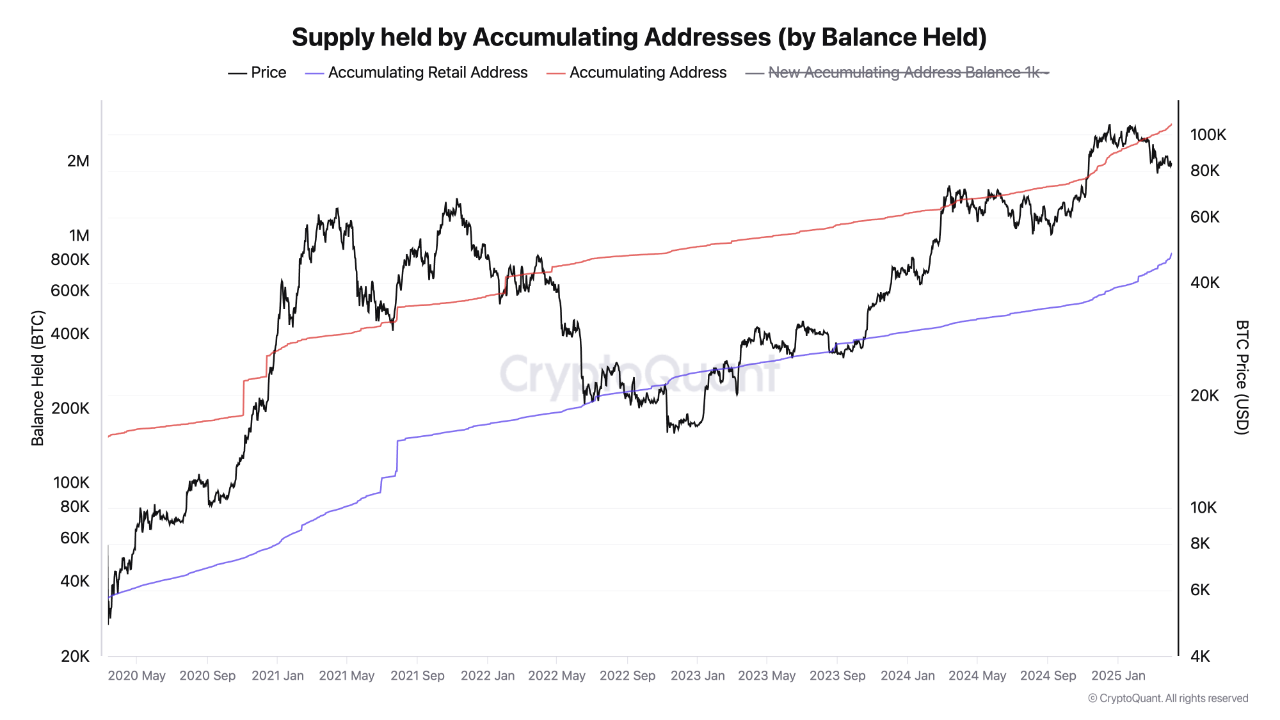
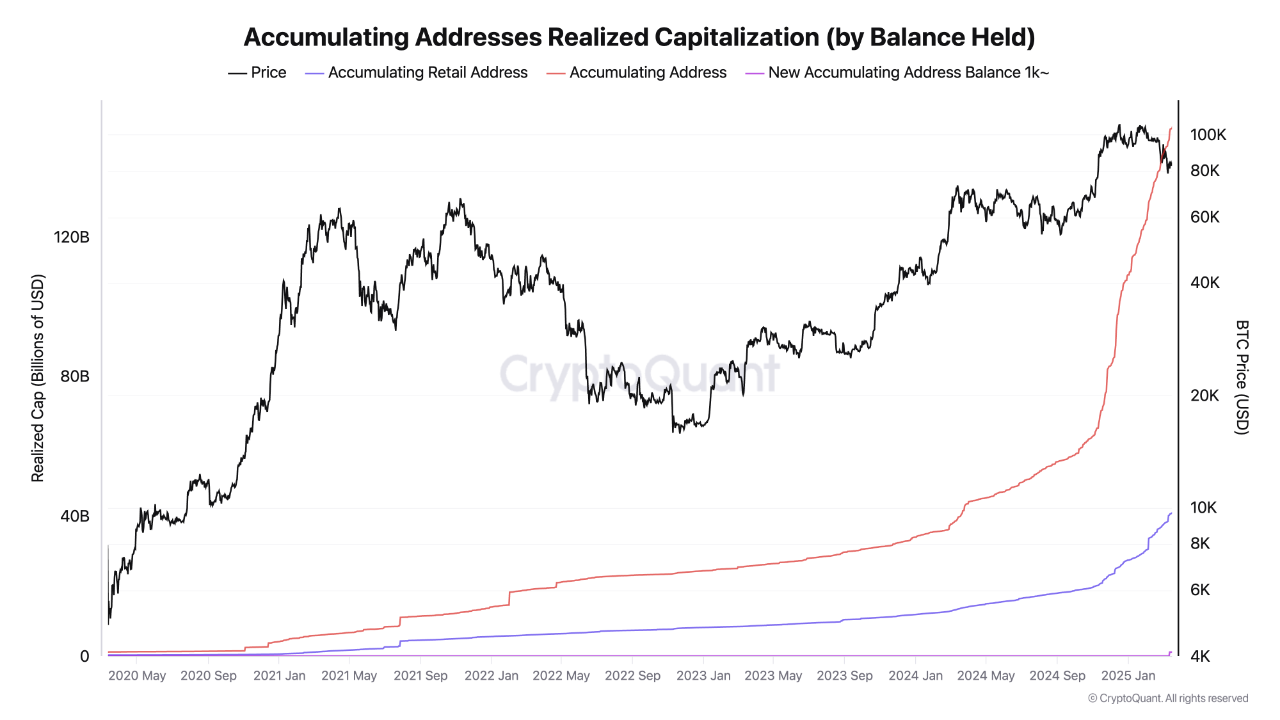
View original →Accumulating addresses continued buying even as prices reached new all-time highs. The realized cap chart shows accumulating entities were willing to deploy significant capital at these elevated prices.
The relationship between these two charts reveals a profound insight:
Realized cap increased from ~$20B to ~$160B between 2023-2025
BTC supply held increased from ~800K to ~3M BTC in the same period.
This indicates the average acquisition price per bitcoin for accumulating addresses rose substantially, yet accumulation accelerated rather than slowed. A strong evidence of high-conviction buying regardless of price increases.
Perhaps the most telling signal is the widening gap between retail and whale realized capitalization in late 2024:
- Larger holders significantly accelerated their dollar-cost averaging at higher prices.
- While retail accumulation continued growing, it couldn't match the capital deployment of larger entities.
- This realized cap divergence is a classic on-chain signal of smart money positioning ahead of potential supply shocks in the coming market cycle.
Market Implications:
1. Supply-Side Pressure
The accelerating removal of BTC from circulating supply into non-selling addresses creates mounting supply-side pressure that could become more apparent following periods of market volatility.
2. Conviction Through Volatility
The consistent accumulation through both bear and bull phases demonstrates remarkable holder conviction regardless of short-term price action.
3. Future Supply Dynamics
If these accumulation trends continue, an increasingly significant portion of Bitcoin's fixed supply will be held by entities demonstrating long-term holding behavior, potentially amplifying the impact of future supply shocks.

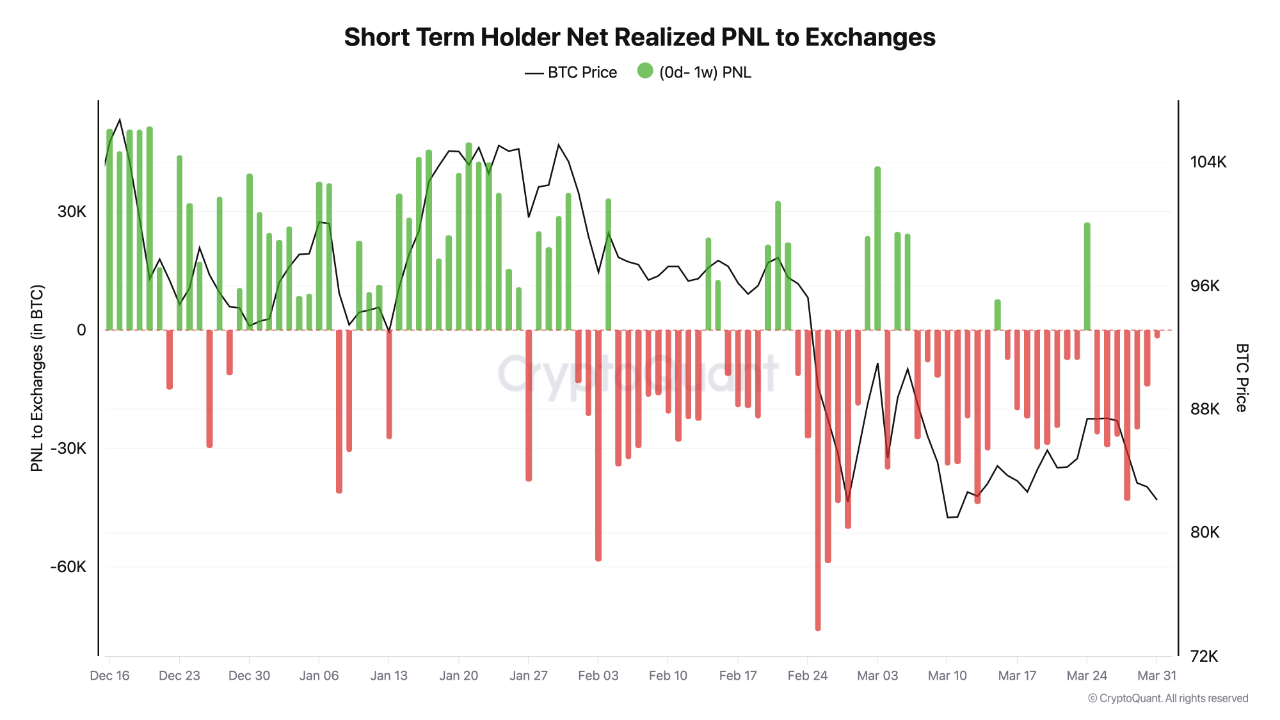
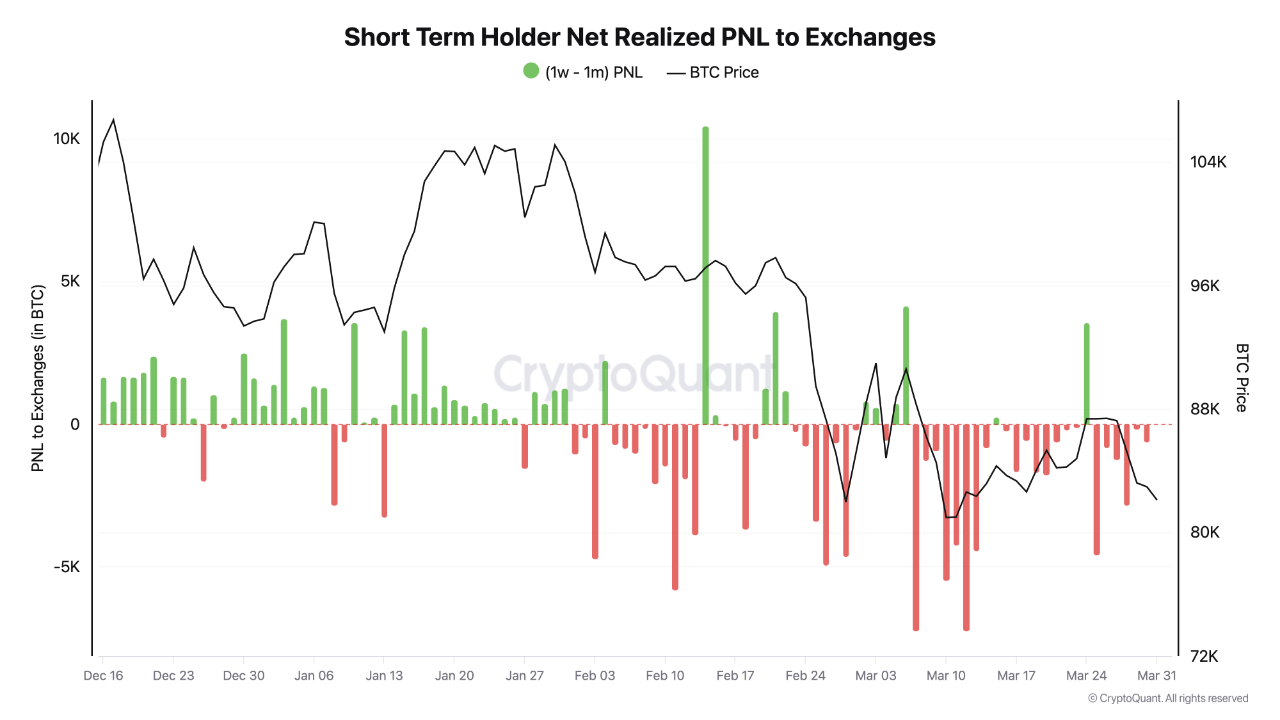
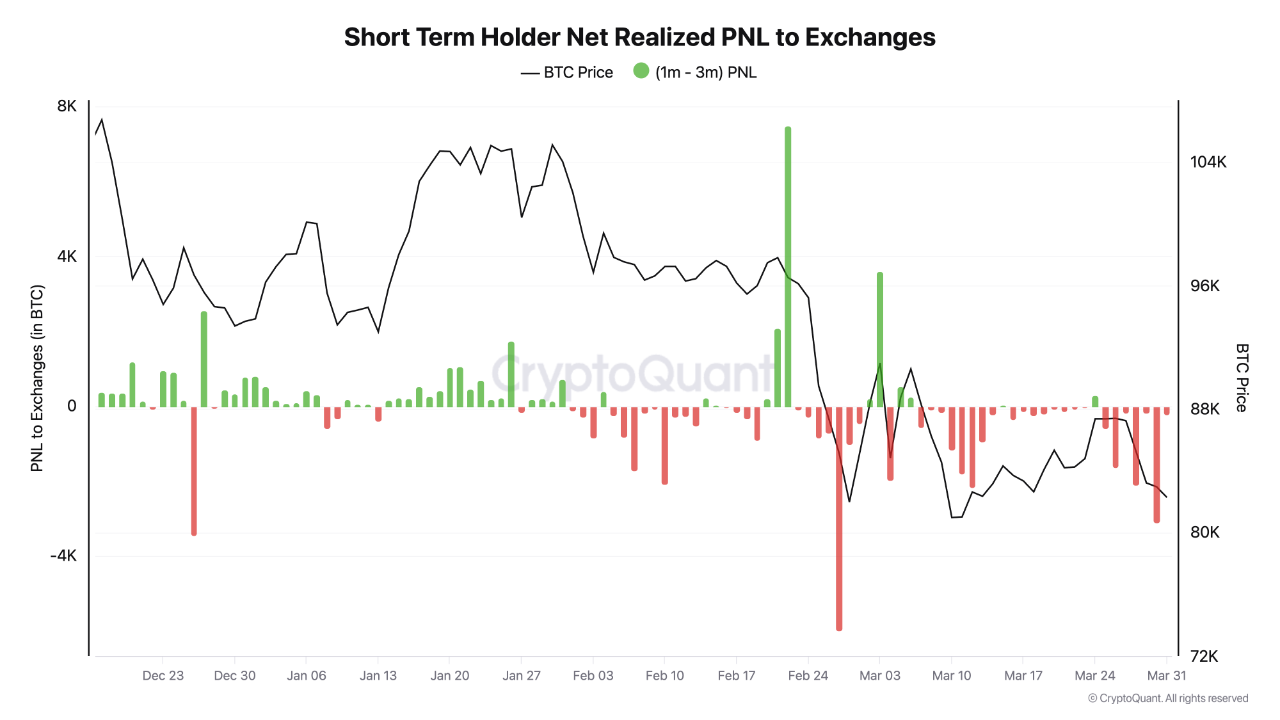
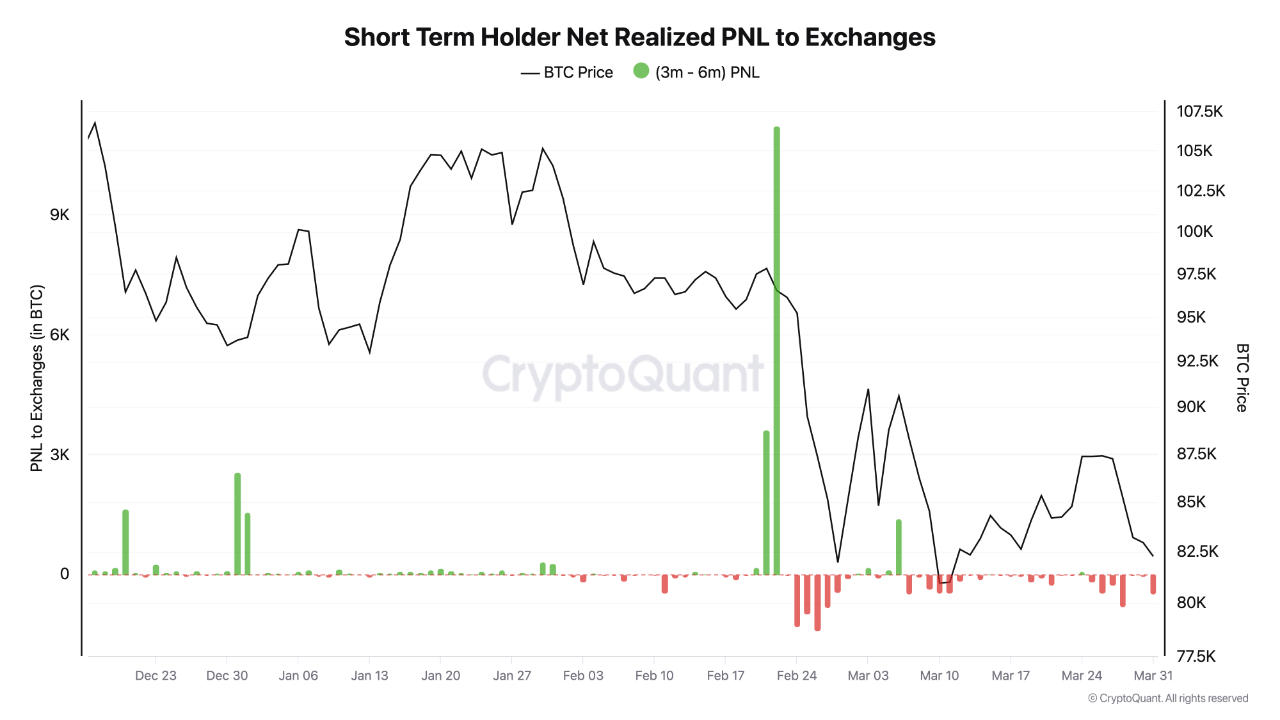
View original →One of the most powerful on-chain metrics for understanding short-term investor behavior is the Short-Term Holder Net Realized PNL to Exchanges (CEXs).
It tells us:
✅ Who is selling? (by age of the coins spent)
✅ Are they selling at a profit or a loss?
✅ How intense is the selling pressure?
🔍 What’s Happening Now?
Bitcoin holders who have held their coins between 1 month and 3 months have been the most active sellers over the past few days—realizing losses. This is a significant shift because, historically, the most reactive sellers tend to be those who have held for less than a week (0d-1w cohort).
But here’s where it gets interesting:
💡 The realized losses have been relatively low compared to unrealized losses.
💡 Selling pressure to exchanges has noticeably declined.
This indicates that, on average, short-term holders who purchased Bitcoin within the last six months are opting to hold onto their assets rather than panic sell.
They see value in their positions despite being in the red.
⚖️ What This Could Mean
In previous cycles, heavy realized losses often preceded local bottoms.
But when we see a slowdown in selling pressure, it can indicate a shift in sentiment: A willingness to endure short-term pain for long-term gain.
This data doesn’t predict the future, but it gives us a clearer picture of market psychology. Are short-term holders finally holding the line? If so, this could reduce downside volatility and set the stage for stabilization, or even a reversal.
Btw, Short-term holders currently own 28% of Bitcoin’s circulating supply. If these UTXOs transition into the hands of long-term holders, it could serve as a driving force for Bitcoin’s ultimate surge beyond $150K.. I stand by my words.
🚀 What’s next? The coming weeks will be crucial. If we continue to see weak realized losses and lower selling pressure, it could signal a bottoming process in action.
Your move, Bitcoin.

View original →Bullish(Nuanced)BTC
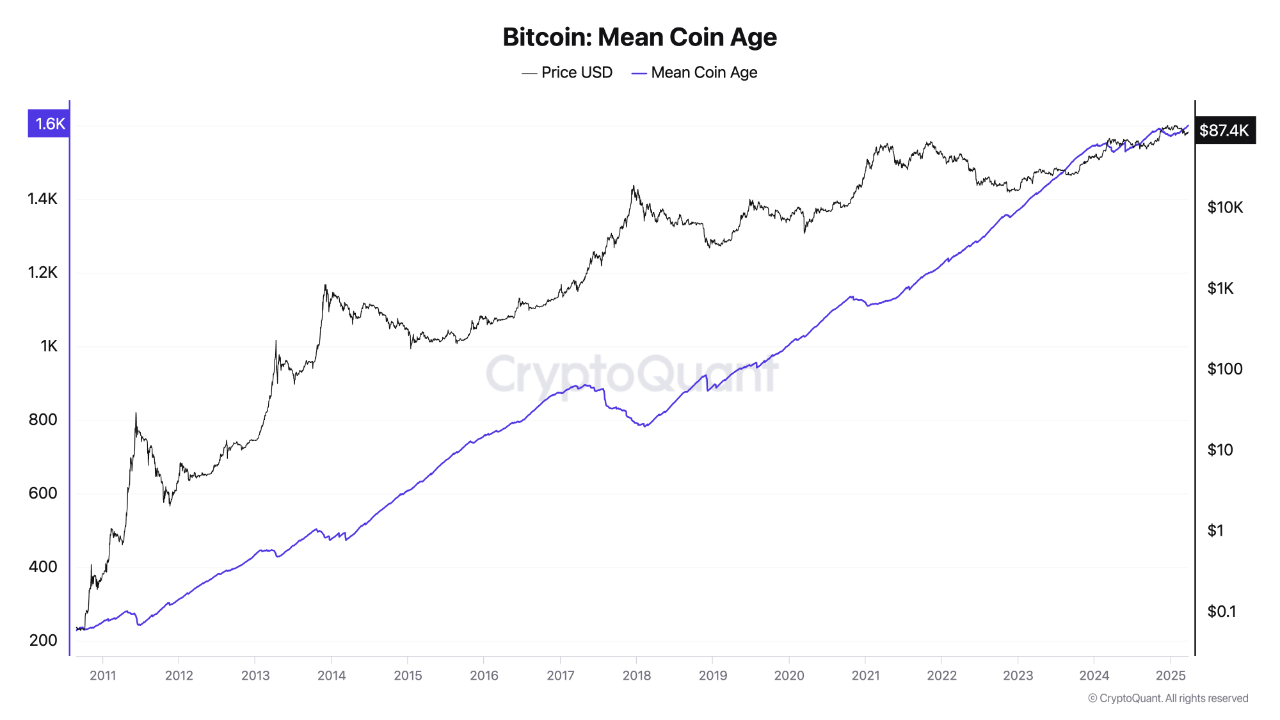
3/27/2025 Mean Coin Age(MCA): MCA is the average age of UTxO (in days).
The key insight here is that Bitcoin’s upward movement is driven by the decisions of long-term holders, whose behavior is far from random. Long-term holders accumulate bitcoins during periods of discounted prices and hold through periods of volatility. Their actions create an ecosystem where bitcoin’s price appreciates gradually as coins are absorbed into strong hands.
BTC’s total supply is capped at 21 million bitcoins, and as bitcoins get held by long-term holders, they become less liquid in the market. This illiquidity creates a supply-demand imbalance, contributing to upward pressure on prices when demand increases. As fewer coins are available for trading, the price becomes more sensitive to buy-side pressure, leading to stronger upward price movements.
A sudden drop in MCA signals that long-term holders are moving their coins. This is not random behavior but a reaction to specific market conditions—whether it be profit-taking, fear of a market correction, or a shift in broader economic trends. The movement of these coins from long-term holders can drive short-term volatility and is a signal that market dynamics are changing.
Do not be fooled into thinking that random events—whether it’s Trump speaking about Bitcoin, Elon Musk tweeting, or BlackRock launching a Bitcoin ETF—are what drive Bitcoin’s price. This is nothing but foolishness. The truth lies within the data itself. The blockchain speaks clearly and transparently, and it is through this data that we can understand bitcoin’s true movement.
S.N architected Bitcoin to ensure that the financial information we need is open and accessible to all, so we can make informed decisions, not be misled by the stupidity of popular narratives. Let the data guide us, not the whims of outsiders who misunderstand what is truly happening.
Be informed and not misled by the noise of the media or the misunderstandings of those who fail to truly grasp the bl

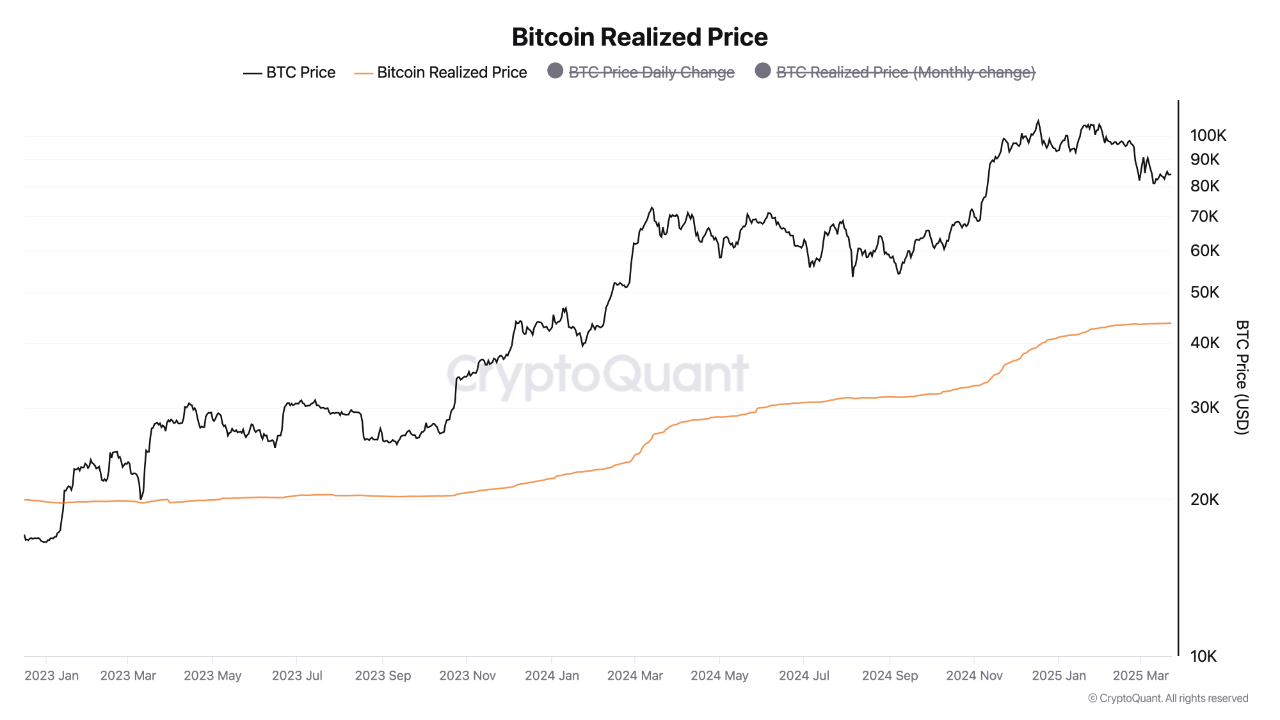
View original →The Bitcoin Realized Price has now reached $43.6K, meaning that every circulating BTC has been acquired, on average, at this price. With Bitcoin’s market price hovering around $84K, this implies an unrealized profit ratio of ~ +92% for the average holder.
But the big question is: Will the realized price reach the market price ATH of $70K from the previous cycle?
🔍 Understanding Realized Price
The Realized Price is different from the market price. Instead of looking at the current BTC price, it calculates the average price at which all Bitcoins last moved on the blockchain. It’s a powerful metric because it reflects the cost basis of BTC holders, offering insight into market sentiment and potential resistance levels.
Historically, the realized price increases as new capital flows in, pushing the market price higher. During bull cycles, long-term holders take profits, leading to BTC changing hands at higher prices and lifting the realized price.
🔮 Will Realized Price Reach $70K?
For the Realized Price to hit $70K, we would need a significant number of BTC transactions at prices above the current RP, meaning new buyers entering at higher prices.
If this scenario plays out, the Bitcoin market price would likely need to reach well above $150K–$180K to sustain enough volume at these levels and pull the realized price up to $70K.
🚀 What This Means for BTC’s Future
• If Bitcoin’s realized price continues rising steadily, it signals strong conviction among buyers, reducing downside risks.
• A realized price of $70K+ would mean BTC’s previous all-time highs have been fully absorbed into the market and that Bitcoin has entered a new price era.
• Historically, BTC trades 3–4x above the realized price at cycle peaks, which aligns with projections of BTC hitting $150K+ this cycle.

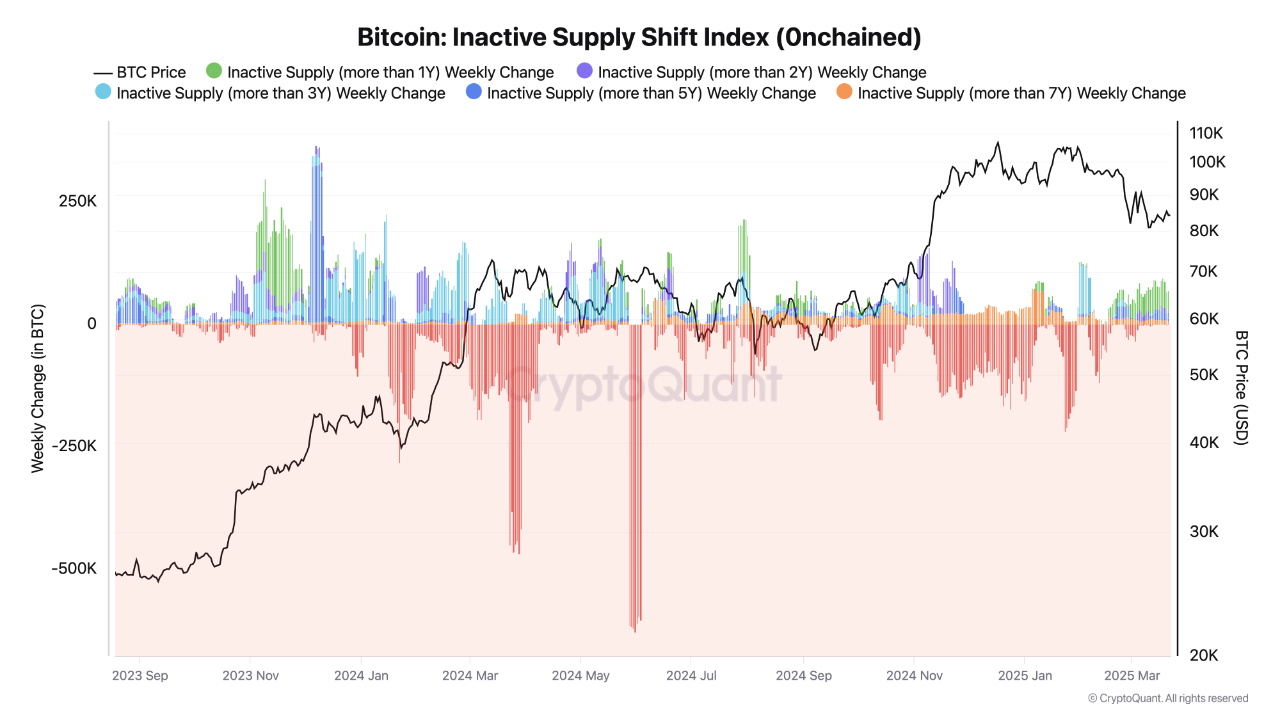
View original →Bitcoin’s long-term holders (LTHs) remain steadfast, and the data leaves no room for speculation—their coins aren’t moving. The Inactive Supply Shift Index (ISSI), developed by 0nchained, offers a precise lens into the behavior of these seasoned market participants. This advanced on-chain metric measures the degree to which long-dormant Bitcoin supply is shifting, providing a clear signal when LTHs decide to liquidate or continue accumulating.
Implications for Long-Term Holders (LTHs)
LTH behavior is one of the most critical indicators of Bitcoin’s market cycle health. Historically, when LTHs hold firm, it reflects strong conviction and a supply squeeze, often preceding major price expansions. Conversely, when they begin to distribute, it typically aligns with market tops.
At present, ISSI shows no meaningful LTH selling pressure, reinforcing a narrative of structural demand outpacing supply. In other words, the smart money isn’t exiting—it’s positioning for the next phase of Bitcoin’s trajectory.
Beware of Misinformation
Despite the data, misleading narratives persist, suggesting that Bitcoin’s long-term holders are capitulating. Such claims often lack on-chain validation and are driven by sensationalist market sentiment rather than objective analysis.
Trust data, not noise, verify sources and cross-check on-chain metrics like ISSI before accepting any claims about Bitcoin’s long-term holder behavior.

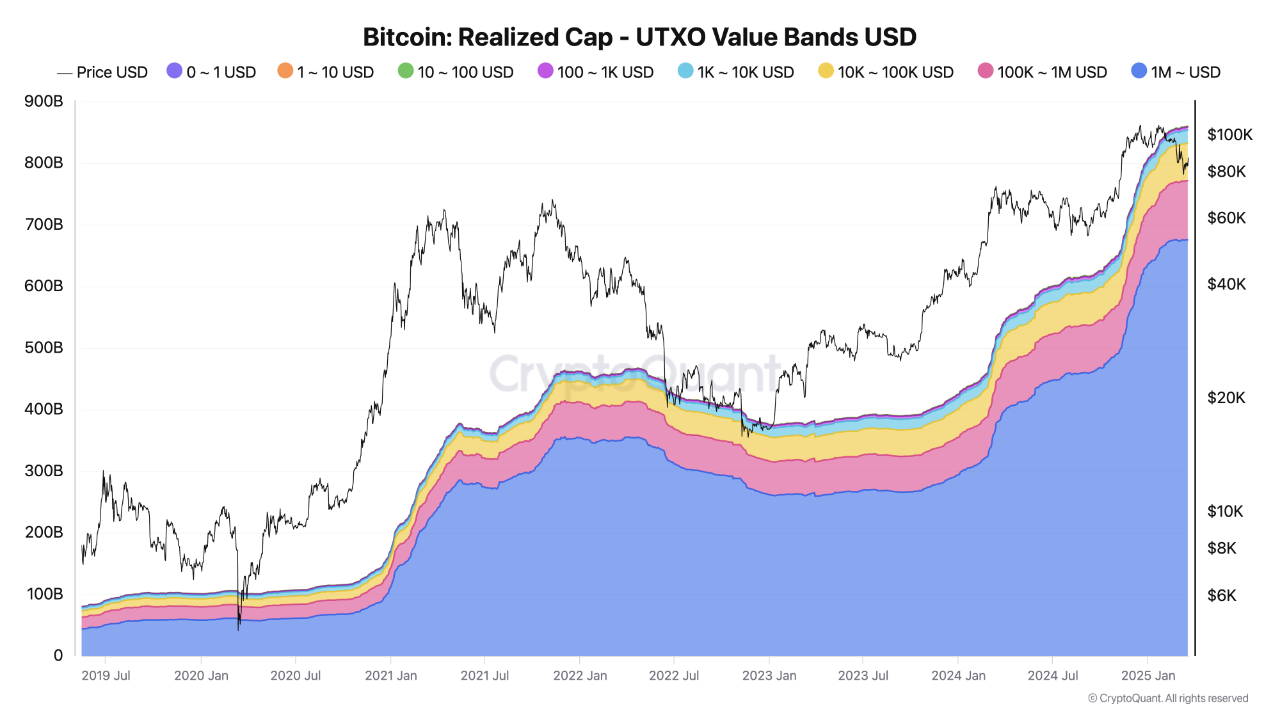
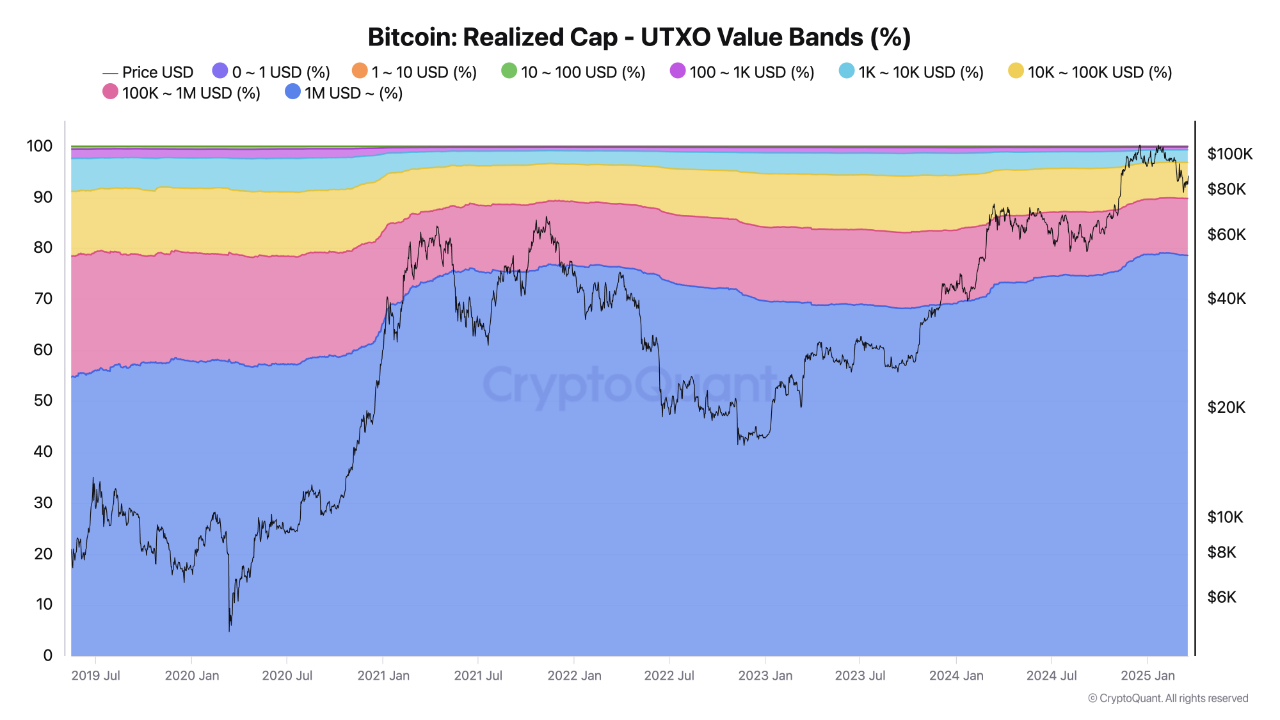
View original →Bitcoin's Realized Capitalization is a metric that represents the value of each Bitcoin at the price when it was last moved or transferred. Unlike the traditional market capitalization, which is calculated by multiplying the current price by the total circulating supply, realized cap uses the value at the time of the last transaction for each Bitcoin.
This metric provides insights into the price at which Bitcoin was last moved, reflecting a more accurate “real-world” valuation, considering the activity and movement of Bitcoin.
Ever wondered how capital moves within Bitcoin’s network? Instead of just watching price action, we can analyze Realized Cap by UTXO Value Bands (in USD) to see how different investor groups are accumulating or distributing Bitcoin.
🧐 What Are UTXO Value Bands (USD)?
Each Bitcoin transaction has a value in USD at the time of transfer. By segmenting transactions into value bands (e.g., $1-$100, $1K-$10K, $1M+), we can track which investor classes are active.
📊 Key Insights From the Chart:
Whale & Institutional Dominance: Currently, UTXOs in the + $1M value band represent a total of $675 billion allocated into Bitcoin, making up 78% of the network’s realized capitalization. This indicates that a significant portion of Bitcoin’s realized value is concentrated in high-value UTXOs, reflecting the substantial influence of large holders on the market’s realized cap.

View original →

