One of the most strongest market predictor metric is the aSOPR.
it was telling us about each time the bear market really endings and also the transition to lower lows.
As Macro-economic status is starting to show some easing ahead the bitcoin price spiked up once again, however will that be inevitable ?
to be sure about the price movement ahead of us we should see a retest to the aSOPR rising trend then to fall down back again and transition to a downtrend so we get our confirmation.

View original →Bullish(Nuanced)BTC
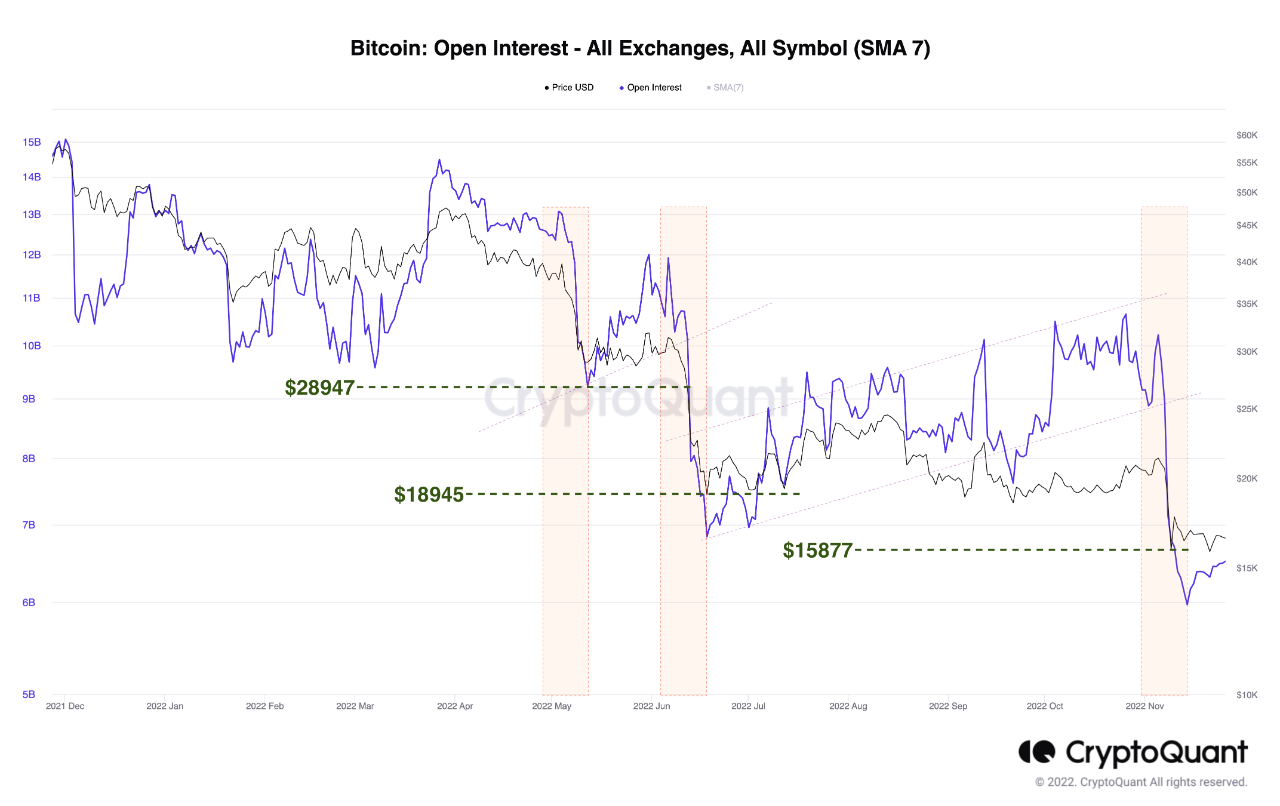
12/3/2022 Current bear market experienced three OI drawbacks where BTC price dropped heavily each time.
whats important to note that 1. each drawback is aligned with local bottoms as shown in the chart. 2. each time, there is consolidation to the uptrend until big thing happens E.g: Luna, FTX collapse.
This is i believe no difference therefore we might face some time of volatility in the same range until we pass the 18k levels again, as feds are easing up and fear is at its proximate, as well as other metrics showing bottom signs.

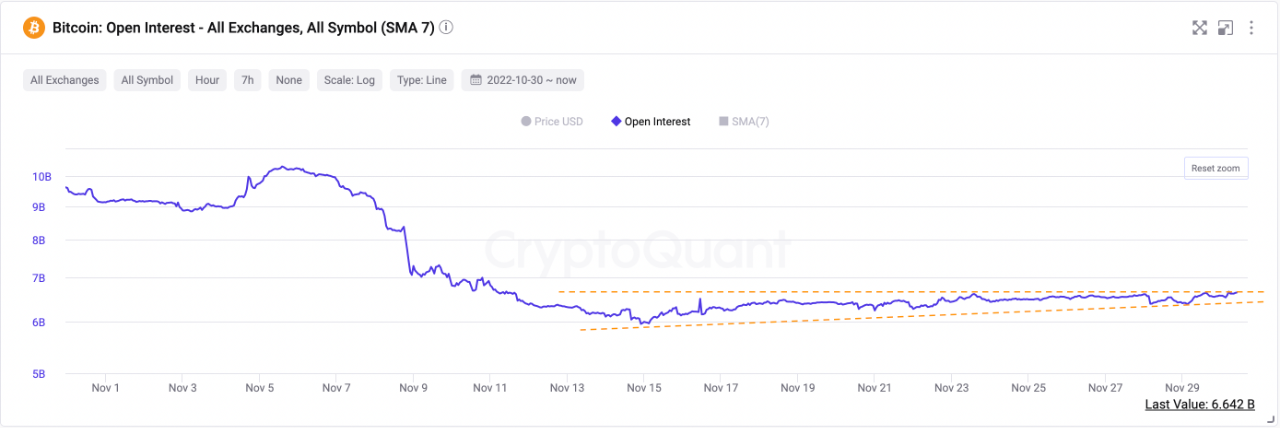
View original →As BTC strikes the 17k again, we see the OI hit its new resistance level for the third time after the last sell off.
Will OI cross that resistance ? or liquidity is not yet supporting this move?
as we approach this level we advice traders to avoid trading until we make sure we cross this resistance or we bounce back to the support level again

View original →Bearish(Nuanced)BTC
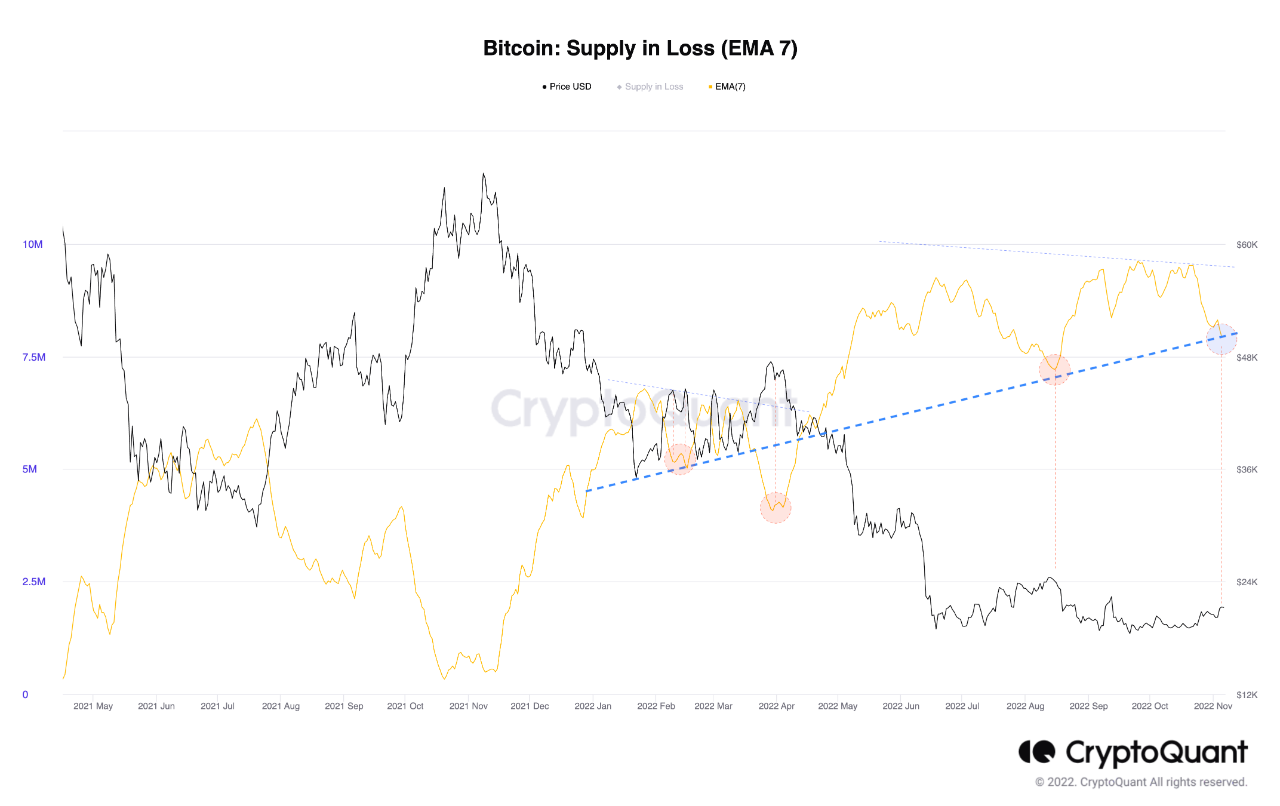
11/6/2022 The chart provided shows that supply in loss is so effective in price corrections, especially in bear markets.
Many suggest that we are out of the danger zone but the macroeconomics status is not yet reassuring and in addition to that, bitcoin investors pain is not yet met as in the previous bear cycles.
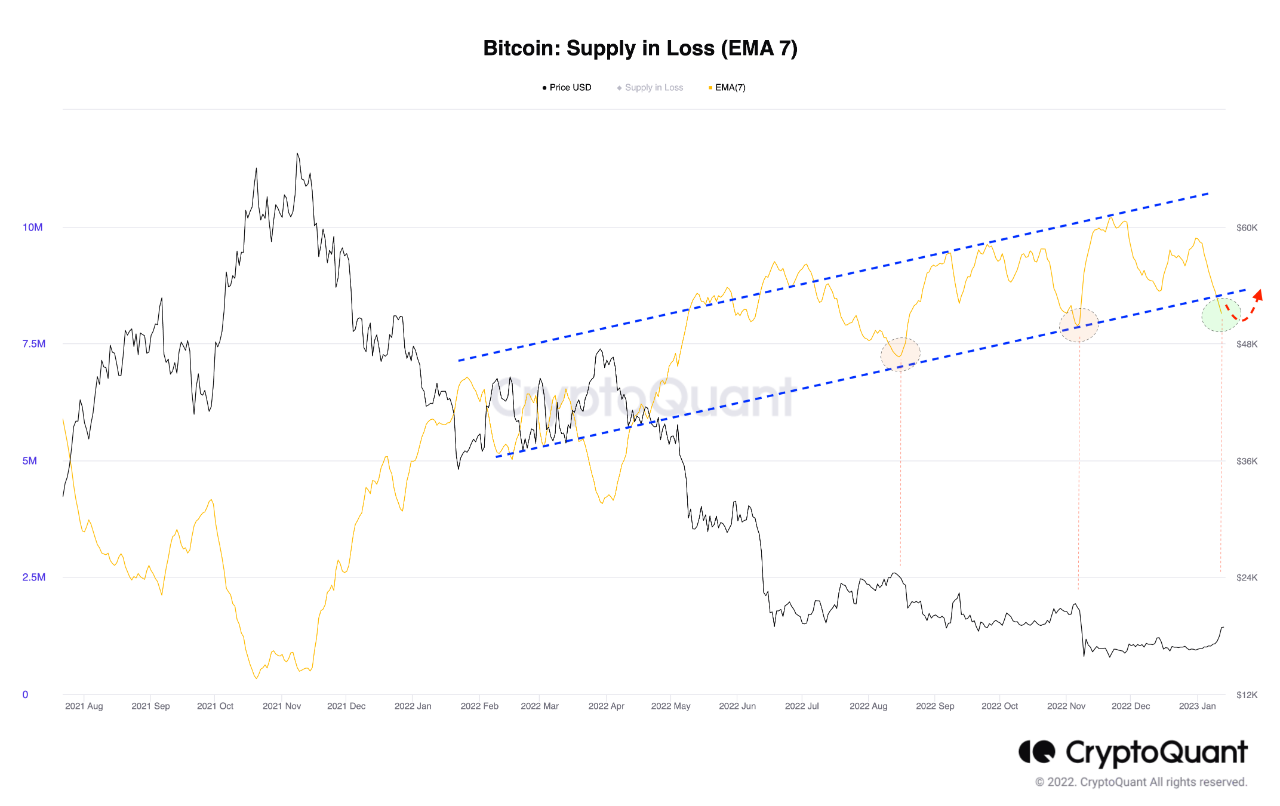
which bring us to the chart here; where we are currently at the base of the trending line of the supply in loss. and the question here are we bouncing back to more pain? or we are going to move ahead to bull run state?

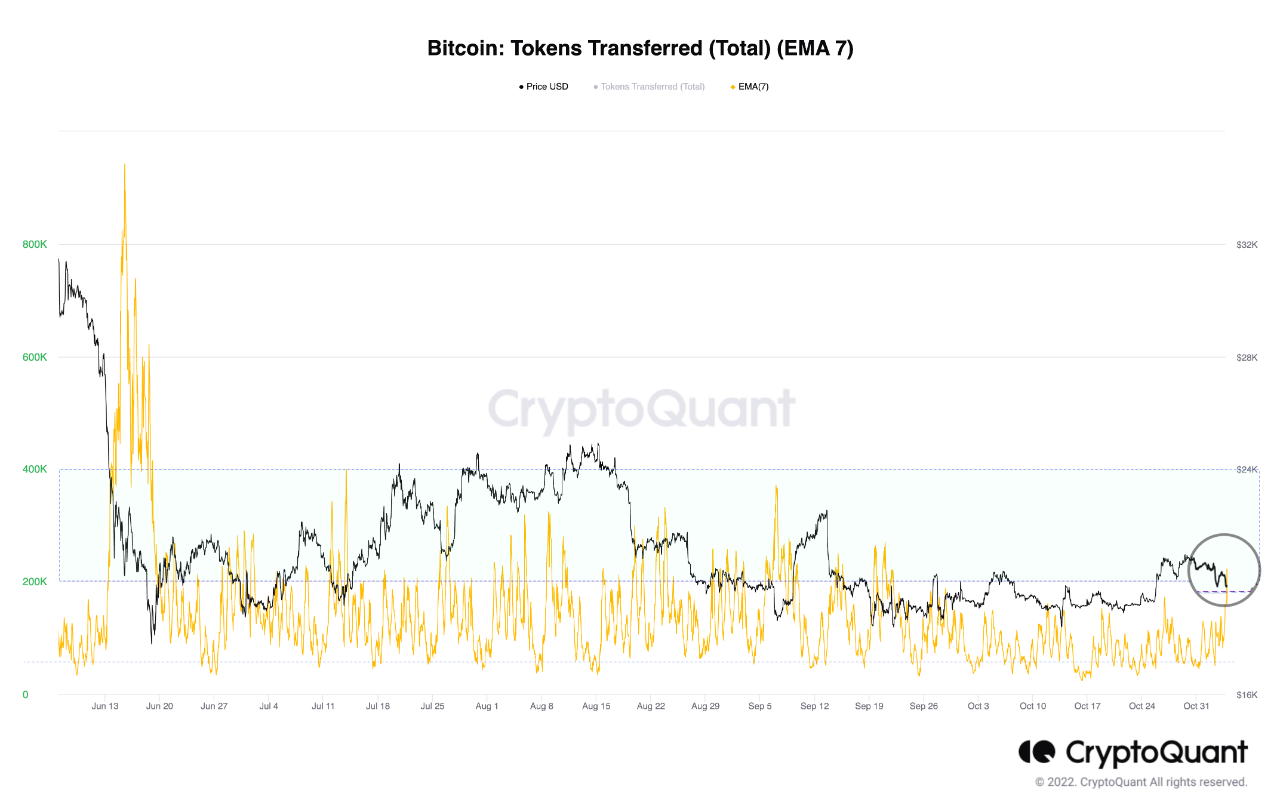
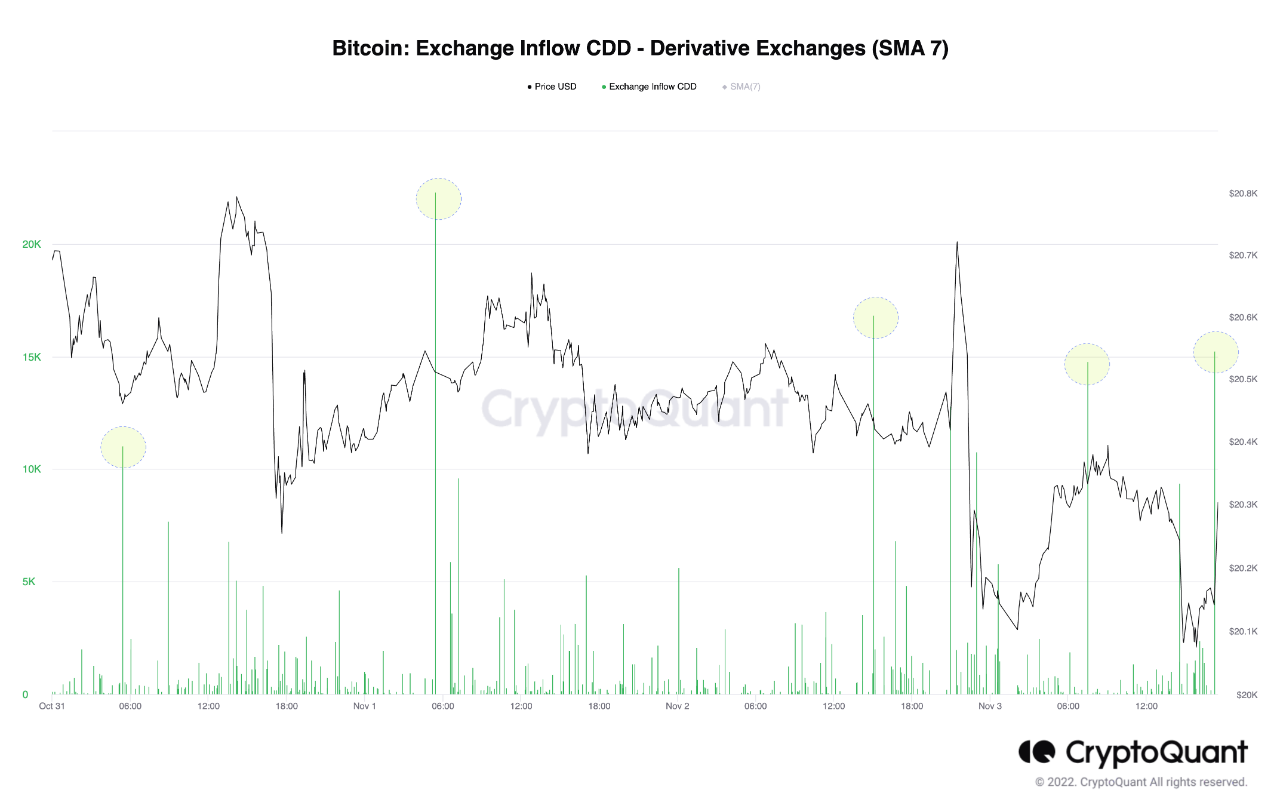
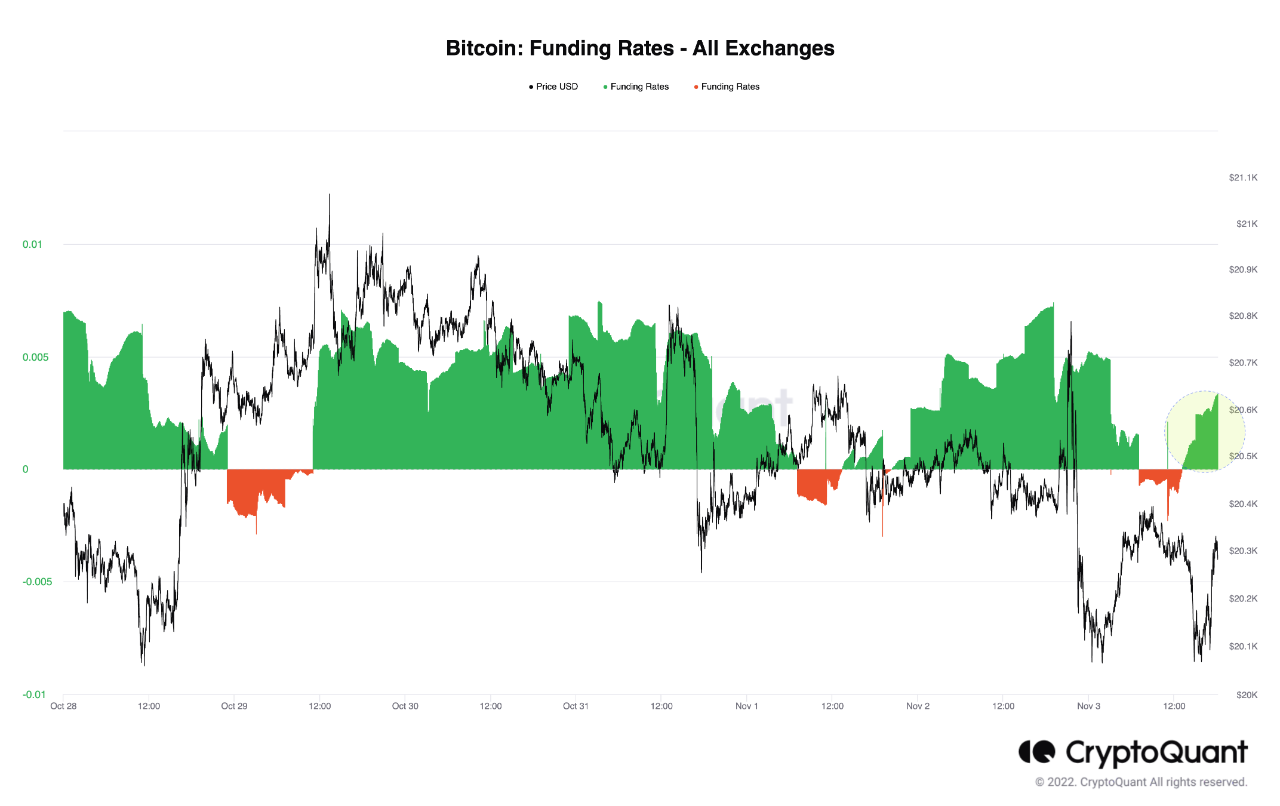
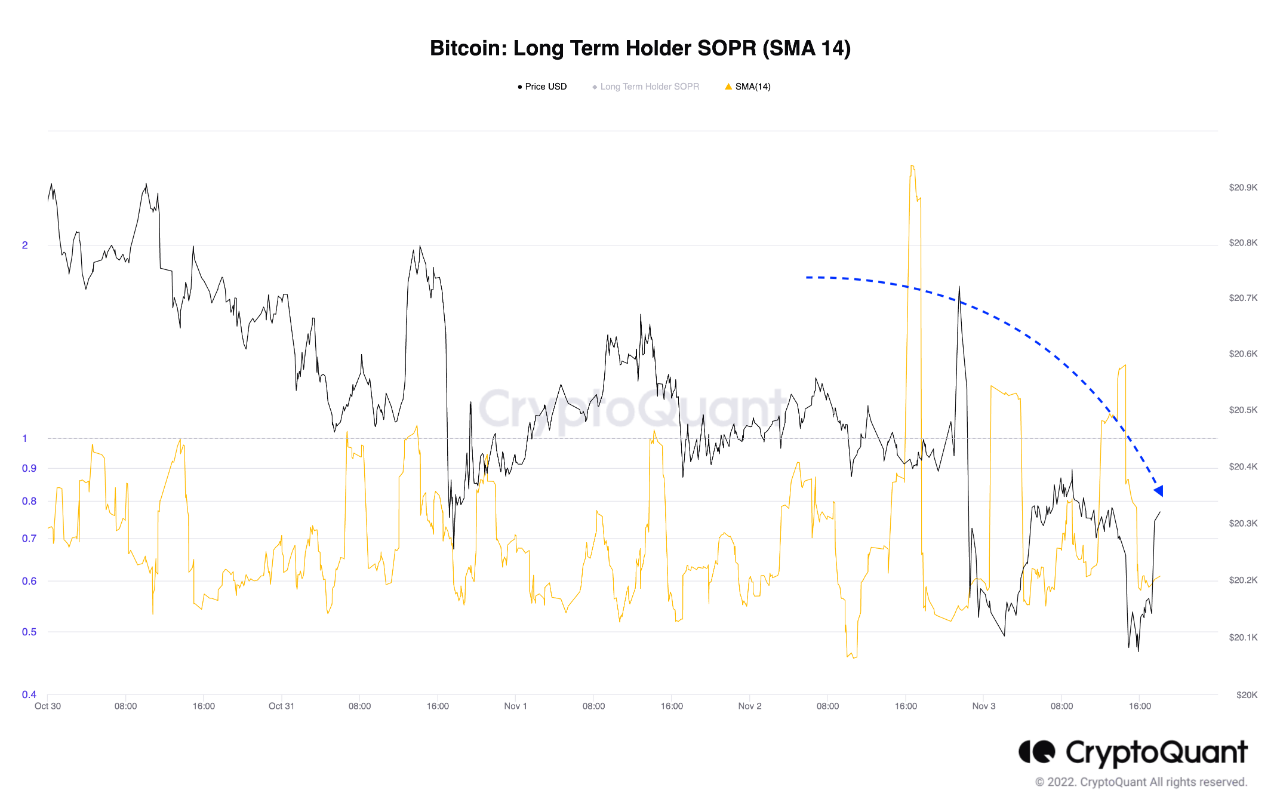
View original →As price trend down post FOMC meeting, Token transaction count is showing that bitcoin is in process of changing from hand to other hand, so in looking to the accumulation trend it suggest that this change is from weak hands to strong hands as the long term SOPR back to the low levels again this moment. In addition to the derivatives CDD inflow is spiking again towards long position which supports short term increase in price.
So in conclusion, Long term price rise is supported in one side by transaction counts and Long term supply movement and the short term movement is supported by the Long position sentiments.

View original →Bearish10/29/2022
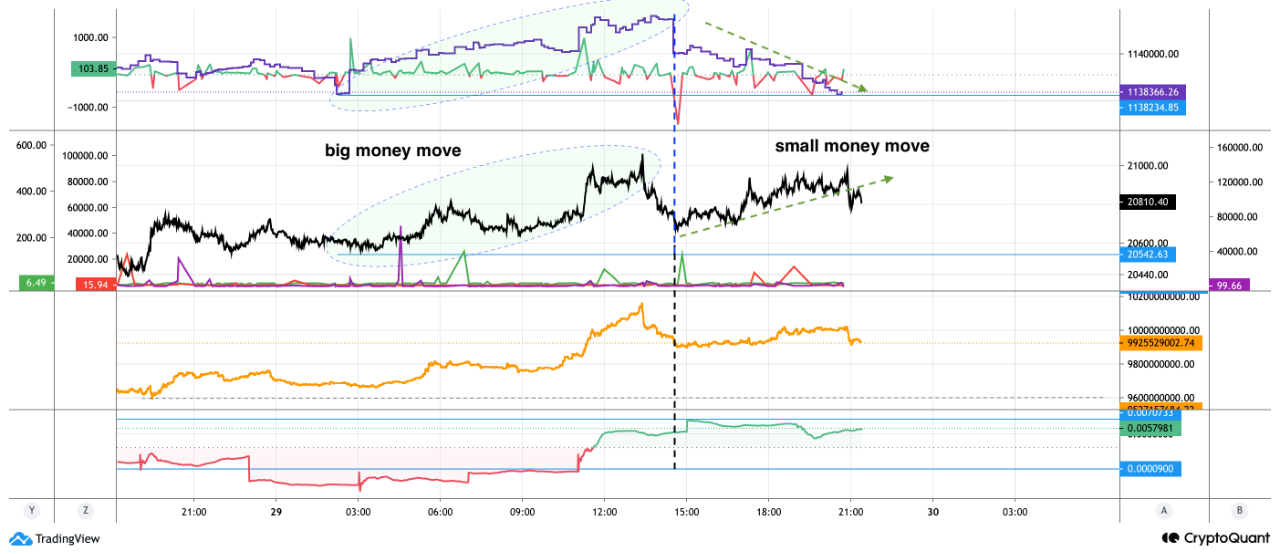
As it is shown in the picture that the current price action is driven by small money cohort rather than large investors and institutions.
where from this point it is more likely we see correction of price ahead.

View original →the taker buy/sell ratio is showing that there is more space for getting higher in price than our current level. as it is showing that the current level is a local bottom.
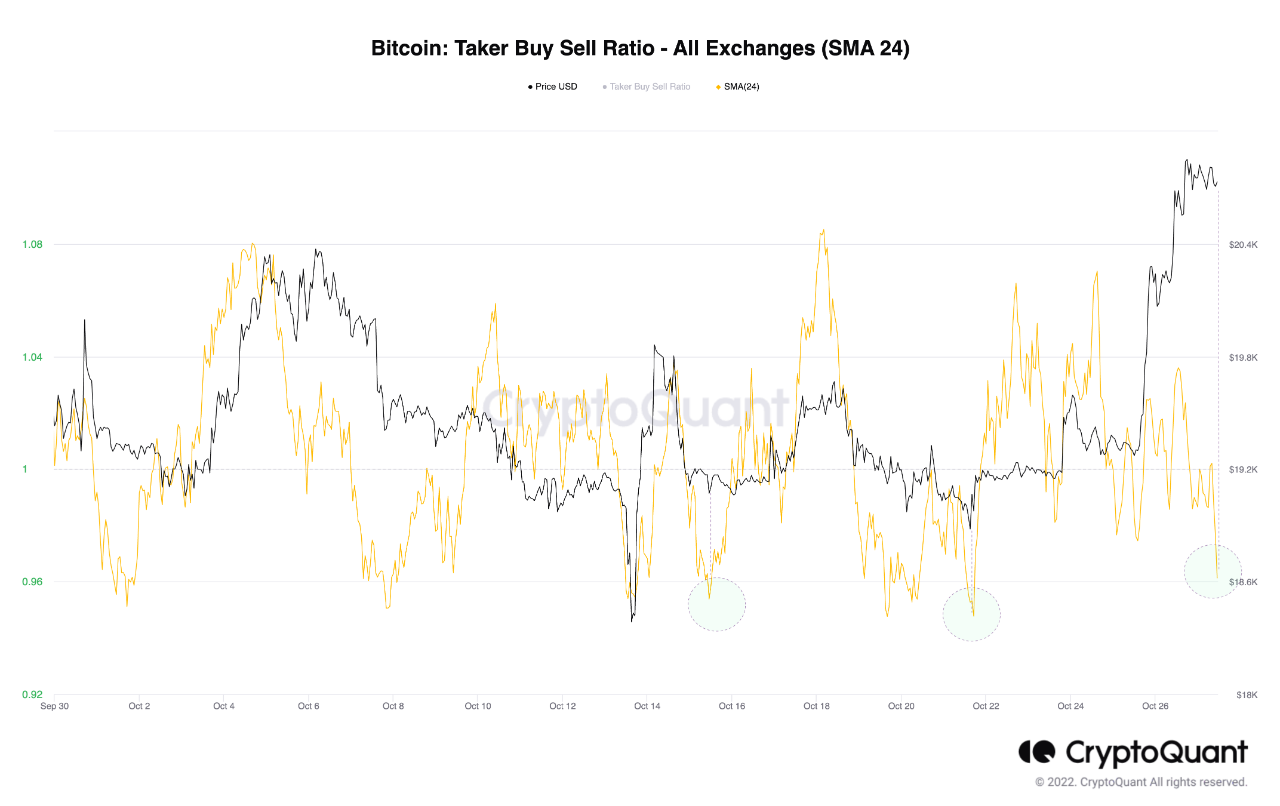

View original →the taker buy/sell ratio is showing that there is more space for getting higher in price than our current level. as it is showing that the current level is a local bottom.


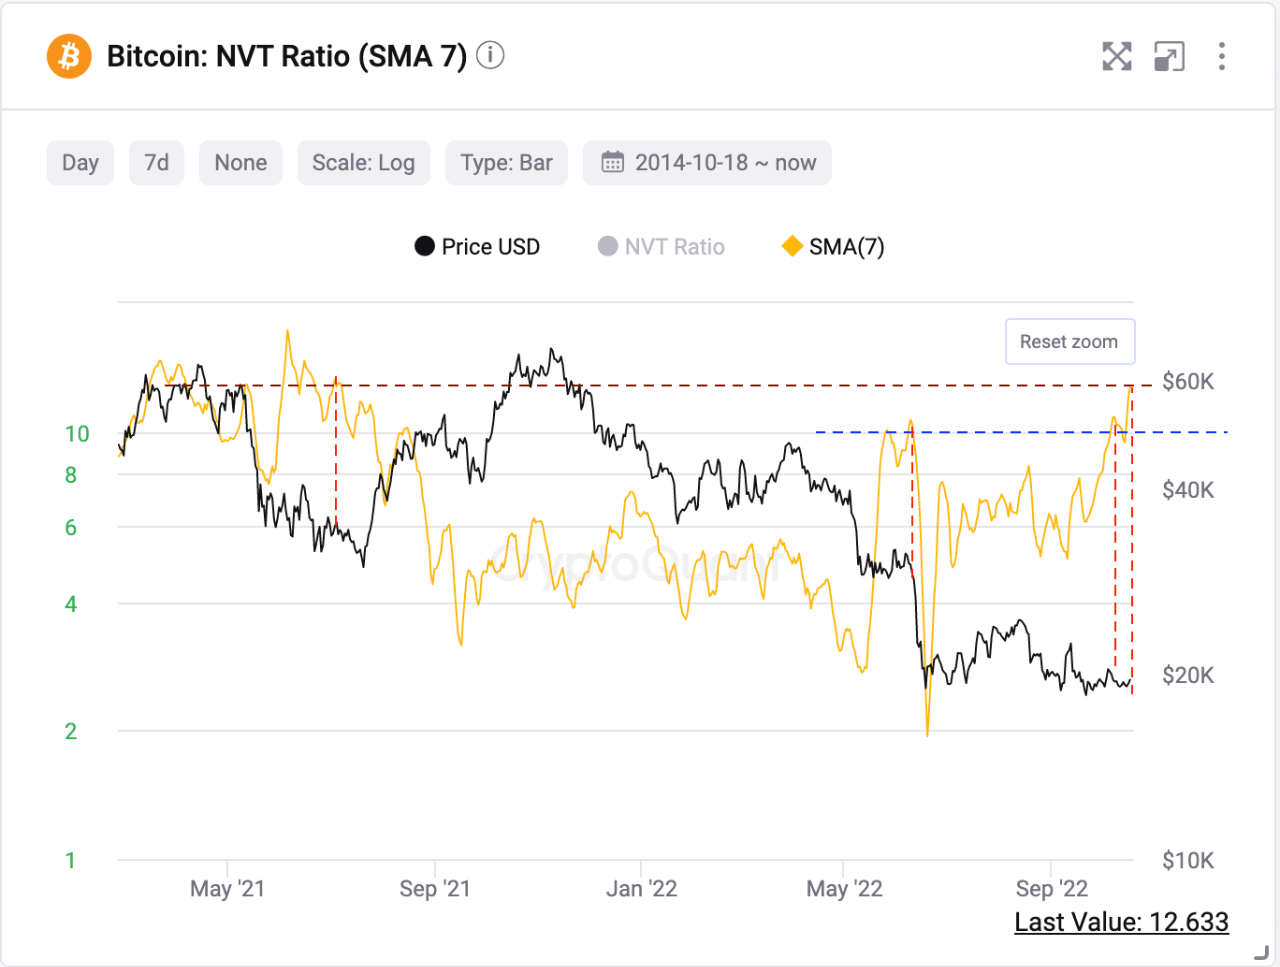
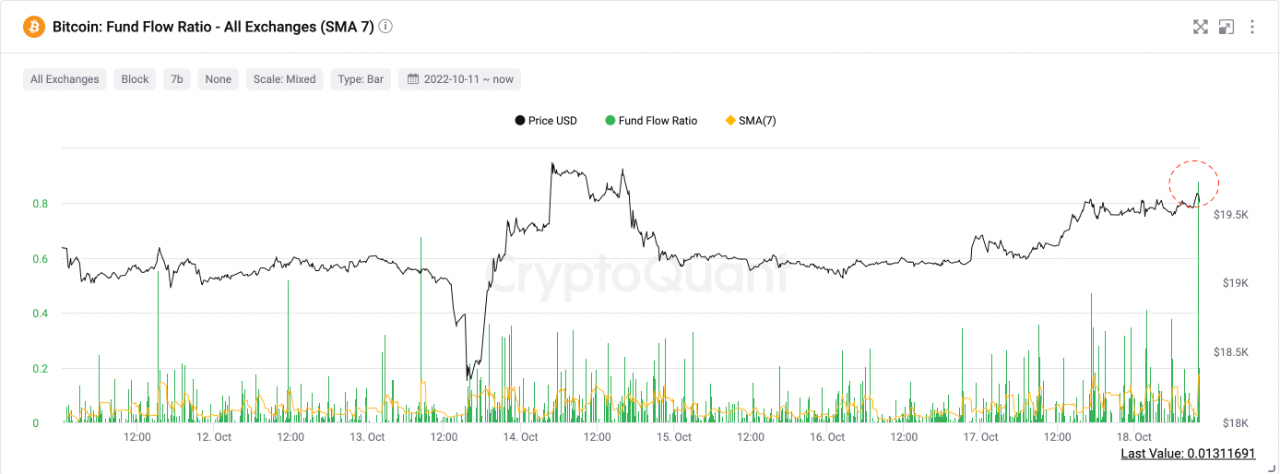
View original →As fund flow Ratio spikes again while the price topping it usually mean that there is change in price direction.
and that is supported by high NVT levels.

View original →Bullish(Nuanced)BTC
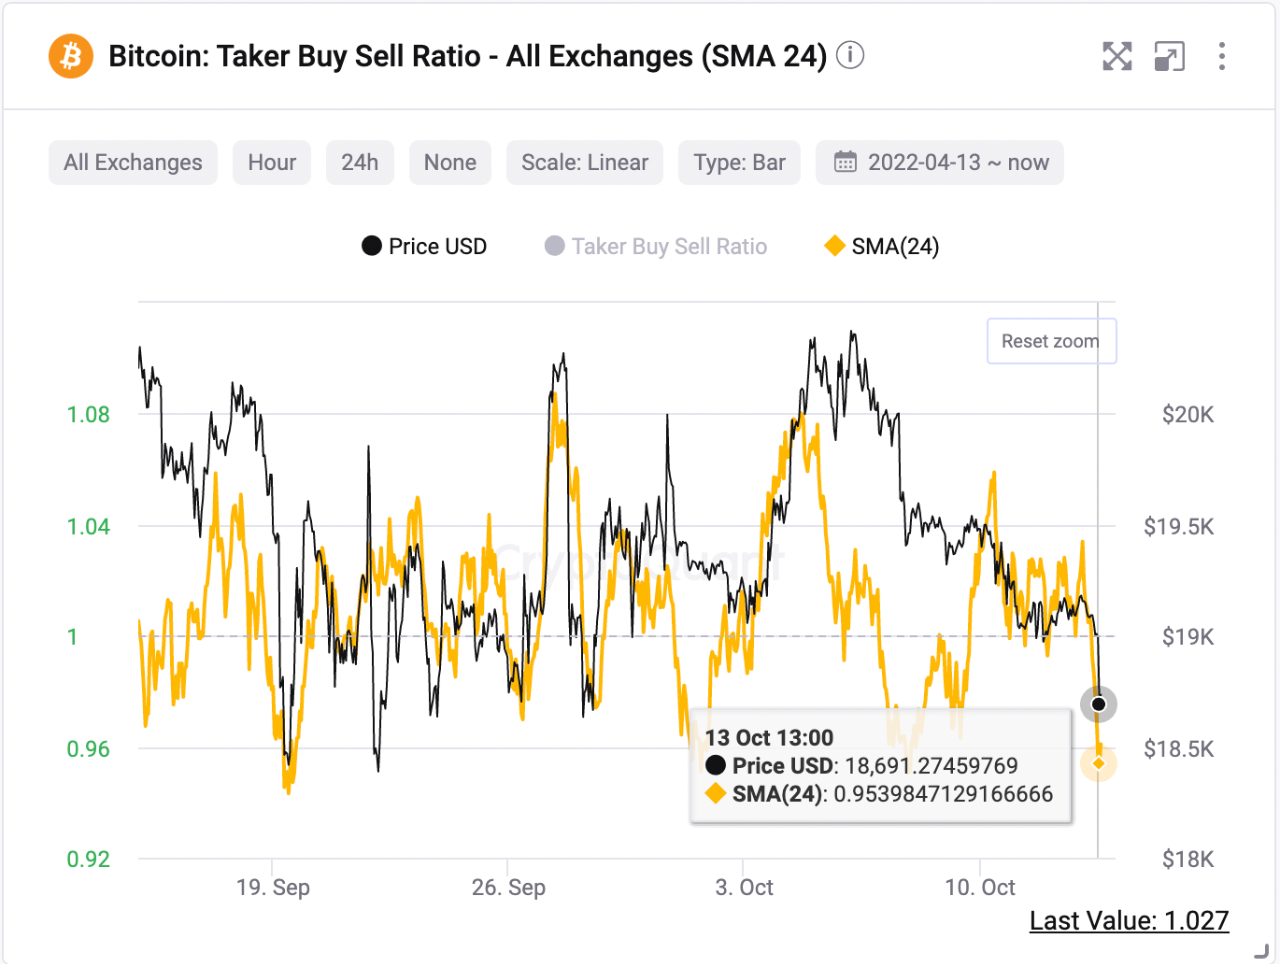
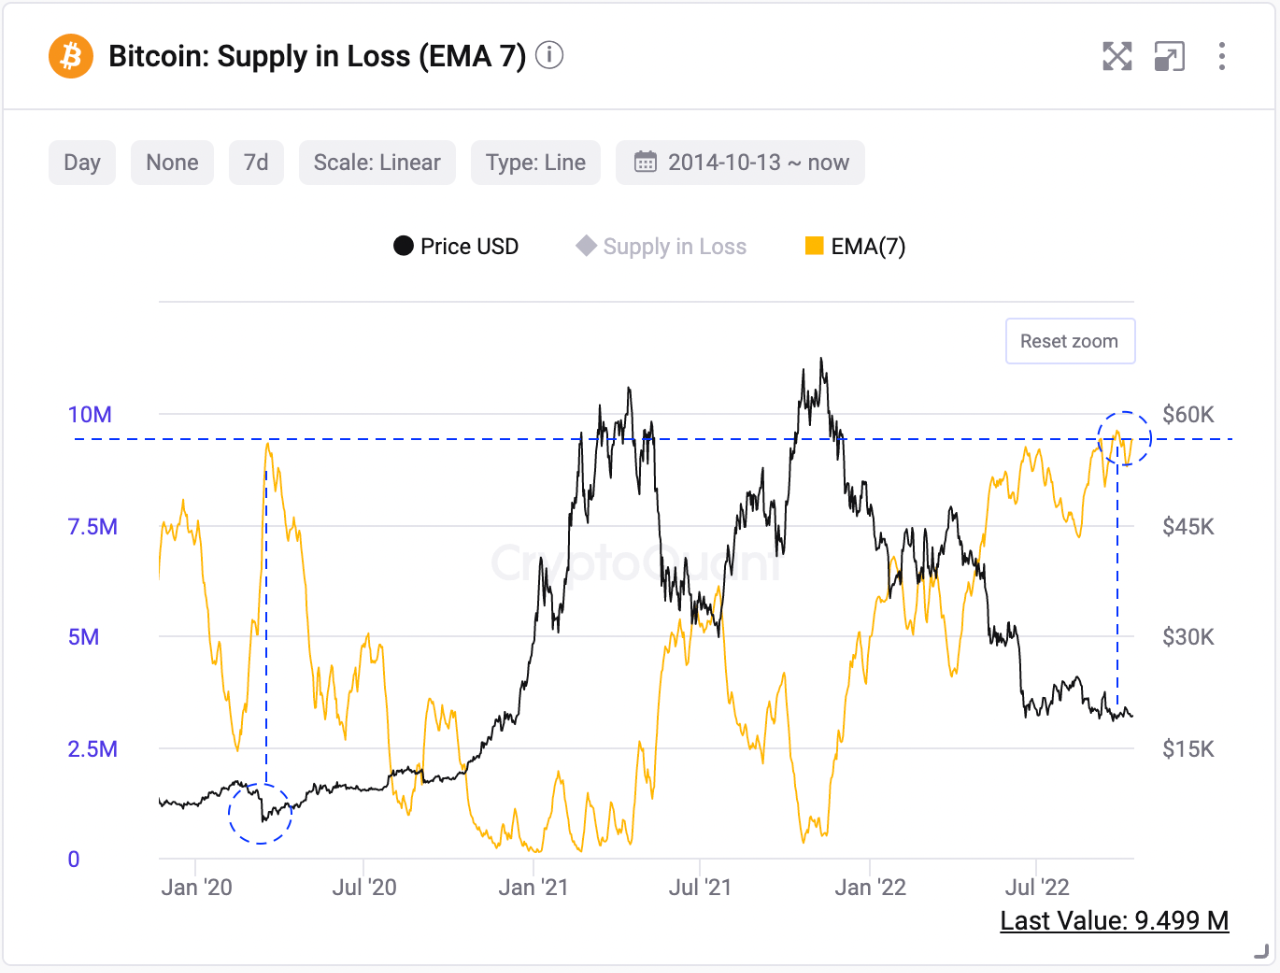
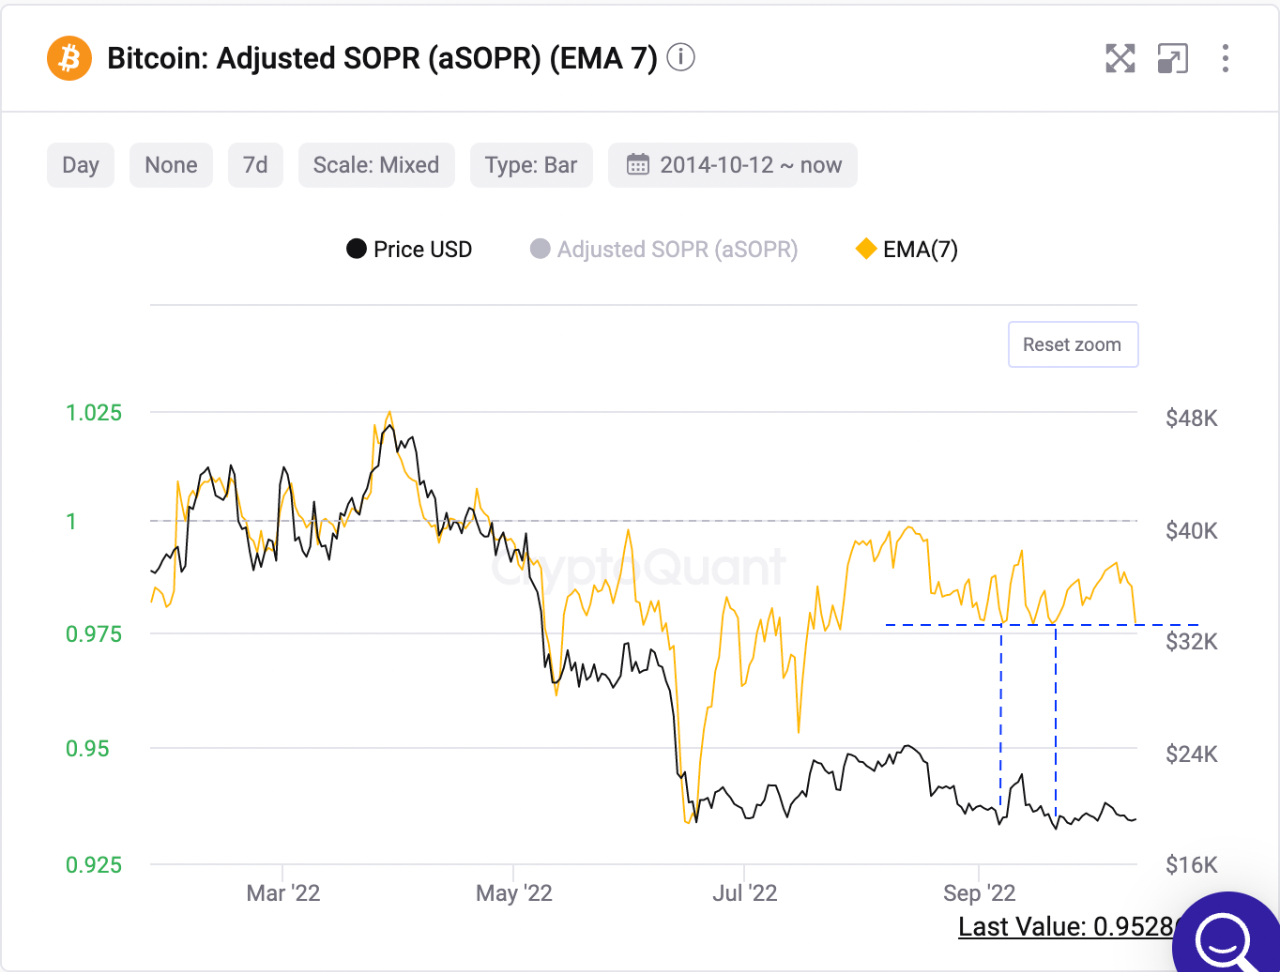
10/13/2022 The:
- taker/Buyer sell ratio
- supply in loss
- Adjusted SOPR
All are suggesting that it is time to take long position. As it all shows that the selling pressure is at highest levels now.
what we are missing is the derivatives side to support this theory so we must pay attention to the OI and derivatives reserve and netflow.

View original →

