Neutral7/14/2022
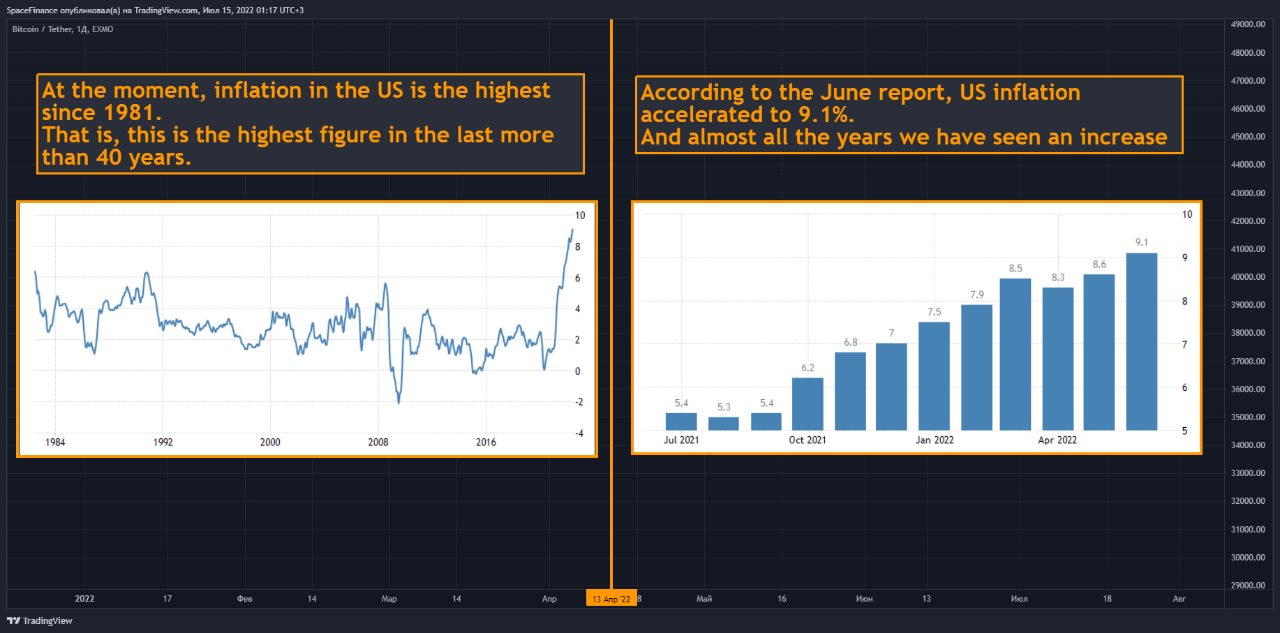
1. The annual inflation rate in the US accelerated to 9.1% in June of 2022, the highest since November of 1981, from 8.6% in May and above market forecasts of 8.8%.
Energy prices rose 41.6%, the most since April 1980, boosted by gasoline (59.9%, the largest increase since March 1980), fuel oil (98.5%), electricity (13.7%, the largest increase since April 2006), and natural gas. Food costs surged 10.4%. Prices also increased significantly for shelter (5.6%, the most since February 1991), new vehicles (11.4%), used cars and trucks (1.7%), and airline fares (34.1%).
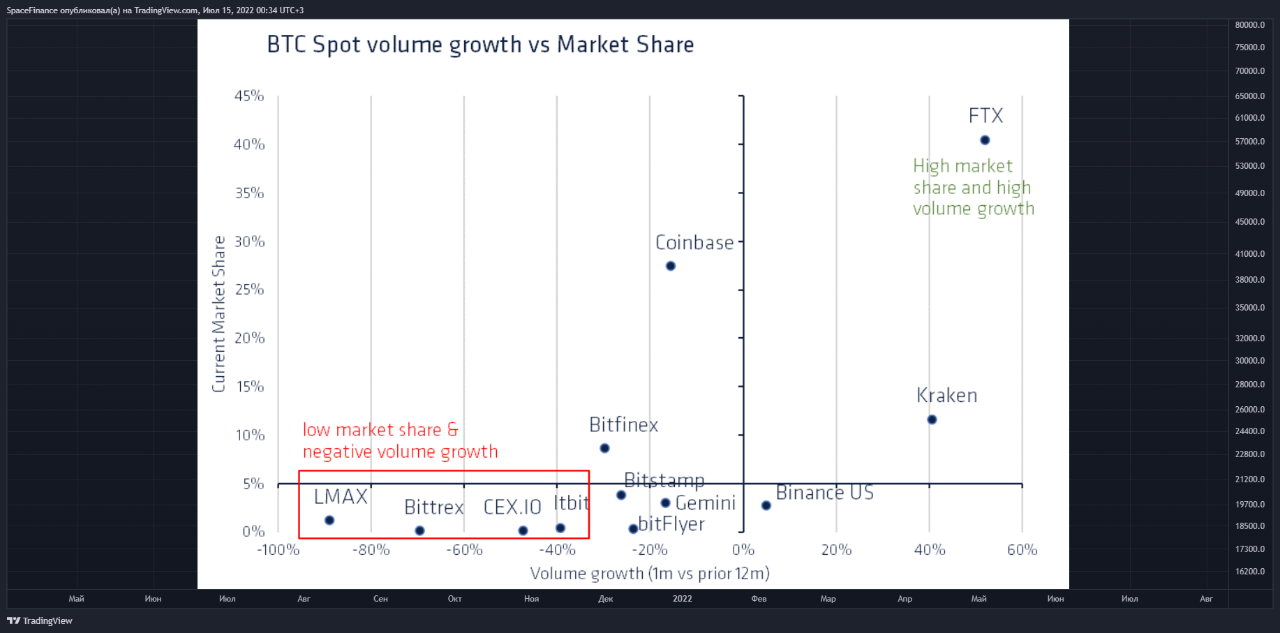
2. Very few exchanges have seen volume growth recently, of the top 12 only FTX, Kraken and Binance have rising Bitcoin spot volumes according to Kaiko data.
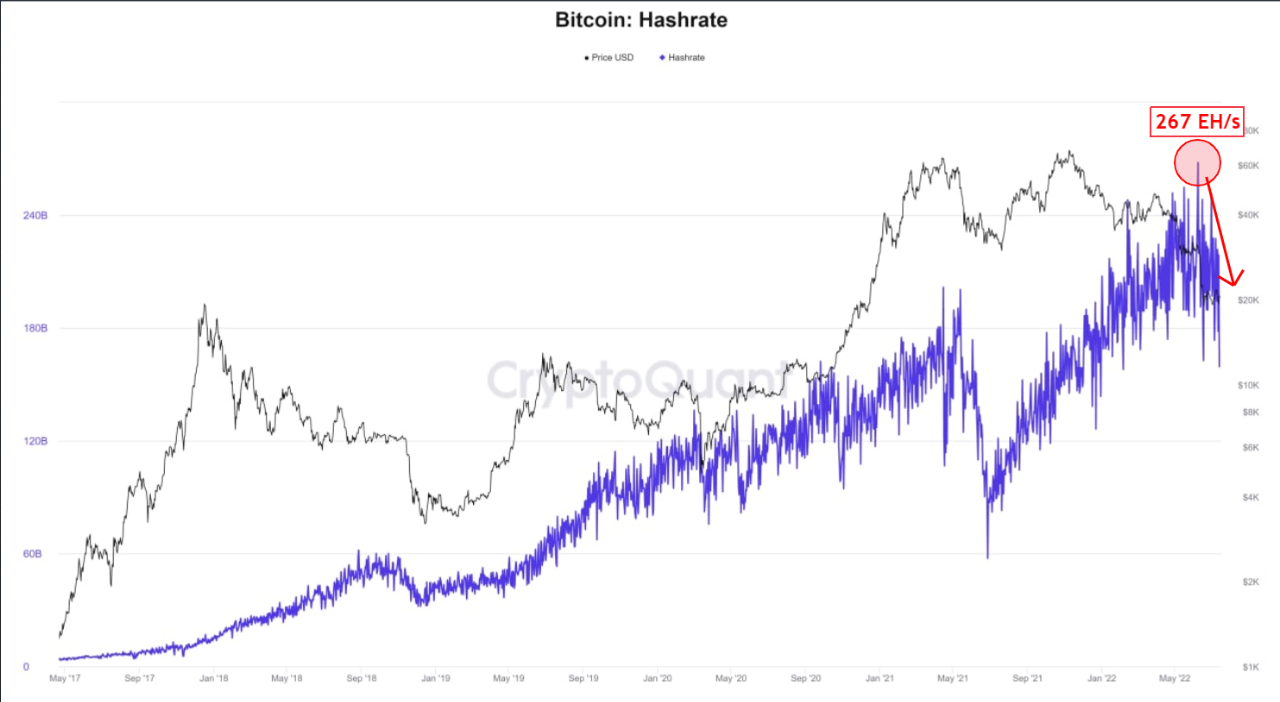
3. Another sector demonstrating the early signs of stress is the mining sector. Bitcoin hash power peaked in June 2022 at 267 EH/s, having now fallen by 40% to 159 EH/s highlighting that in this weak price environment some miners are beginning to turn off their rigs

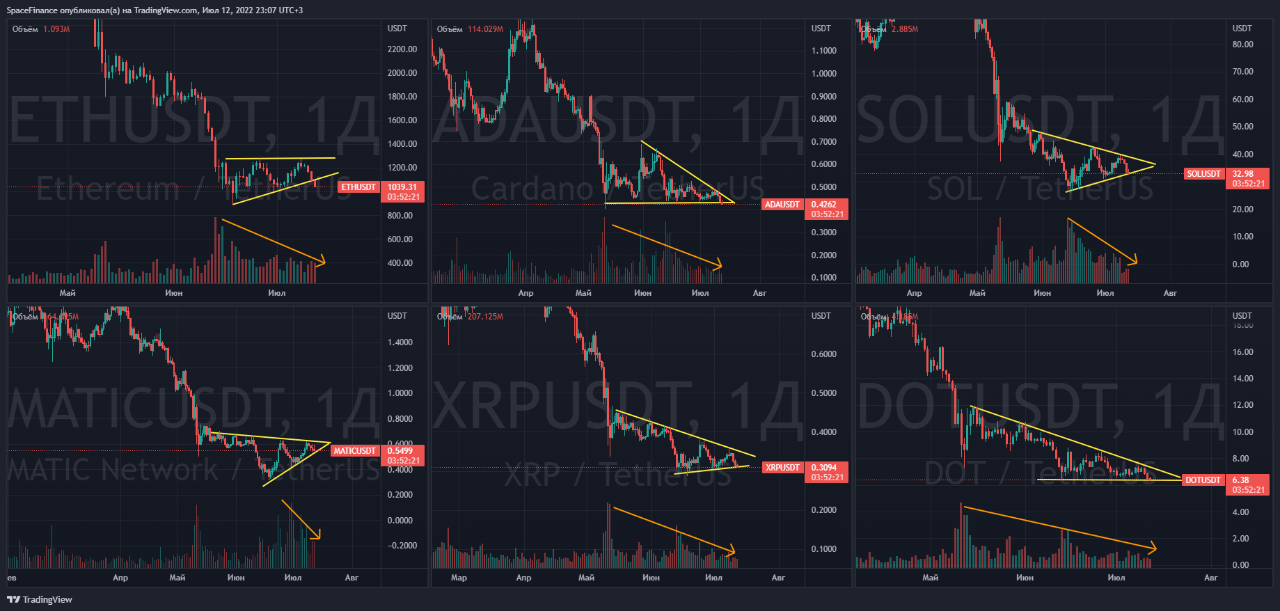
View original →Look what interesting triangles are on almost all altcoins
Almost everywhere we see that prices are clamped in a range that is constantly narrowing. At the same time, there is a decrease in volumes, which, according to the canon, is the result of the price being squeezed into the range.
What will happen next?
Most likely, we will see impulse breakouts further, with an increase in volatility and a surge in volumes.
For the last 4 days, Bitcoin has been declining (-12%), but in a rather sluggish, slow manner. But as soon as we see a more obvious movement in Bitcoin, there will be a good momentum in altcoins immediately. They are ready.)
Trade carefully)

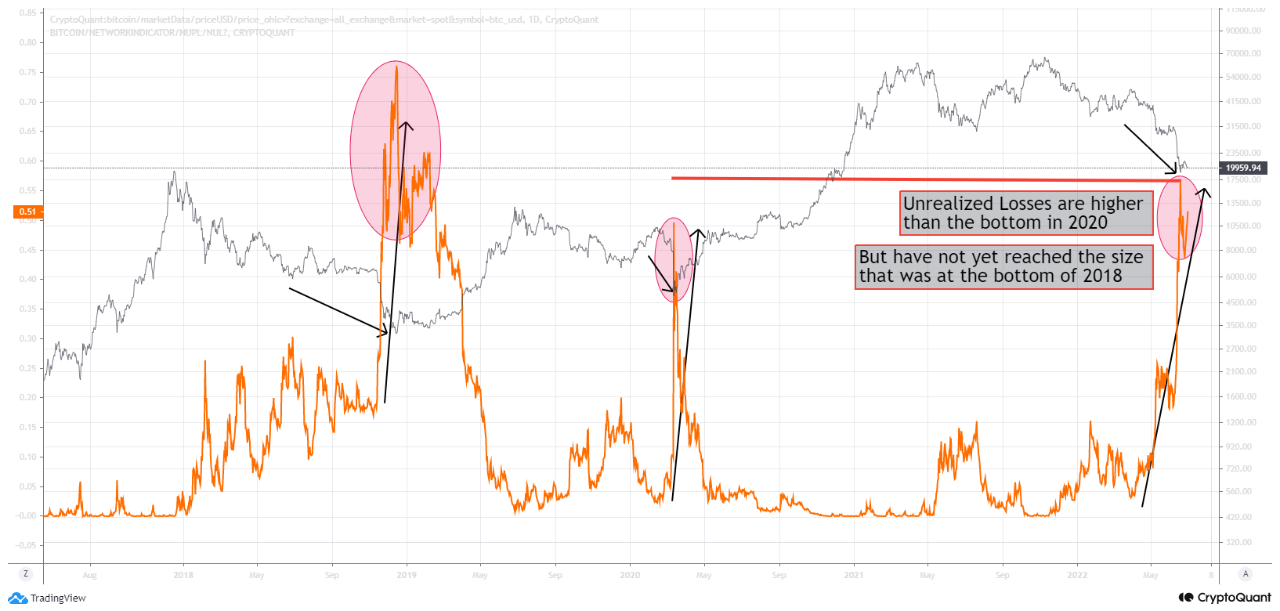
View original →Unrealized losses reached a very large value. We see that more and more investors are losing money and holding losing positions. The amount of unrealized losses is already larger than it was during the 2020 bottom, but still less than it was during the 2018 bottom.
When the size of unrealized losses rises, this is a sure sign that the bottom of a bearish cycle is coming.
Therefore, we can now say with confidence that the price of bitcoin has approached its bottom.

View original →Pic#1
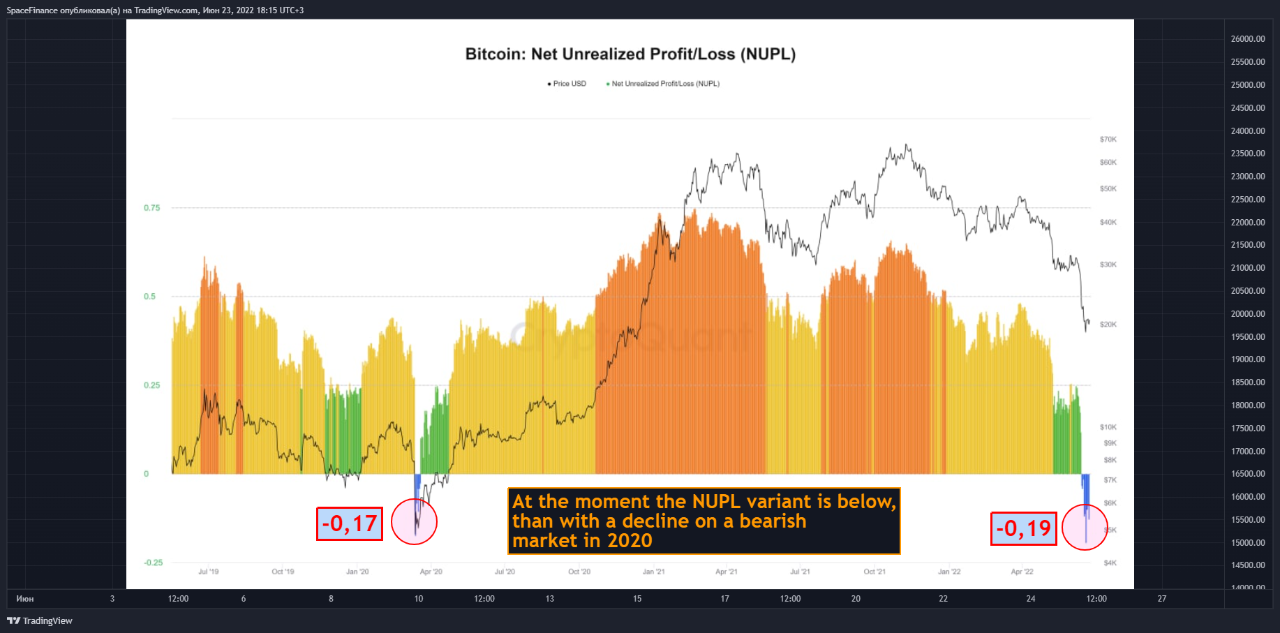
If we compare the NUPL (Net Unrealized Profit/Loss) indicator, we will see a very interesting picture.
At the time of the capitulation, at the bottom of the bear market in 2020, the NUPL was -0.17, but now it is even lower. At the moment, on the decline to $17.605, the NUPL was -0.19. That is, the unrealized loss rate has already surpassed the bottom of 2020
Pic#2
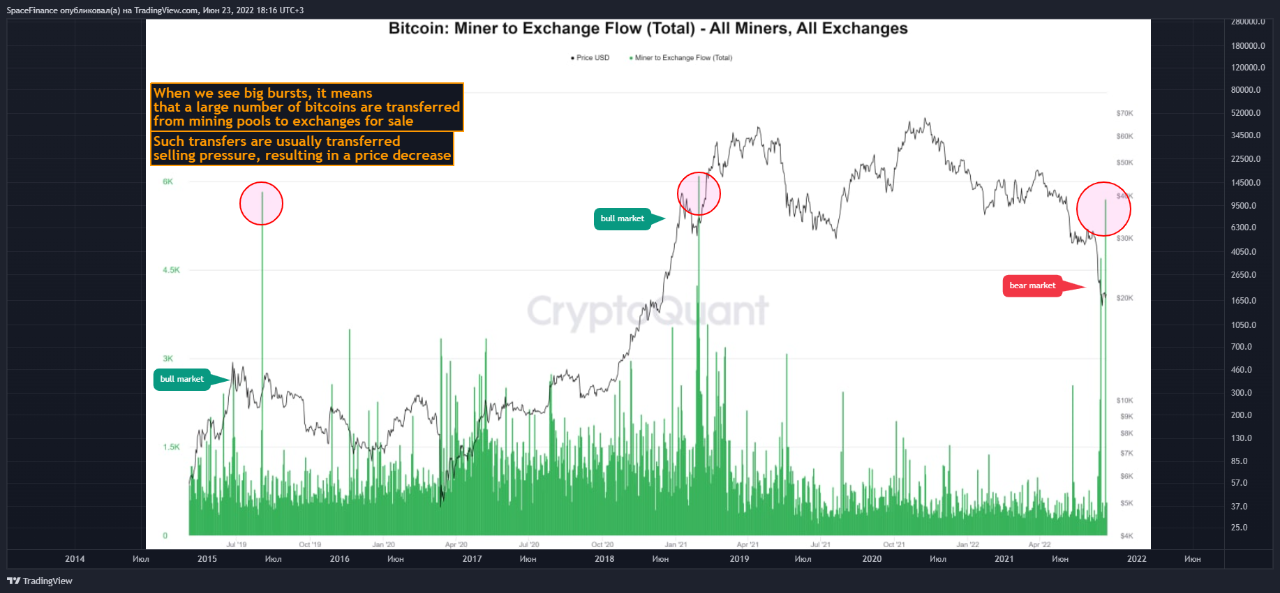
Let's look at a metric that shows the total number of coins transferred from the mining pool to exchange wallets.
When we see big spikes, it means that a large amount of bitcoin is transferred from mining pools to exchanges for sale. When this is done in bear markets, it means that the miners are not keeping up with the amount of expenses they are supposed to cover. For this, part of the bitcoins is sold
Pic#3
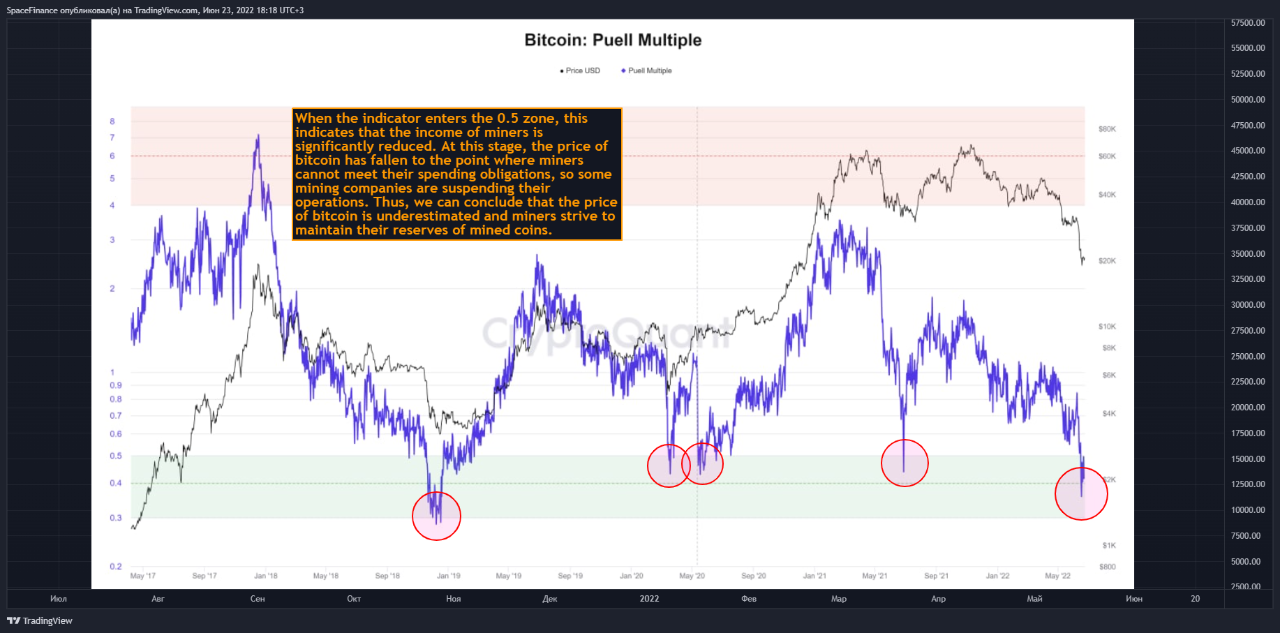
Puell Multiple can be interpreted as "If all mined bitcoins were sold immediately in the market, how profitable mining pools are compared to last historical one year?". Shows the income of miners at the moment

View original →Pic#1
Long-term holders suffer very serious losses. The last time such losses for this group was in 2019
Pic#2
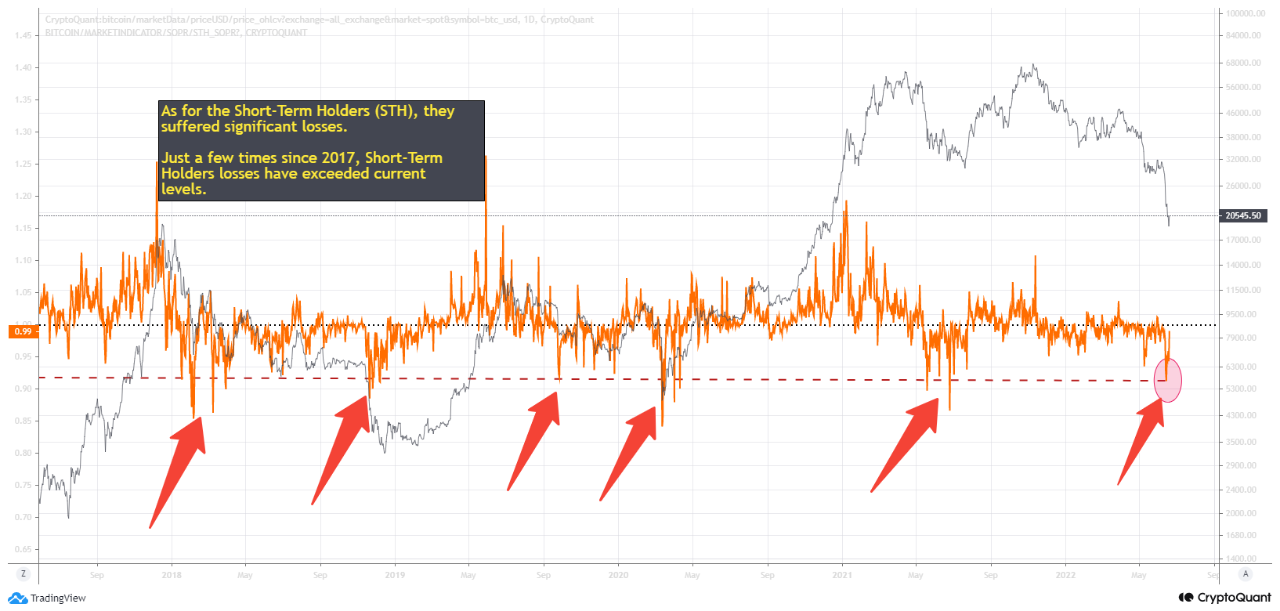
As for the Short-Term Holders (STH), they suffered significant losses.
Just a few times since 2017, short-term investors' losses have exceeded current levels.
Pic#3
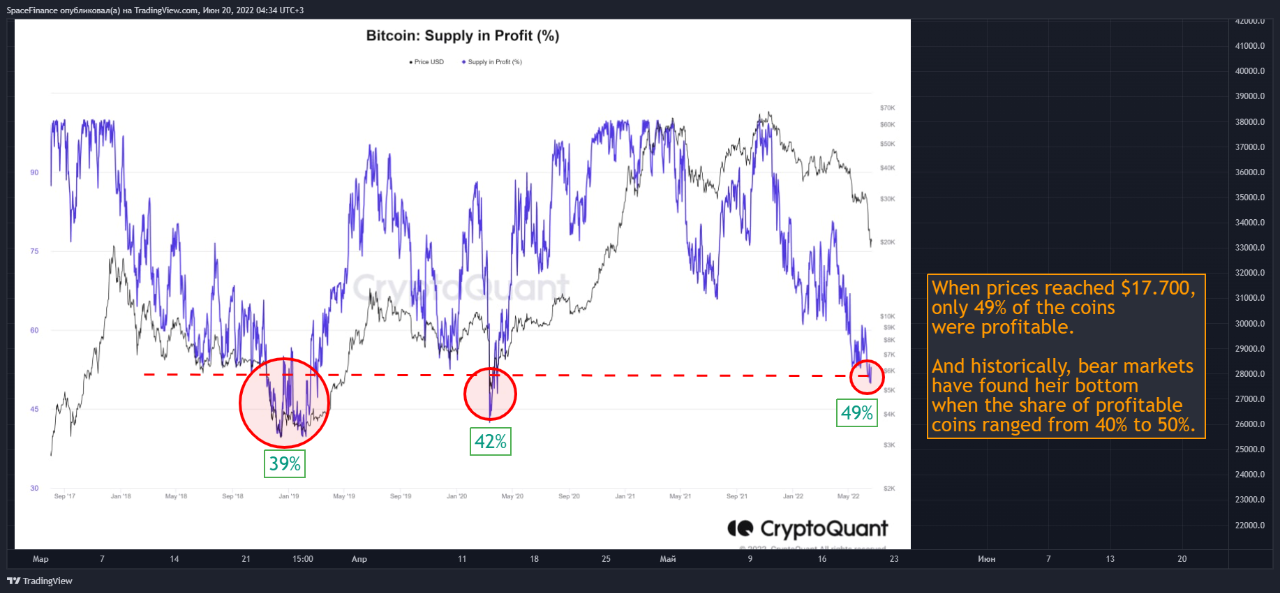
When prices reached $17,700, only 49% of the coins were profitable.
And historically, bear markets have found their bottom when the share of profitable coins ranged from 40% to 50%.
Pic#4
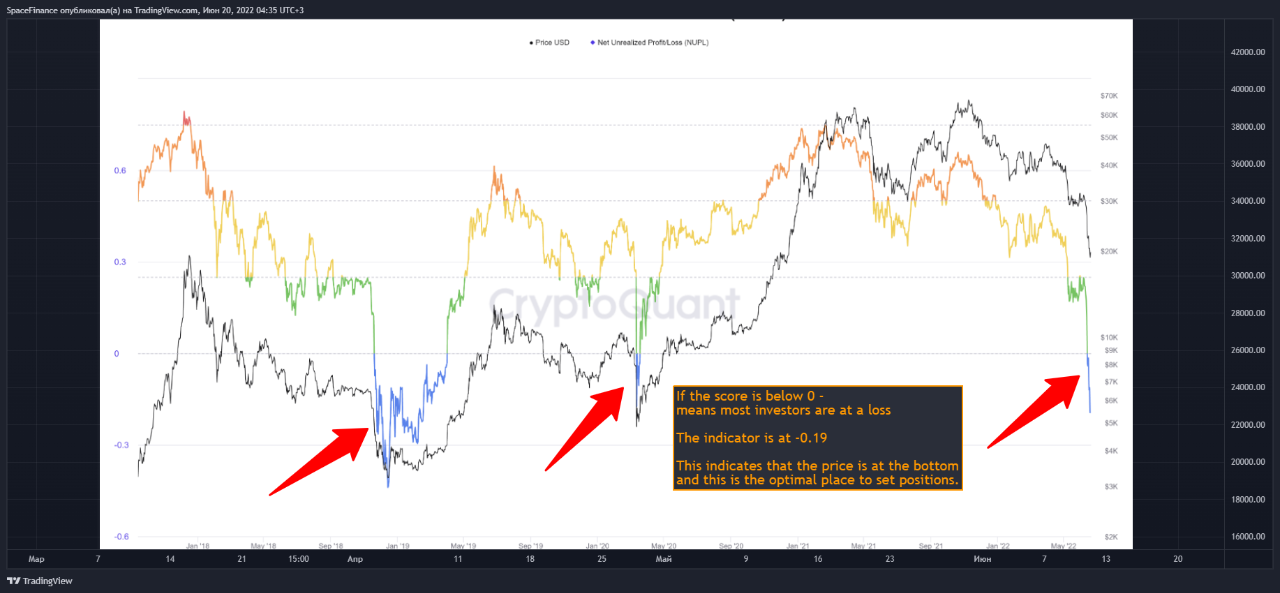
If the score is below 0 - means most investors are at a loss
The indicator is at -0.19
This indicates that the price is at the bottom and this is the optimal place to set positions.


View original →Bearish(Nuanced)BTC
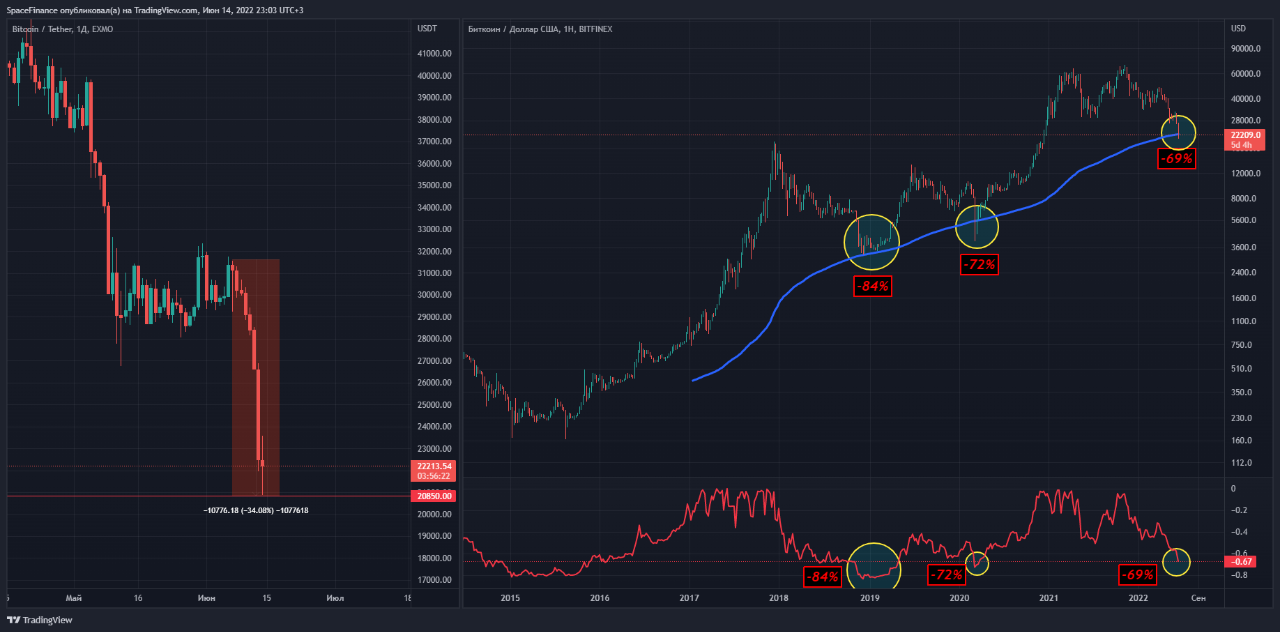
6/16/2022 Picture #1 shows how low the price went down from ATH
Past lows were -72% and -84%. Now the price has fallen by only -69%. From this we can conclude that the price is almost at the very bottom. But there may still be one trip down, where there will be a capitulation of all investors
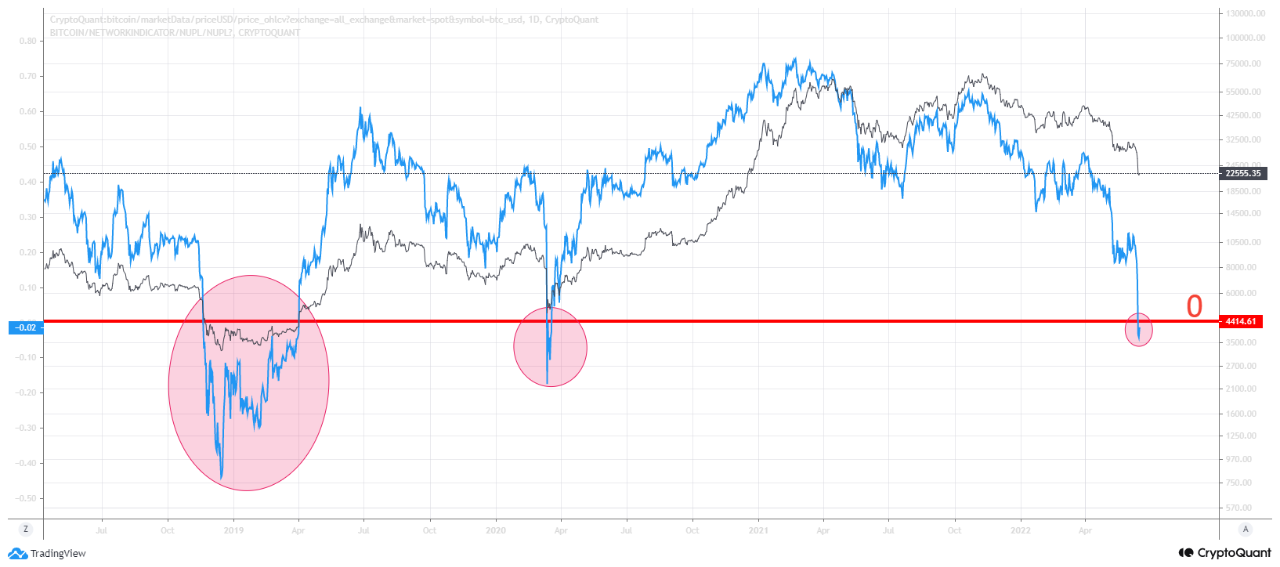
Picture #2. NUPL
For the first time since 2020, the indicator crossed the 0 mark.
And let me remind you, if the indicator is below 0, it means that there are fewer investors who make a profit than investors who suffer losses.
Now there are more investors who are at a loss in the market
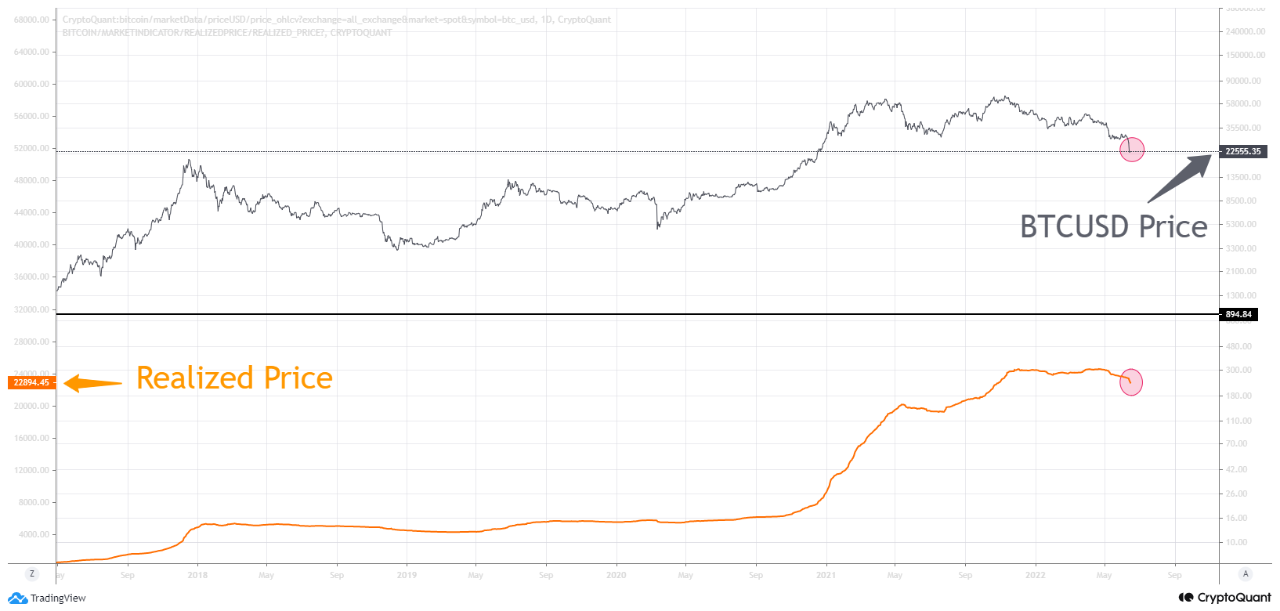
Picture #3. Realized Price
The Realized Price is the average value of all coins purchased
The Realized Price is currently at $22.894, which is more than what Bitcoin is currently worth. Historically, this is one of the last stages of decline.

View original →

