In the past 2 days, Bitcoin has surged back above $60k. Here are the key factors behind this move.
### Inflation Data
On Friday, U.S. CPI inflation data came in at 3.0% year-over-year, slightly below the expected 3.1%. This lower-than-expected inflation figure has bolstered investor sentiment and triggered a risk-on environment, benefiting the crypto market.
### ETF Inflows
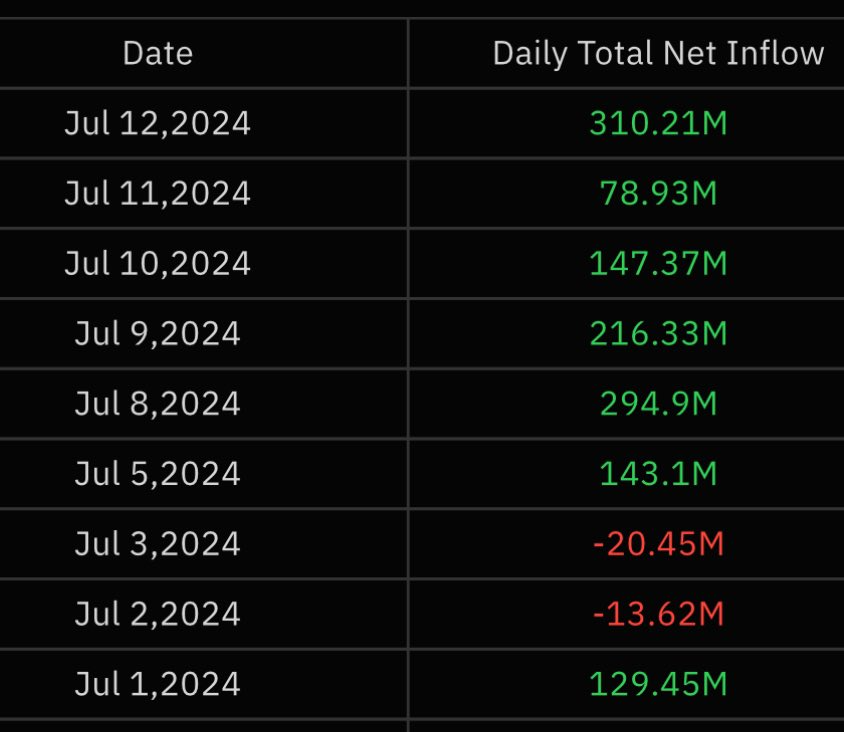
ETF inflows highlight growing investor optimism about a soft landing. Approximately $310 million in net inflows were recorded on Friday, contributing to a total of $1.04 billion for the week.
### German Government BTC Distribution
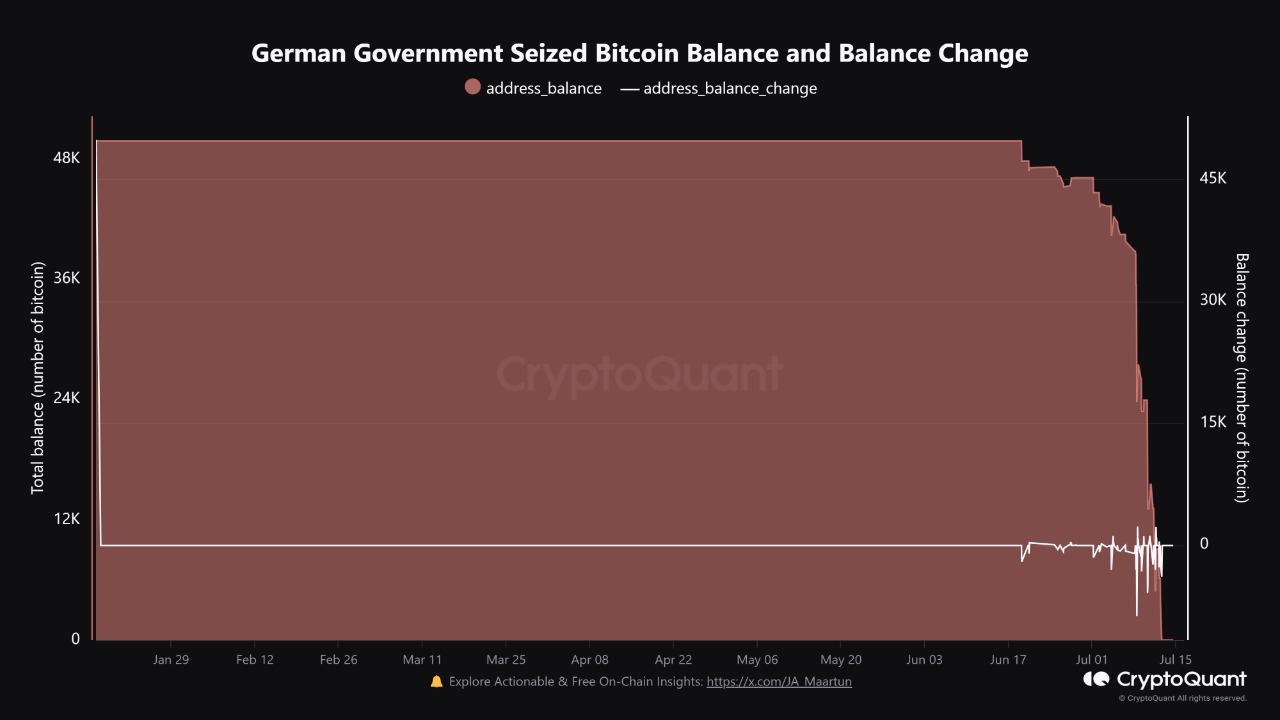
The German government completed the distribution of its ~50k BTC holdings, which had been causing FUD in the market. This sell-off had been a source of concern, similar to when LUNA sold around 80k BTC, leading to a price drop from $45k to $25k. However, this cycle, the market has shown much greater resilience.
### Market Structure
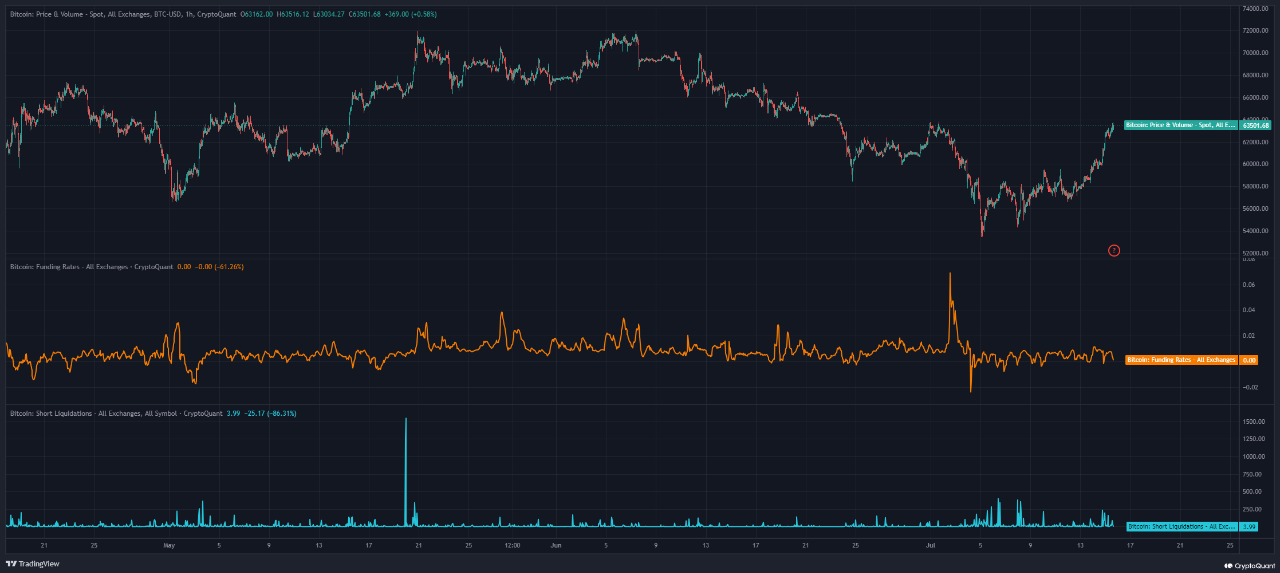
The recent recovery appears to have been driven primarily by spot market purchases. The Spot CVD has returned to positive territory, indicating healthy buying activity. There were no significant short position liquidations during this move, and funding rates for perpetual contracts remain neutral. This creates a much healthier price structure for Bitcoin to continue consolidating above the current range.
### Reaction to Political Events
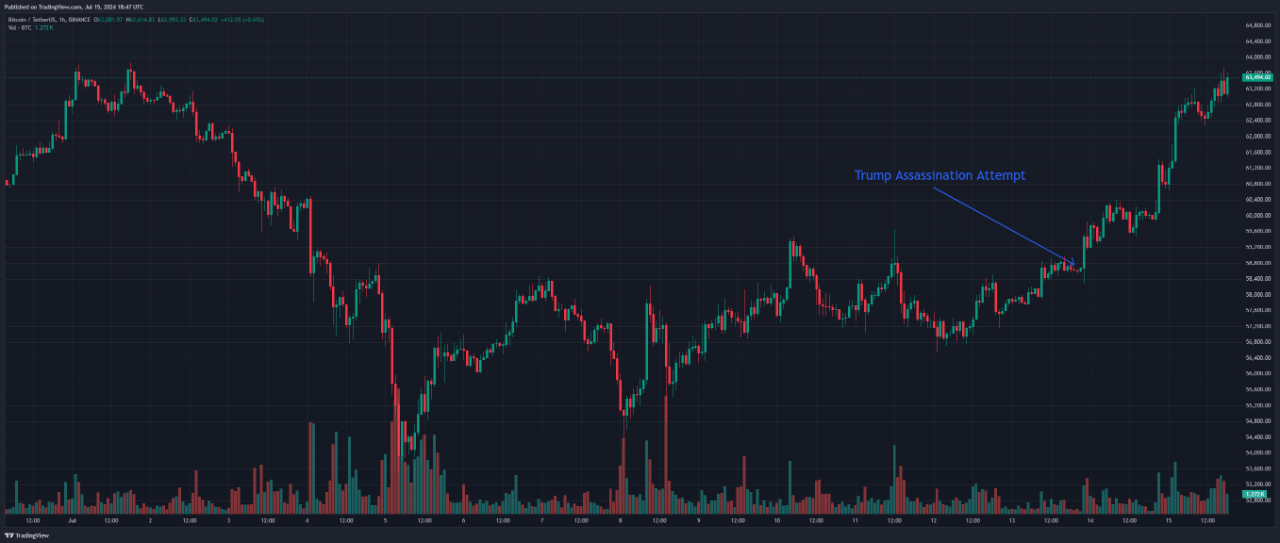
We must also comment on the market's reaction following the assassination attempt on U.S. presidential candidate Donald Trump. The market underscored on Saturday that it has a favored side in the U.S. elections. - once it was confirmed that the candidate was unharmed, it became clear that this incident has strengthened his position in the electoral race. Subsequently, increased buying volume entered the market, pushing Bitcoin's price up by approximately 4% in the following hours.

View original →Bullish(Nuanced)BTC
6/25/2024 In the last three weeks, Bitcoin has undergone a correction of approximately 15%, dropping from the $70k range to the $60k range.
With the more significant correction yesterday, signs of a possible local bottom have emerged:
Futures Market: Open Interest has declined by about $3 billion in the past three weeks, with a predominance of long liquidations. The funding rates for perpetual contracts have dropped to near zero, indicating a greater balance between buyers and sellers, creating a healthier and less overly optimistic price structure.
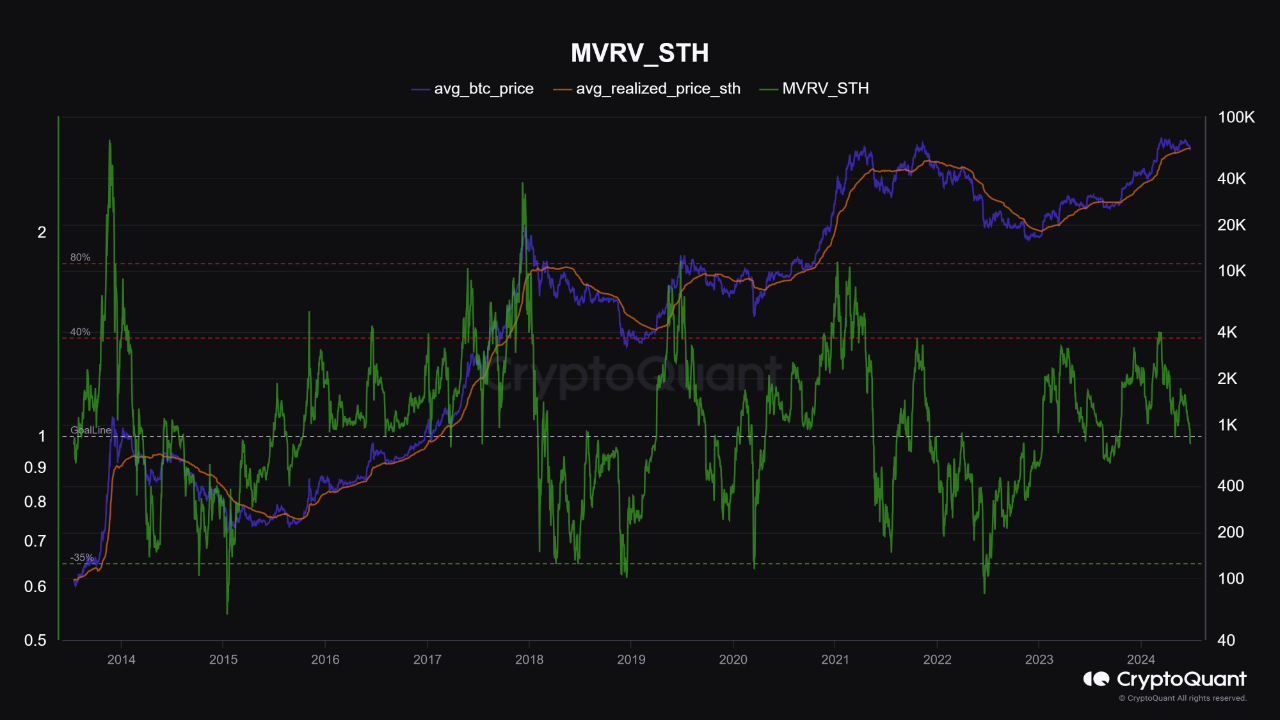
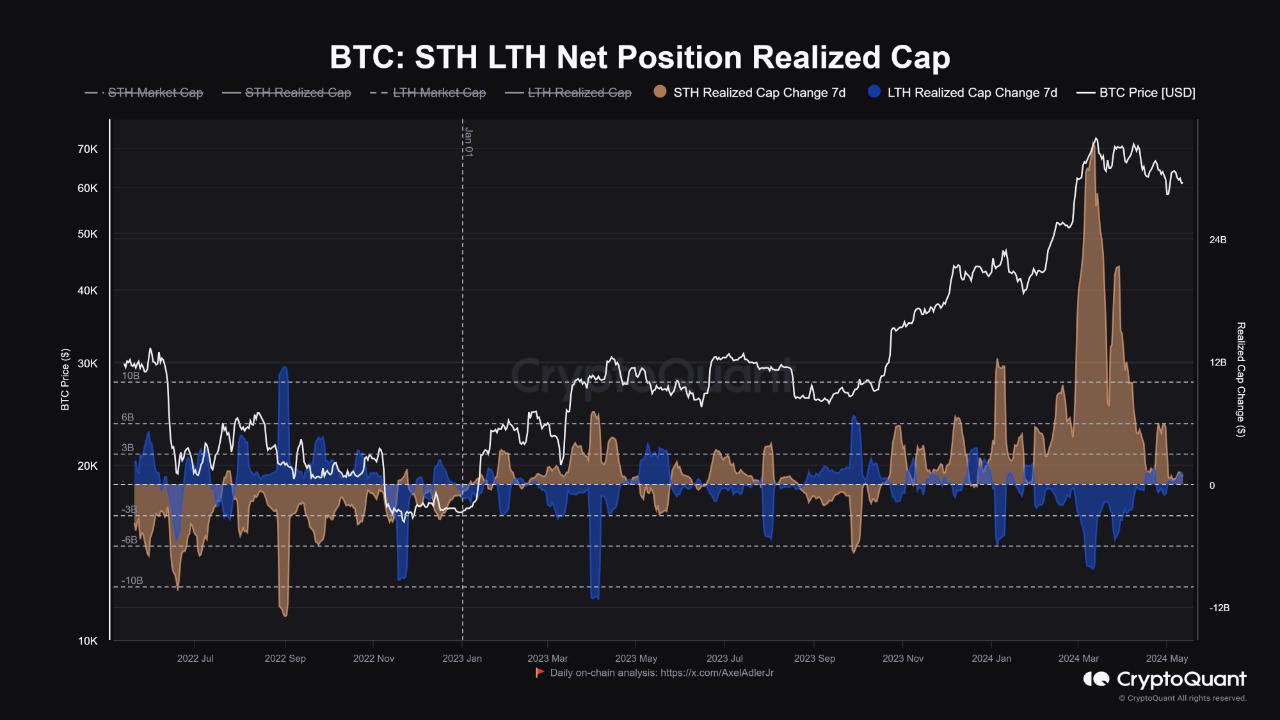
Short-Term Holders: The price has crossed the realized price of short-term holders (STHs), which was at $62.6k. Currently, STHs are experiencing slightly negative average profitability, a point that has historically acted as support for local corrections during uptrends.
A significant factor influencing price action in recent months has been U.S. macroeconomic data, given the uncertainty about the future of American monetary policy, which affects investors' risk appetite. On Thursday, we will have GDP and initial jobless claims data, and on Friday, inflation data (PCE), which are expected to dictate market sentiment in the short term. However, the current structure suggests a possible local bottom.



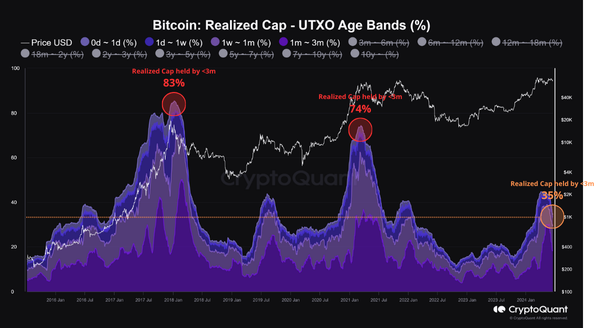
View original →A central characteristic of BTC cycle tops is the dominance of coins with a holding period of less than 3 months.
Historically, this indicates that long-term holders (smart money) have already taken their profits, leaving the market under the control of speculators and new entrants, resulting in a more volatile market structure.
In previous cycles, the proportion of the realized cap held by this age group (<3m) exceeded 70% during market peaks. Currently, only about 35% of the realized cap is in the hands of these short-term holders, a level comparable to the early stages of previous bull markets.
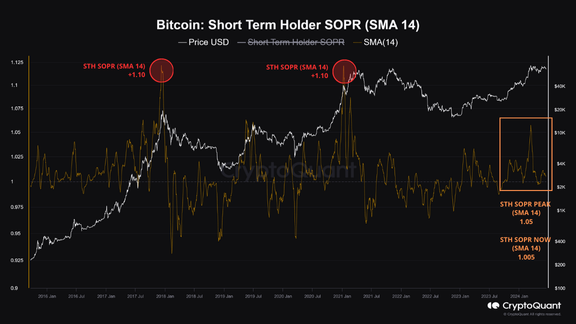
Another crucial indicator at the tops of previous cycles is the realized profit level among short-term holders, measured by the SOPR (Spent Output Profit Ratio) of this group, which exceeded 1.10 on a 14-day moving average. In the current cycle, the highest peak was 1.05 when Bitcoin reached its all-time high, now operating in a more neutral zone.
This structure suggests that we have not yet reached the peak euphoria of this cycle. The predominance of long-term holders in the market forms a more solid price support base. This robust structure and the relative scarcity of short-term holders make an immediate transition to a bear market less likely, indicating that there is still potential for a significant rally before the cycle top formation.

View original →In the past 24 hours, Bitcoin's price has risen approximately 4%, trading again above the $70k mark. One of the drivers of this movement has been strong demand through ETFs, with net inflows of approximately $1.2 billion over the last week.
Key Observations:
Short-Term Holder Profitability: The recent price increase has restored a healthy level of profitability for short-term BTC holders, reducing the risk of a break in investor sentiment and a reversal from a bullish to a bearish trend.
Price Consolidation: Despite the rise, a consolidation within the $60k to $70k range still seems more plausible for some time. This is due to the lack of significant macroeconomic incentives for a massive influx of capital into the market and the transition to a phase of euphoria, as observed in previous cycles.
Economic Calendar: This week, the economic calendar is weak, which is positive in the current context, considering the still positive sentiment with the latest U.S. inflation data. However, a shift to a risk-off sentiment due to poor economic data could lead to a correction back to the $60k range.
Outlook: Despite my base scenario of consolidation, signs of a new wave of demand are emerging. There is a growing possibility that the next rally could begin sooner than expected.
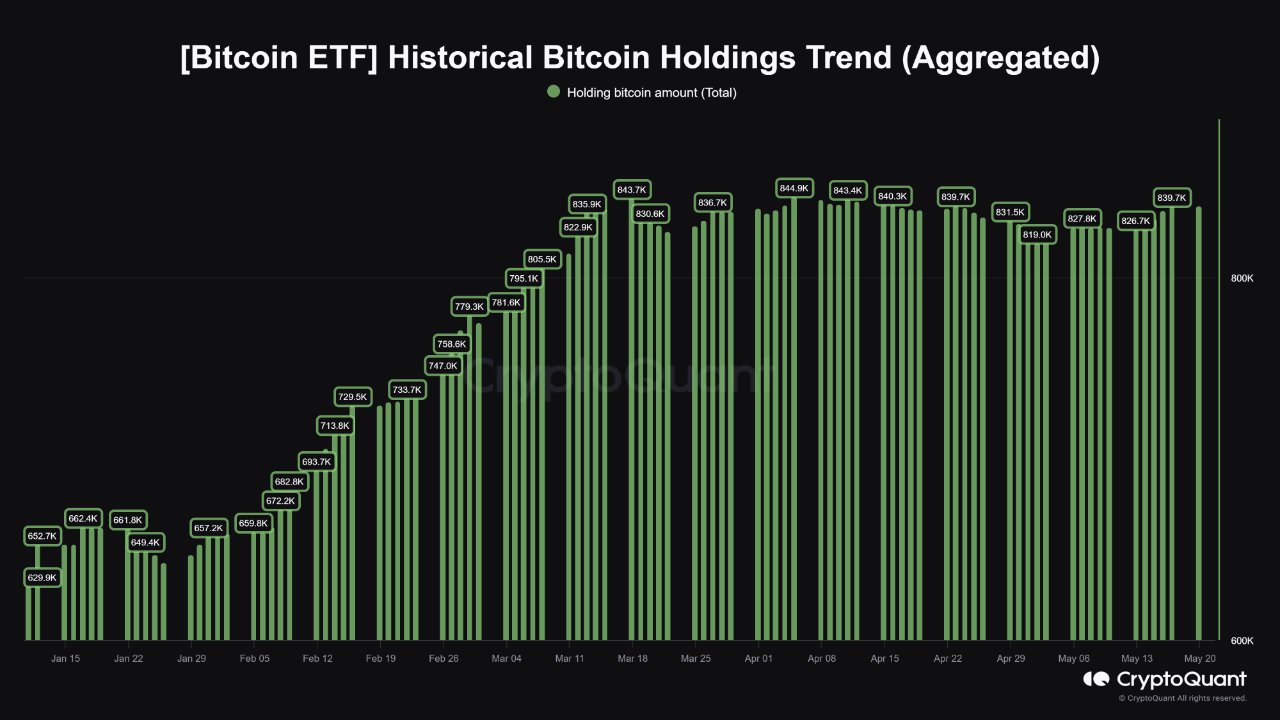

View original →In the past 24 hours, Bitcoin's price has risen approximately 4%, trading again above the $70k mark. One of the drivers of this movement has been strong demand through ETFs, with net inflows of approximately $1.2 billion over the last week.
Key Observations:
Short-Term Holder Profitability: The recent price increase has restored a healthy level of profitability for short-term BTC holders, reducing the risk of a break in investor sentiment and a reversal from a bullish to a bearish trend.
Price Consolidation: Despite the rise, a consolidation within the $60k to $70k range still seems more plausible for some time. This is due to the lack of significant macroeconomic incentives for a massive influx of capital into the market and the transition to a phase of euphoria, as observed in previous cycles.
Economic Calendar: This week, the economic calendar is weak, which is positive in the current context, considering the still positive sentiment with the latest U.S. inflation data. However, a shift to a risk-off sentiment due to poor economic data could lead to a correction back to the $60k range.
Outlook: Despite my base scenario of consolidation, signs of a new wave of demand are emerging. There is a growing possibility that the next rally could begin sooner than expected.



View original →Over the last two months, Bitcoin has traded sideways, after the recent rally that pushed its price beyond the all-time high. This prompts the question: what is needed to move out of this zone?
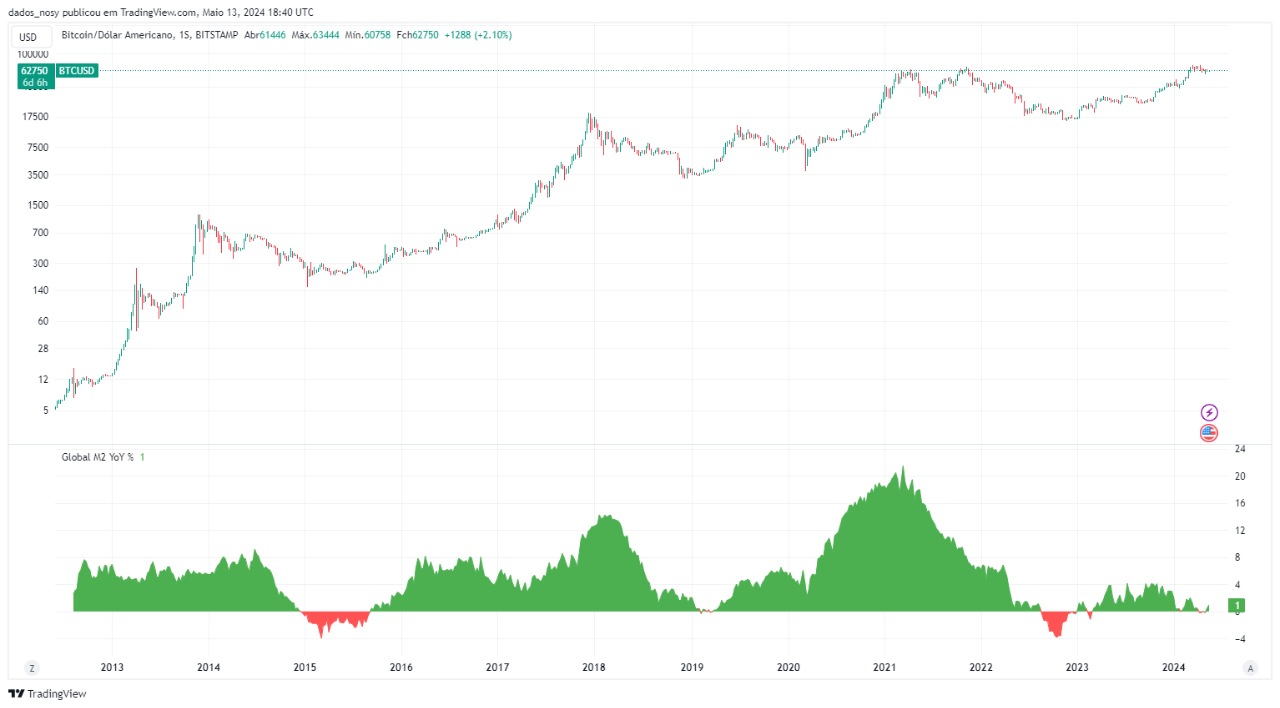
Historically, the most rapid expansions in Bitcoin have corresponded with significant increases in the global money supply (M2), signaling periods of high liquidity and strong investor risk appetite. These periods often see substantial new capital entering the market, typically culminating in cyclical peaks driven by retail investors' FOMO.
Yet, this dynamic has not appeared in the current cycle. Despite a slight rise in global liquidity over the past year benefiting Bitcoin, the year-over-year change in M2 has returned to neutral levels early this year. This shift followed persistent inflation data in the U.S., which led to a downward revision in the market's interest rate cut expectations from five to two for 2024.
Currently, there's a lack of immediate signs indicating a surge in demand that could significantly push prices higher. On the supply side, selling pressure has decreased as LTHs have seen price stabilization around $60k, and STHs have reduced sales due to decreased profitability.
Given this context, it seems likely the market will maintain its sideways trend until triggers emerge that can drive a decisive movement. Current market structure, including factors like profitability, leverage, and the age distribution of coins, suggests there's potential for a more expressive rally within this cycle.
The most probable scenario for me is that Bitcoin will stay within this trading range until a more favorable macroeconomic setting emerges, likely centered around the expected first U.S. interest rate cut in September. Such an environment could spark a new demand wave and a subsequent rally, marking the cycle's peak.
P.S.: The upcoming U.S. inflation data, expected this week, is pivotal and may shape market expectations about short-term monetary policy.

View original →On-chain discipline is proving to be an increasingly powerful tool for understanding network psychology and navigating the stages of Bitcoin cycles — which, despite the peculiarities of each cycle, continue to follow a very similar fundamental pattern.
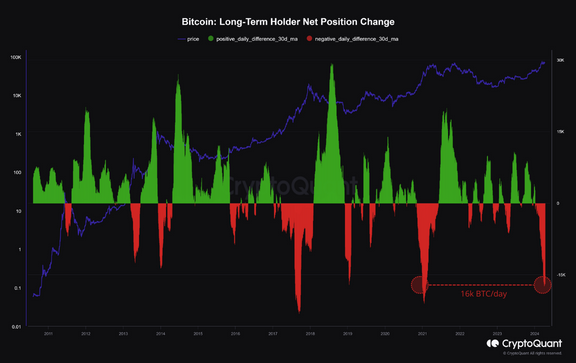
Comparing with the last cycle, the current behavior of holders harks back to December 2020, which preceded the most accelerated phase of the expansion stage.
Smart Money: As the market begins to enter a period of euphoria, we observe long-term holders moving their coins more intensively. Currently, LTHs are reducing their supply by an average of 16,800 Bitcoins per day over the last month. In previous cycles, this distribution movement lasted approximately 7 months before transitioning to the bear market, indicating that we have already gone through approximately 50% of this process.
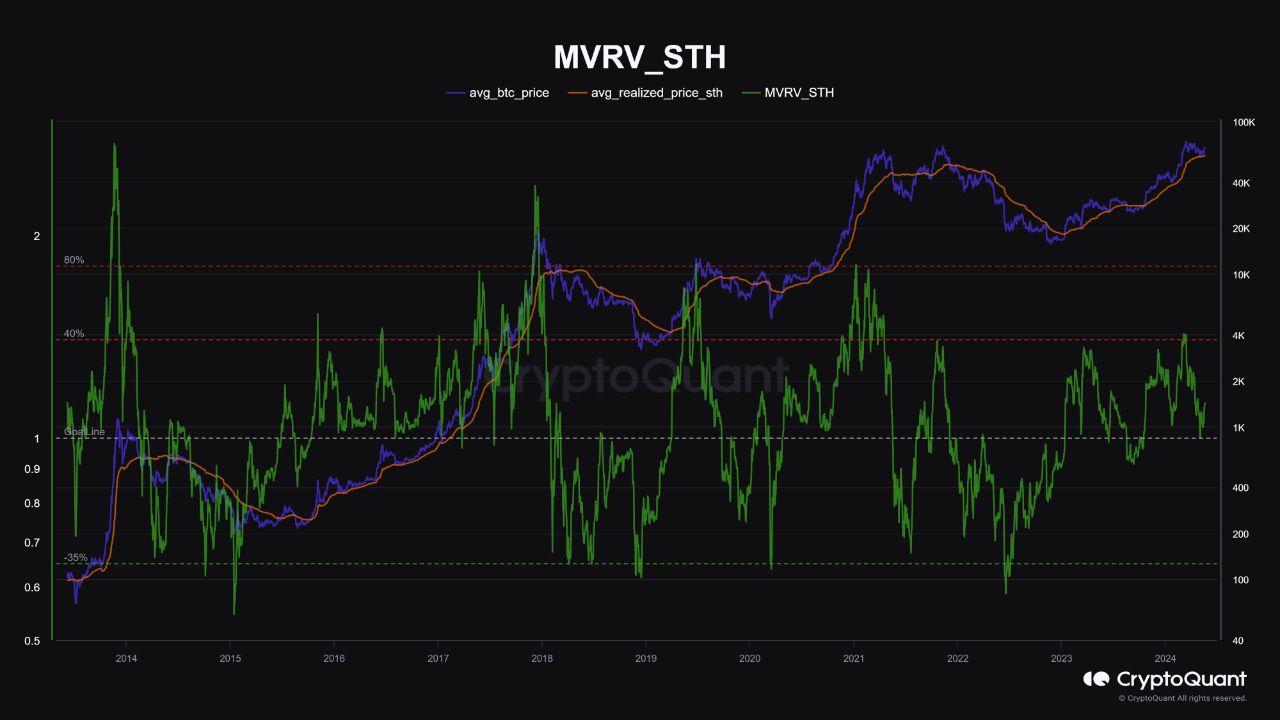
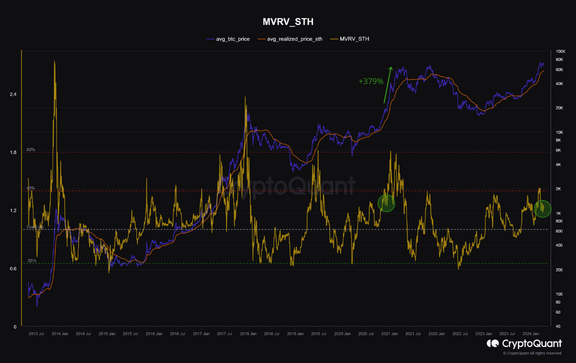
Profitability of New Entrants: While the more experienced investors sell, this pressure is absorbed by new entrants, who start to accumulate unrealized gains as the price rises — historically, volatility has been the biggest driver of greed among short-term holders, which has just begun to resurge in the market. Currently, the MVRV of short-term holders stands at 1.23, still far from the 1.80 band that marked the peak of the last two cycles.
Analyzing this dynamic, it seems there is room for a more significant rise in this cycle as liquidity expands with the increasing greed of STHs and experienced investors gradually realizing their profits.

View original →Bullish(Nuanced)BTC
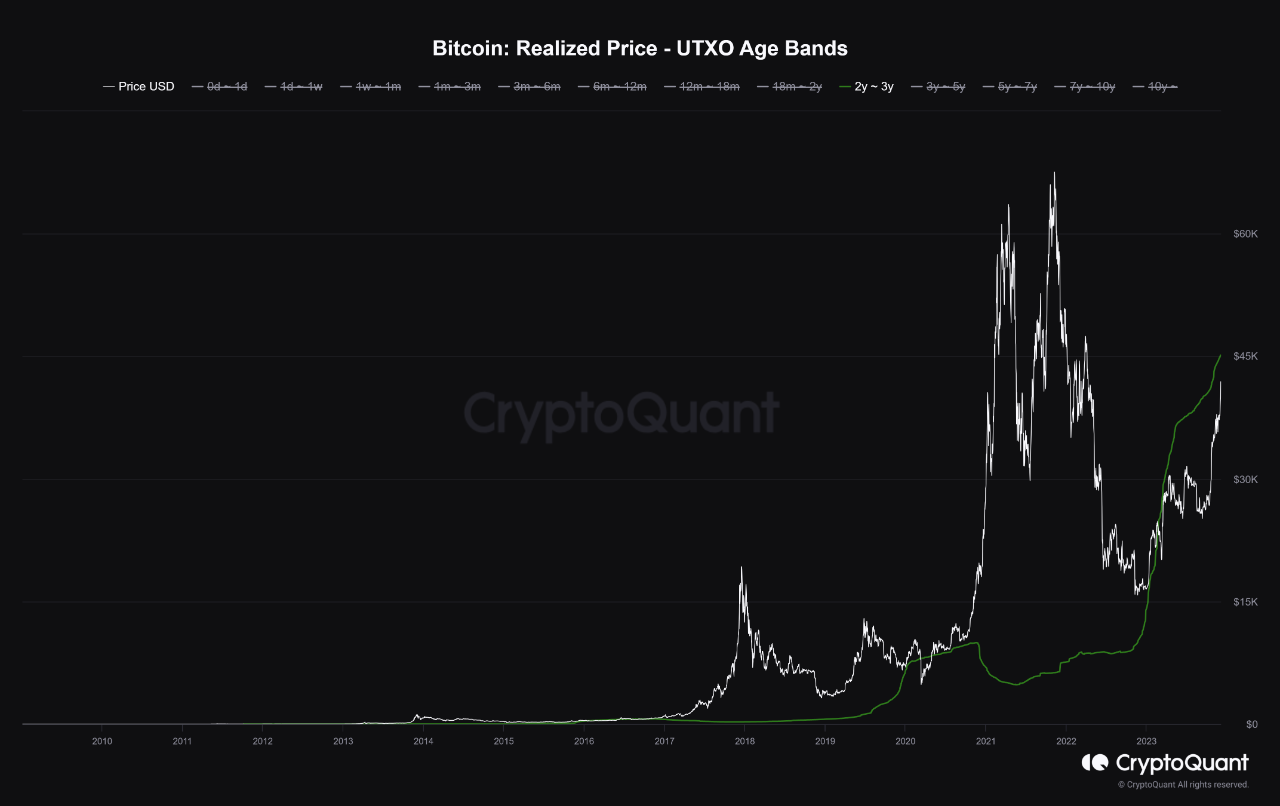
12/4/2023 With Bitcoin's recent upside from $35k to approximately $42k, market focus is increasingly drawn towards the next key resistance level: the $45k mark. This level bears significant importance, not just as a technical point, but owing to its relevance for a substantial segment of Bitcoin holders.
• Realized Price at 2-3 Years in the $45k Range: The $45k mark is pivotal as it represents the cost basis for investors who acquired Bitcoin 2 to 3 years ago. This cohort of HODLers has maintained their positions through various market phases, demonstrating strong conviction in Bitcoin's long-term value.
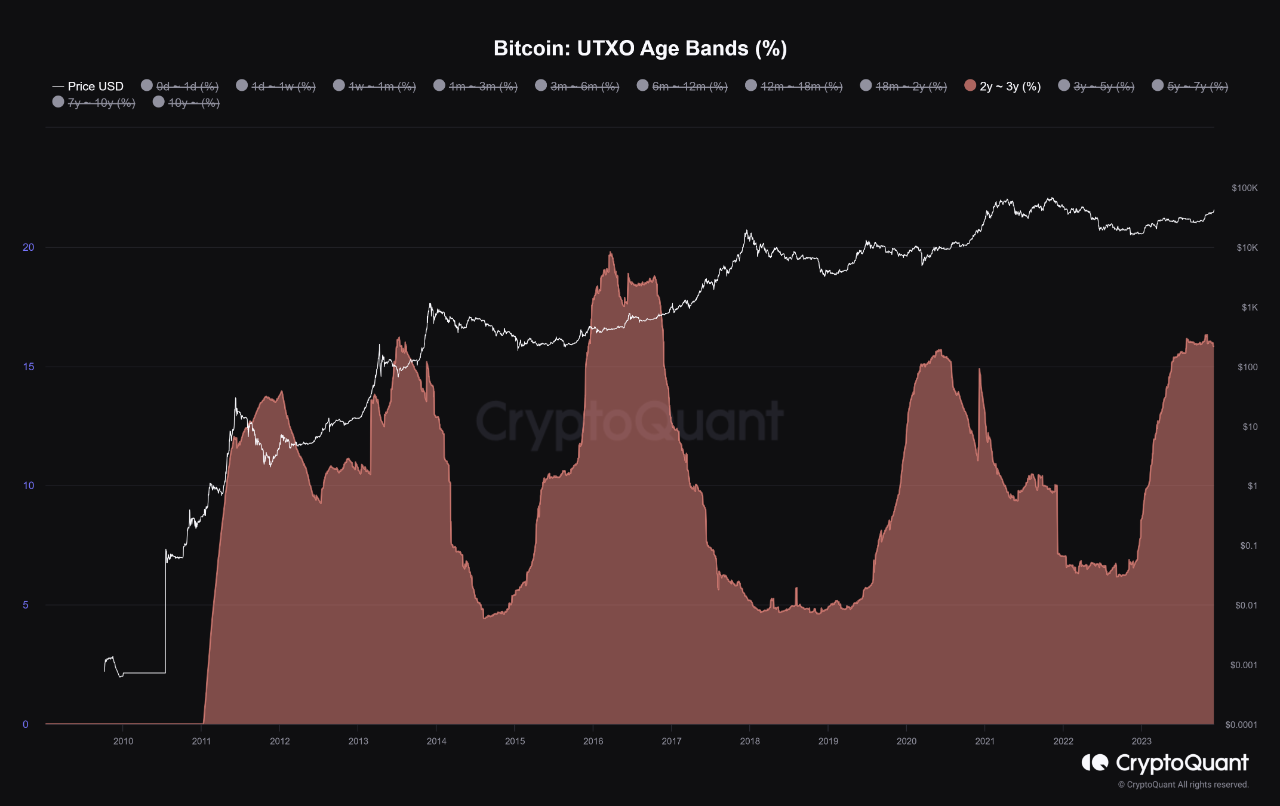
• 16% of Supply Held by 2-3 Year Age Group: It is important to emphasize that 16% of all active supply is in the hands of these medium-term investors. This detail underscores the significance of this group within the Bitcoin ecosystem, as their investment behavior can significantly influence market trends.
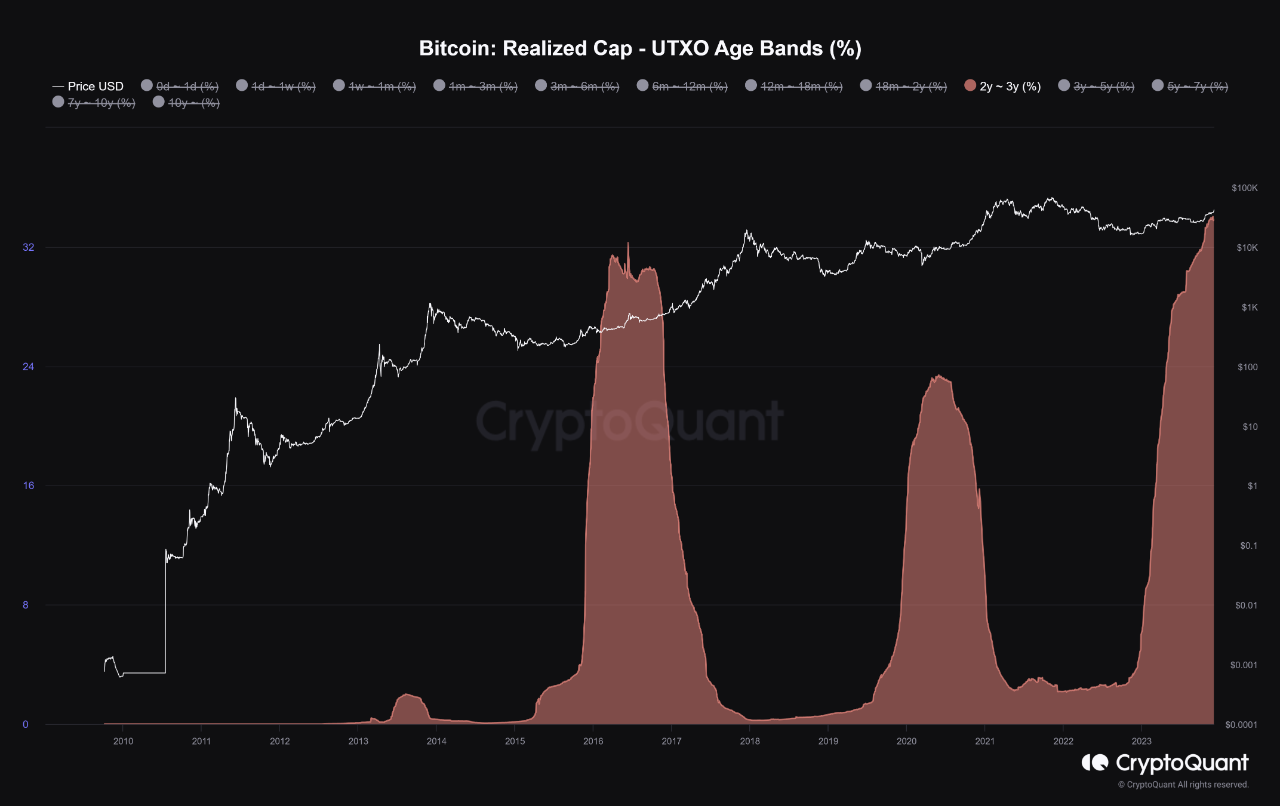
• 33% of Realized Cap Represented by This Cohort: This figure reveals that one-third of Bitcoin's realized cap is concentrated in these holders. It suggests that a significant shift in market value may ensue if this group decides to sell or continue holding their positions, especially as the price nears or surpasses their $45k break-even point.
The $45k level is crucial for Bitcoin's medium-term holders, representing a significant proportion of realized cap. Their decisions at this juncture could markedly influence Bitcoin's market trajectory. A sustained breach of this level might bolster positive market sentiment, while difficulty in surpassing this mark could lead to selling pressure. Crucially, monitoring the inflow of coins from this age group into exchanges will be pivotal to anticipate potential market movements. This proactive surveillance can provide early indications of whether these medium-term HODLers are preparing to liquidate or reinforce their positions, significantly influencing the market dynamics around this crucial price level.

View original →Today's U.S. inflation data came in with the CPI and Core CPI both falling 10bps below expectations. In reaction, the yield on the 10-year Treasury note dropped by 20bps in a few minutes.
But why does this matter for Bitcoin?
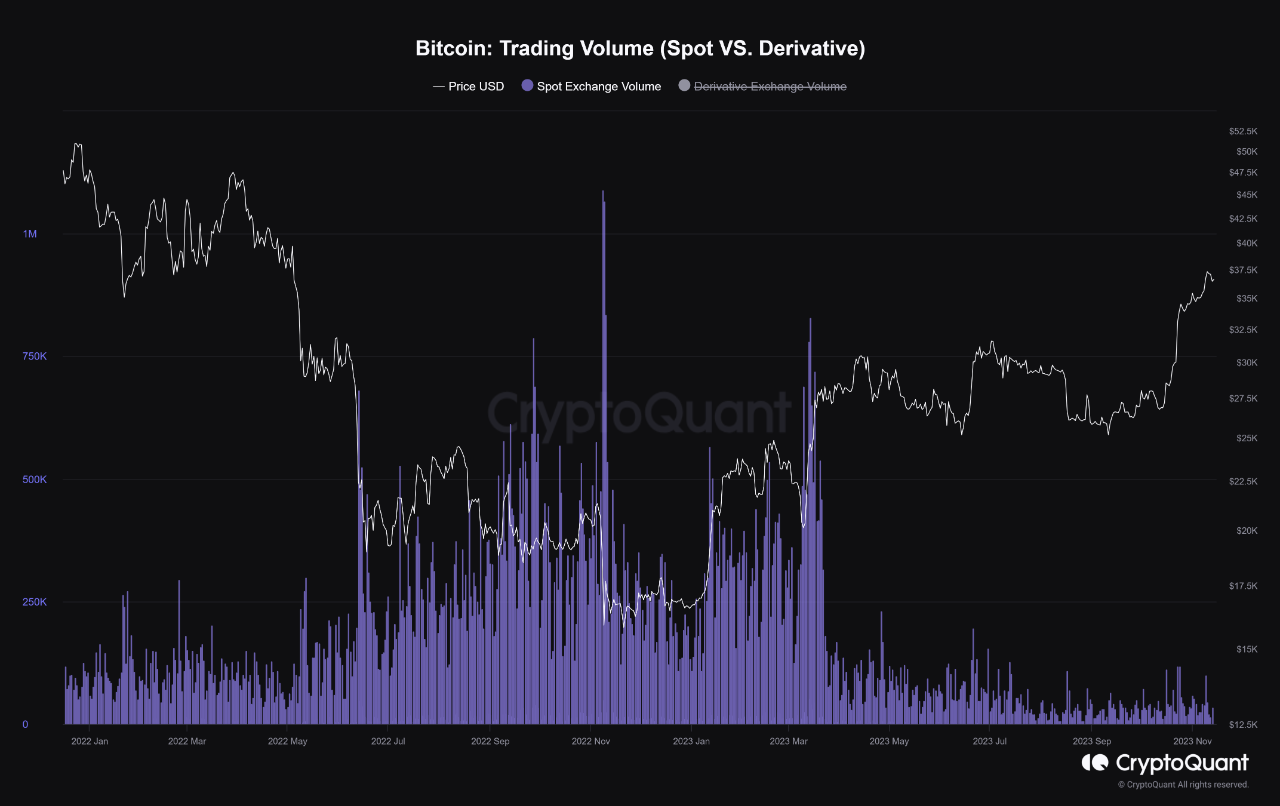
Since the onset of 2023, Bitcoin's trading volume has been overwhelmingly dominated by the derivatives market following a significant decrease in spot trading volume. This shift has led to a pricing structure that is more sensitive to speculative movements.
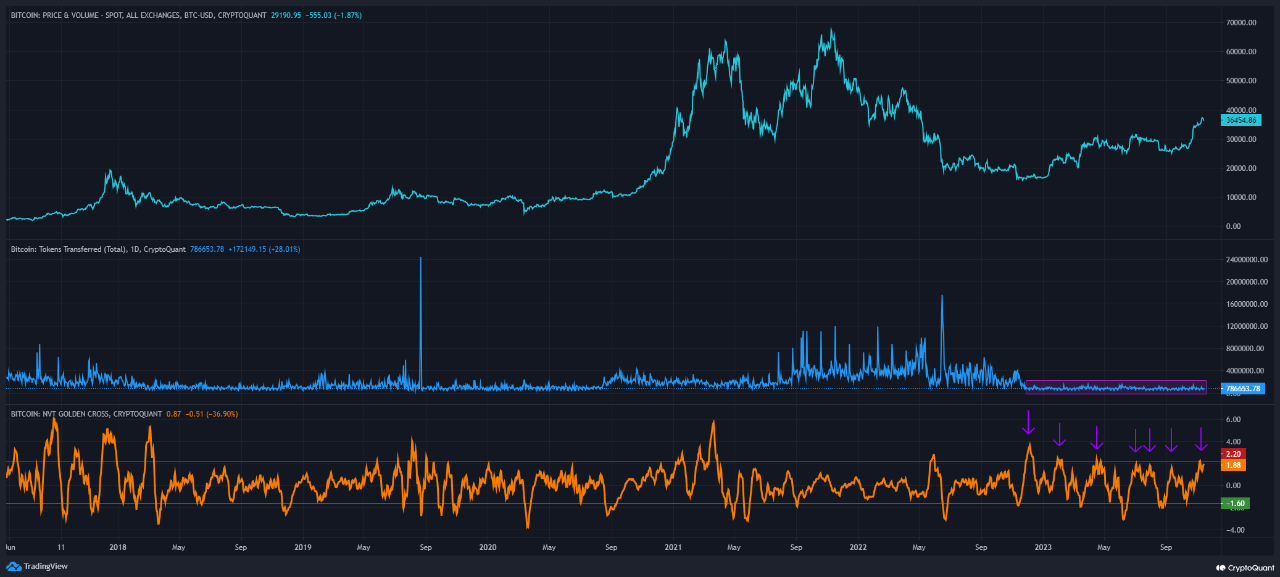
Low liquidity can also be observed through the on-chain transfer volume, which remains at a subdued level. This is reflected in the NVT Golden Cross operating above the 2.2 band multiple times throughout the year, suggesting an elevated market cap relative to the transfer volume.
Despite Bitcoin impressive rally in recent weeks, I believe that for a sustained and healthier uptrend, a resurgence of liquidity in the crypto market is essential. This positions the pivot of U.S. interest rates, one of the world's major economies, as a key driver for the 2024 bull market. Today's positive inflation data bolster the market's expectation that this pivot may occur around mid-2024.

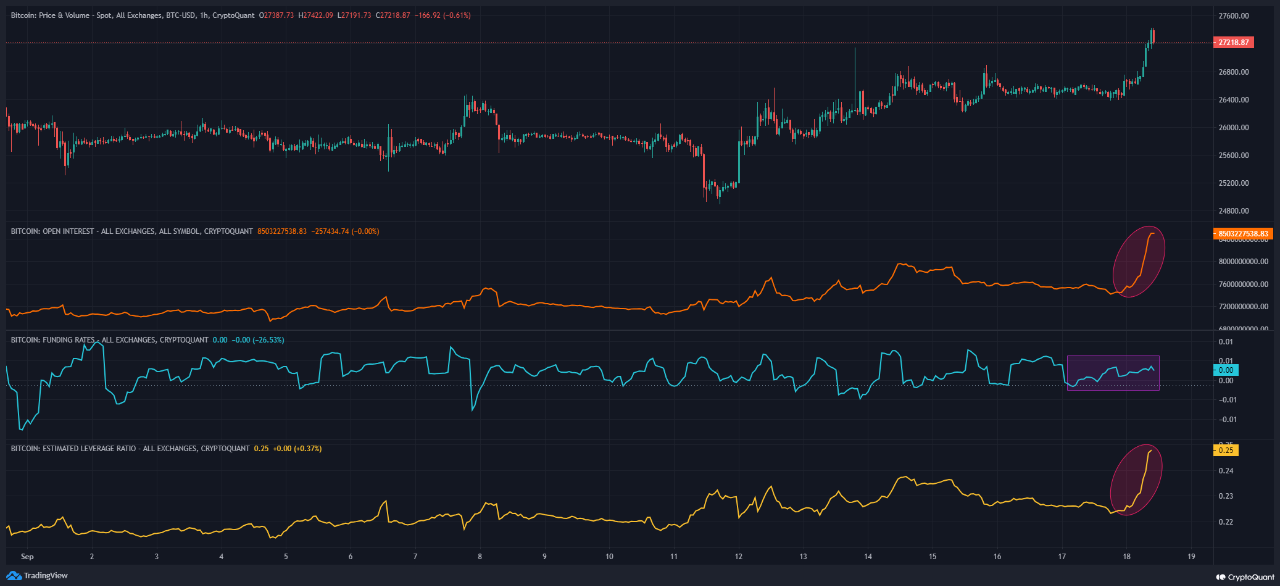
View original →BTC has shown a 3.5% upside in the last few hours, breaking the sideways pattern that had been occurring in recent days. Looking at the network activity, we have some signals that help us identify what's driving this movement.
Tracking the price action, we noticed an expansion of approximately 1 billion in Open Interest (OI), signaling an increase in the number of open positions on derivatives exchanges. The funding rates for perpetual contracts remained positive during the OI expansion, indicating the predominance of long traders and an optimistic sentiment.
Overall, this setup is positive for the price. However, it becomes more unstable when we see that the estimated leverage increased considerably during the uptrend, creating a structure conducive to a long squeeze in the event of a sharp price drop.
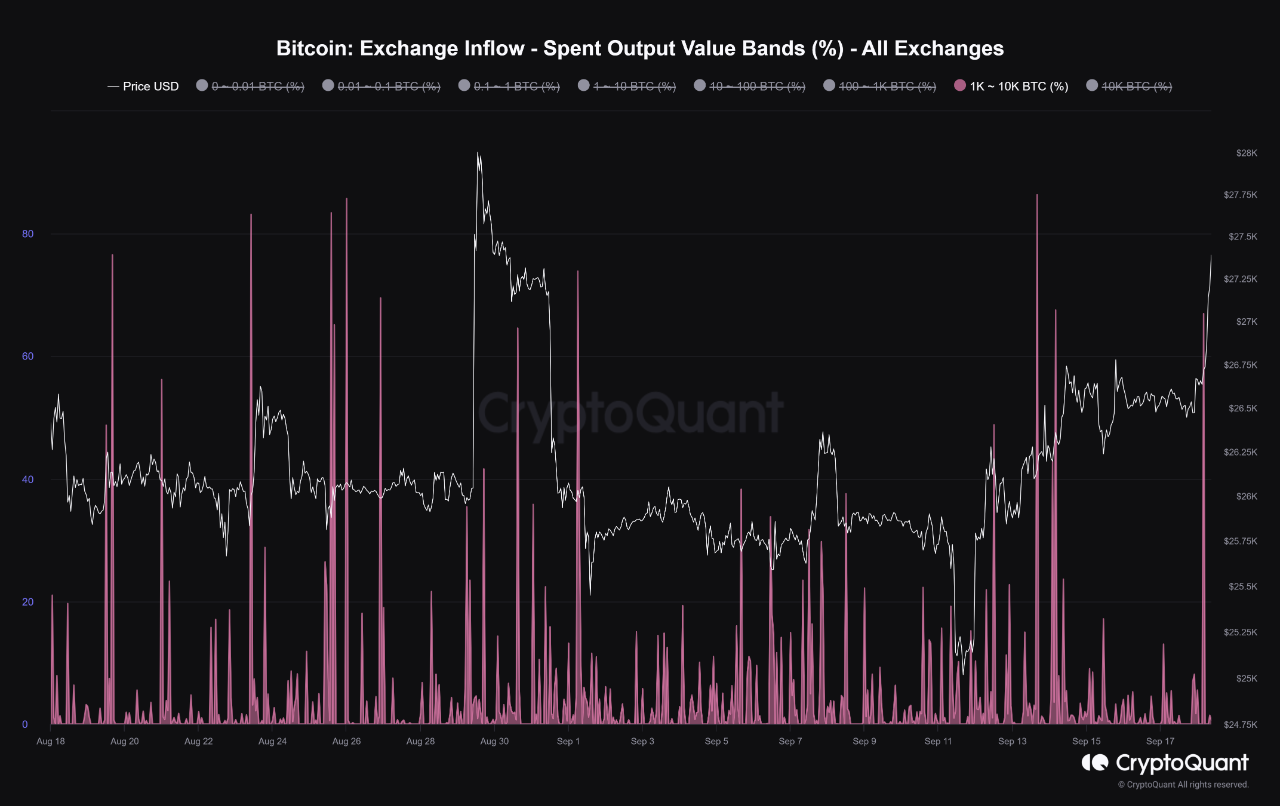
Analyzing the distribution of all spent outputs that flowed into exchanges at the beginning of the uptrend, we observed a predominance of addresses with 1k-10k BTC, accounting for 66% of the volume. The rise in the Coinbase Premium Index confirms this setup, signaling whale accumulation. Unlike other uptrends driven by the derivatives market that we've seen in recent weeks, this one seems to have more solid support in the spot market, creating a more optimistic structure.
However, it's essential not to overlook risk signals: On Wednesday, September 20, the US interest rate target will be announced. This event usually brings more volatility to the market, and with the current leverage level, the risk is amplified.

View original →

