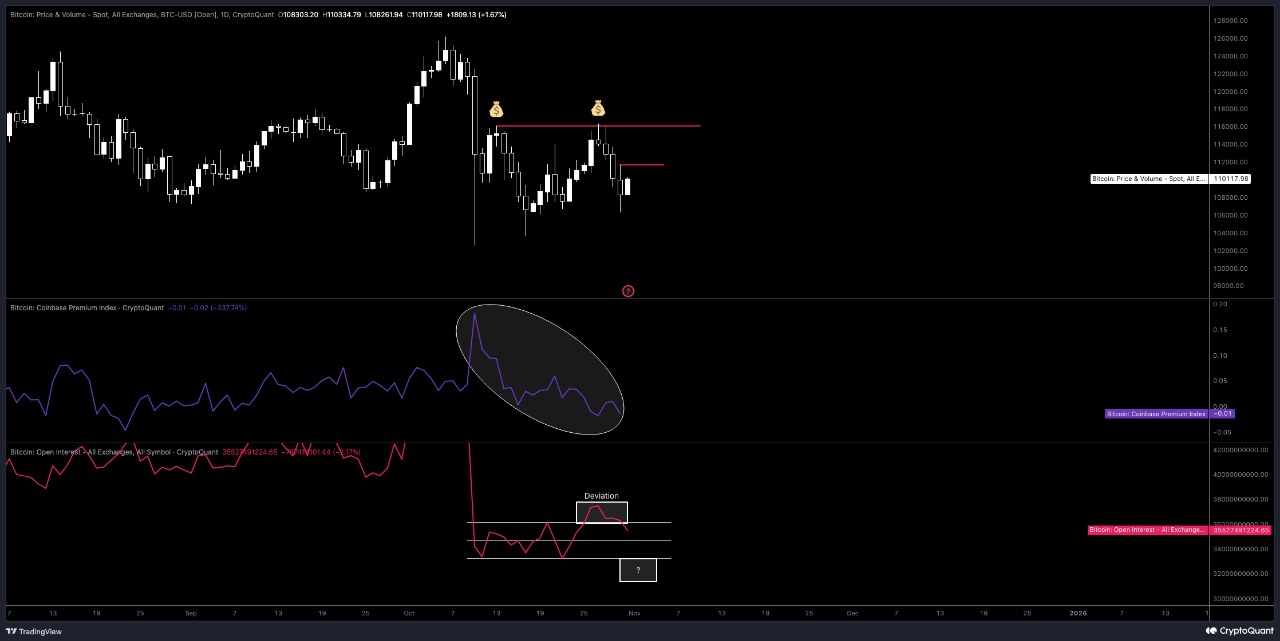
The price is moving sideways, but the Coinbase premium index is selling. In this case, I am focusing on two different resistance levels on the price. The first is the 112k level. The second is the double top liquidity zone.
When I look at the open interest indicator, movement has occurred within the Range. If this movement deviates, we could see the Range drop. This means more open positions will close.
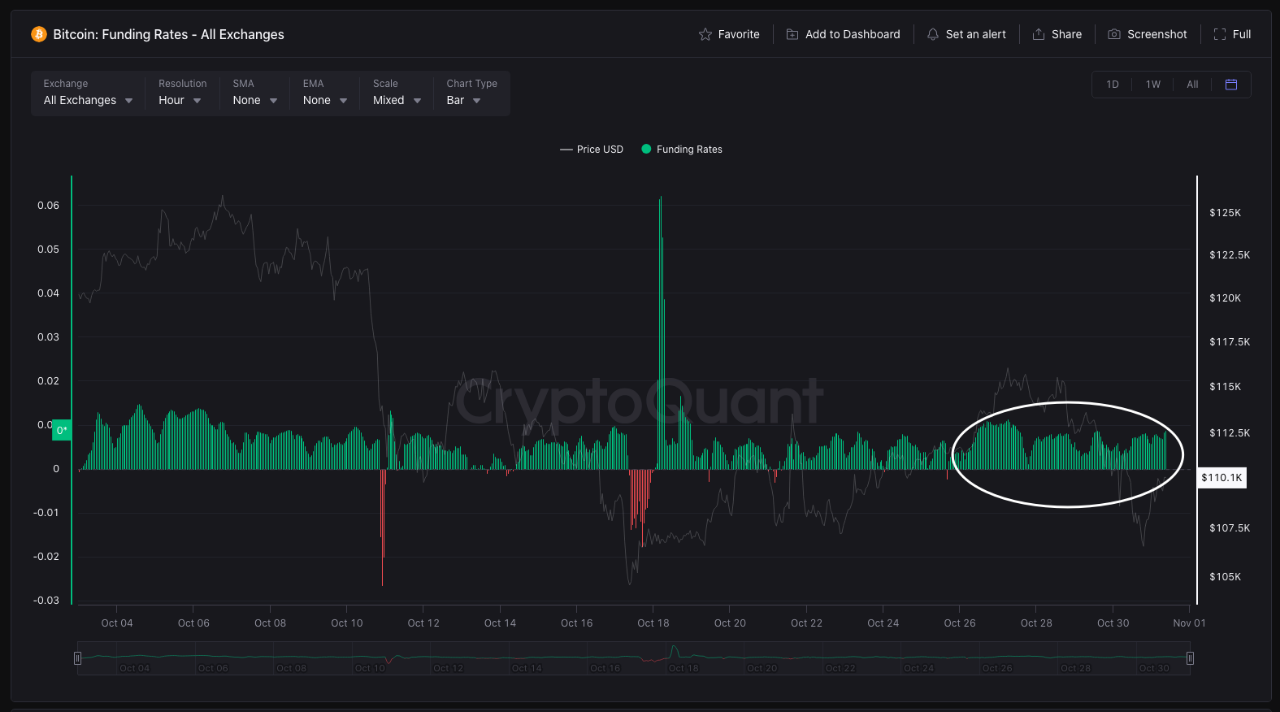
Funding rates are in positive territory. I can see the community's bullish sentiment. The real rally will begin with a breakout of the double top zone. If this zone deviates, I think the price will drop significantly.

View original →Hello Trader
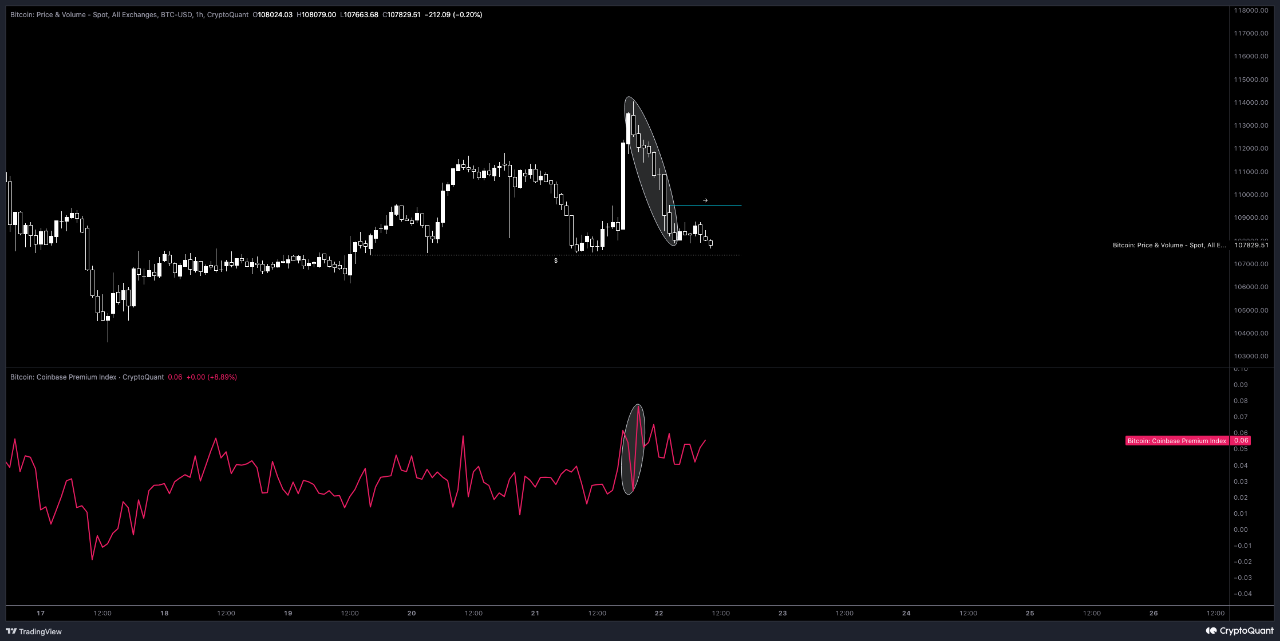
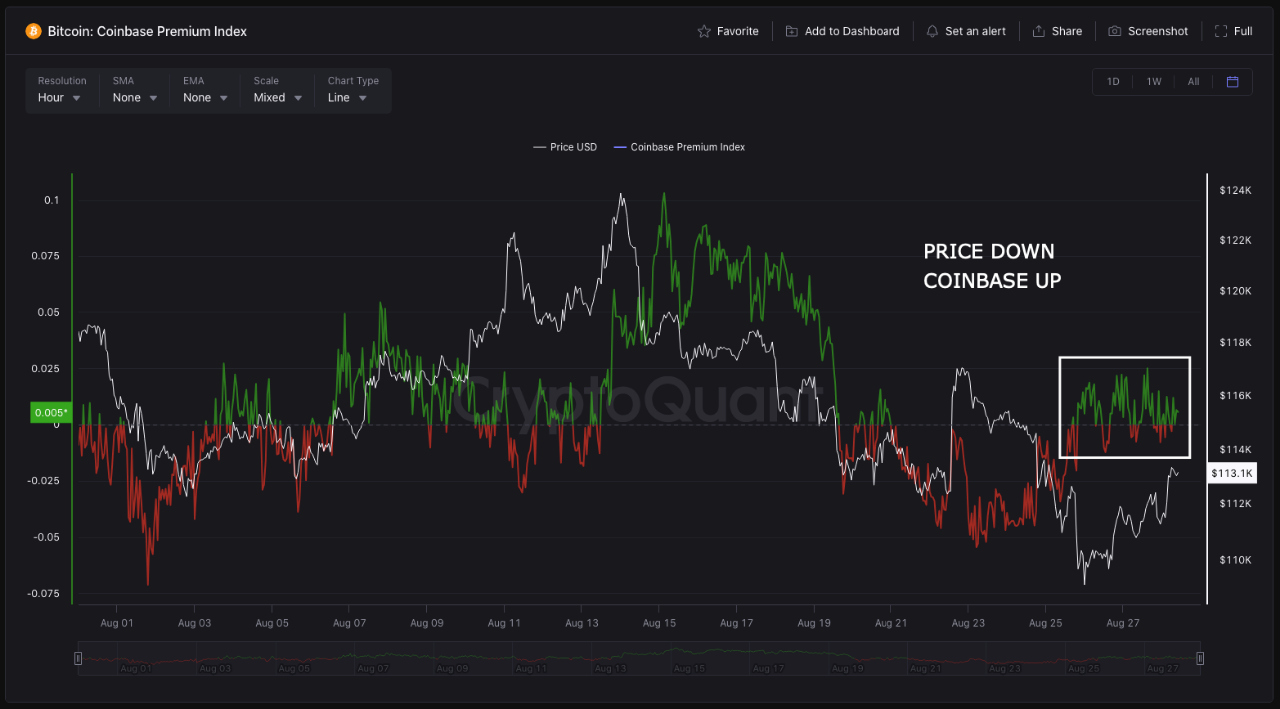
Looking at the Coinbase premium index indicator, we see that the indicator rises as the price falls. This is positive data in the short term. Additionally, there is accumulation occurring in the small time frame on this indicator. If the area I've marked with an arrow on the price breaks, the price will rise with the strength of this indicator.
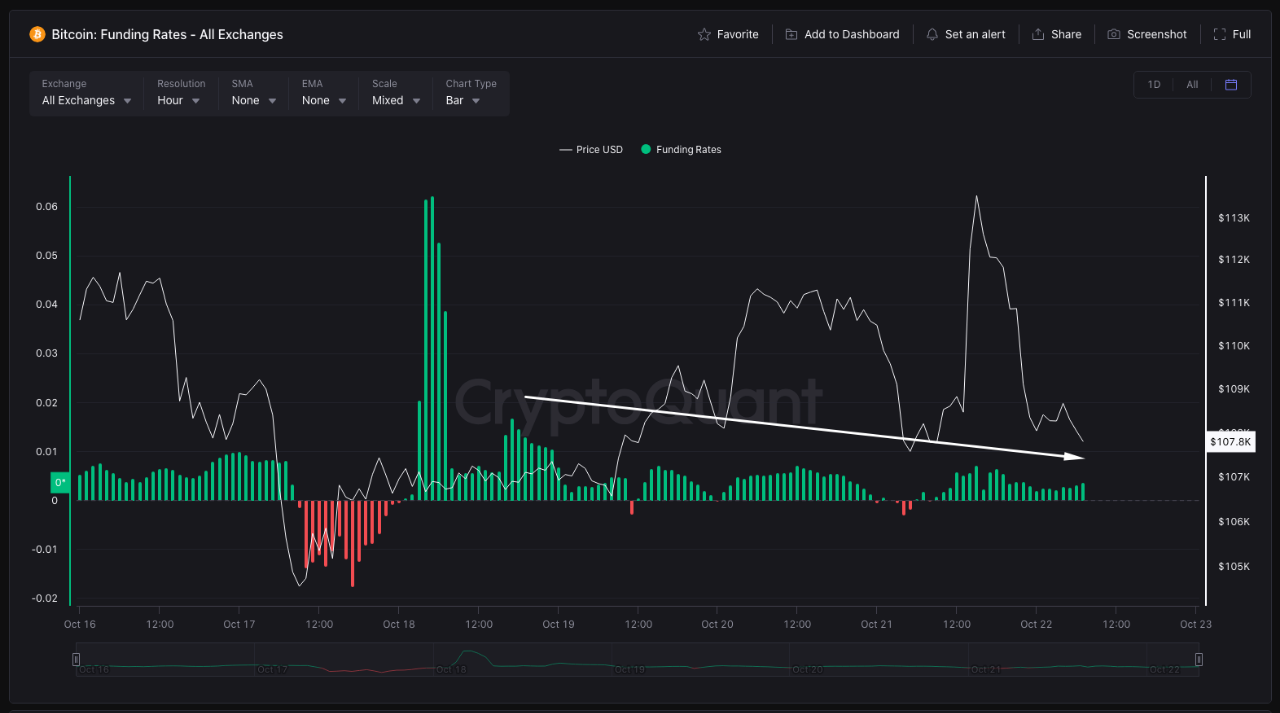
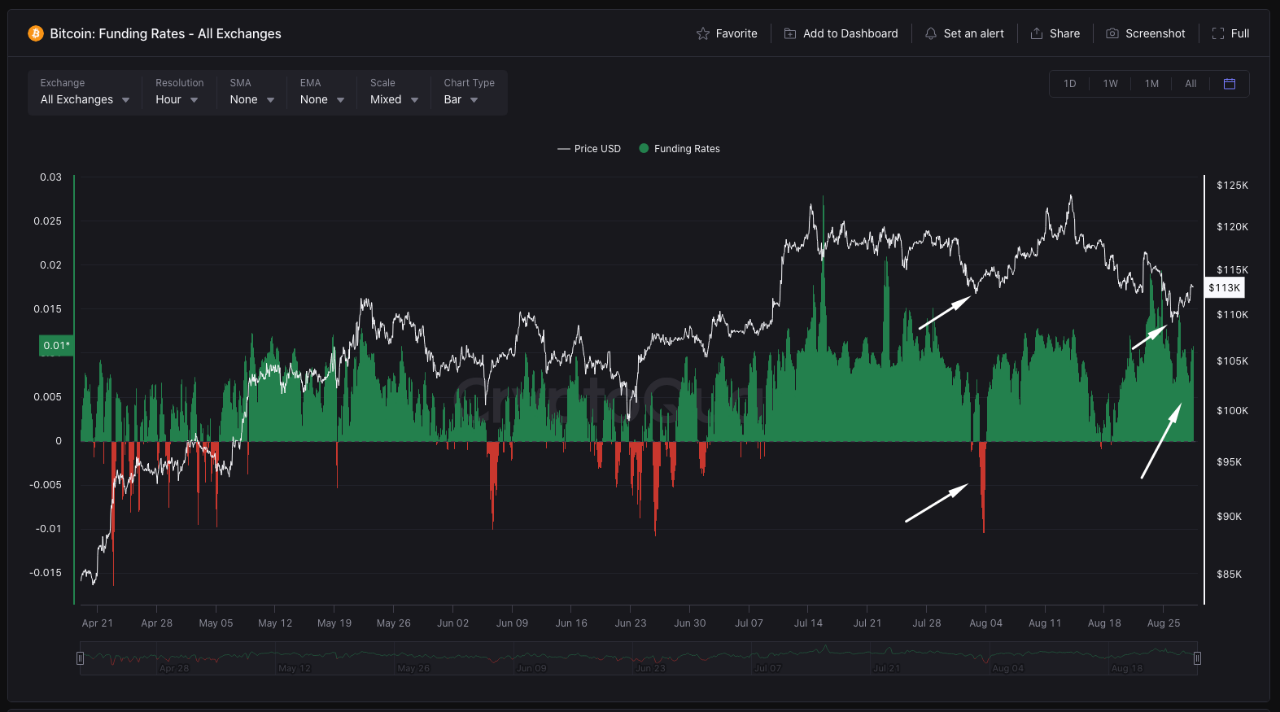
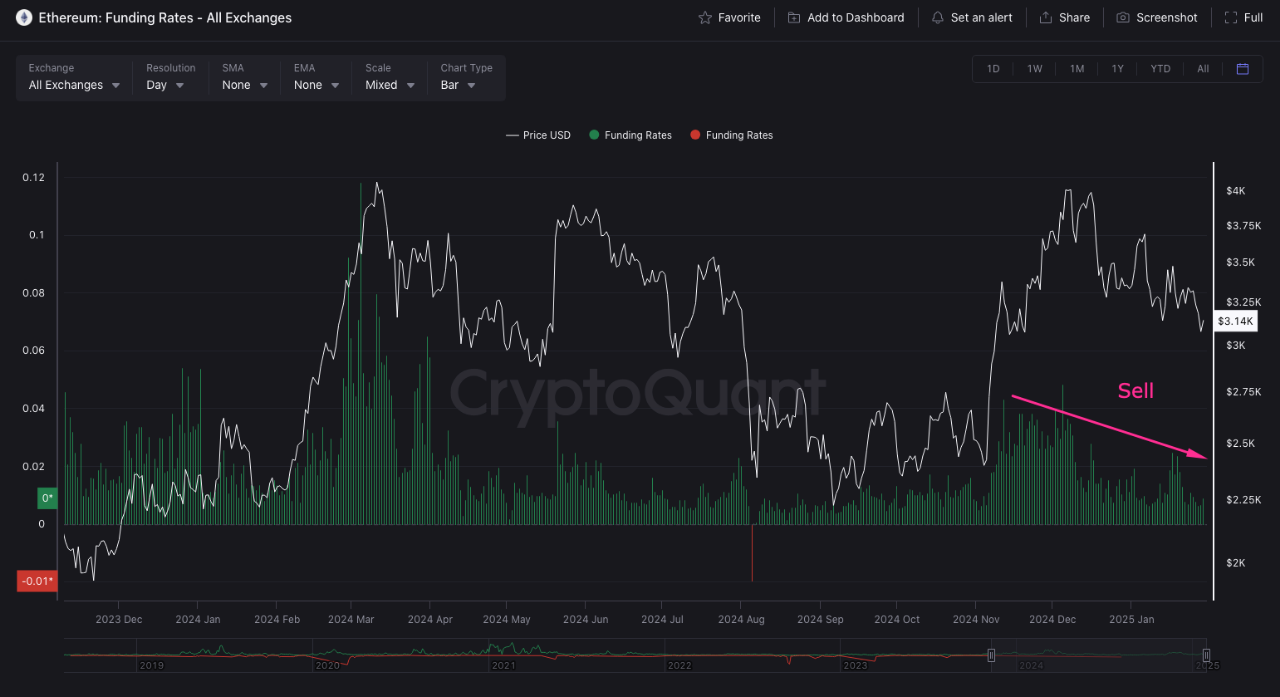
Looking at the funding rates, we see a decline. This is positive data for a bullish market. Liquidity may flow to bearish players.
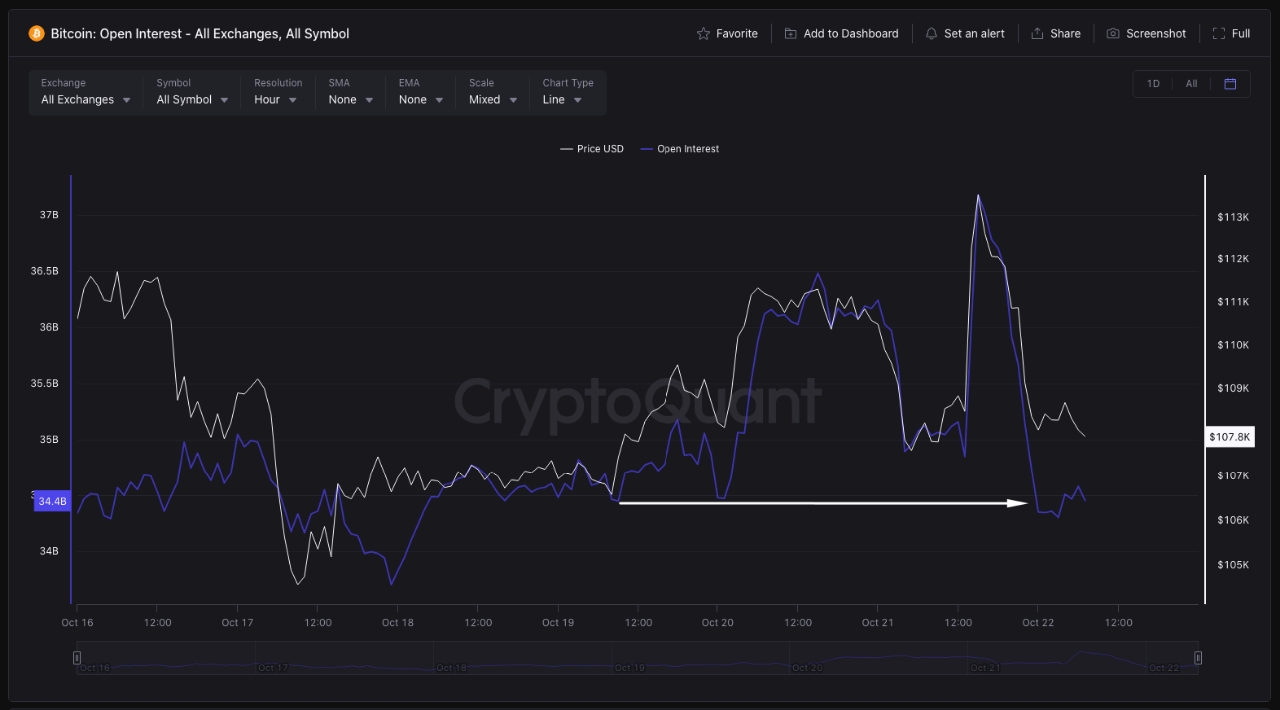
In the open interest indicator, we see that all positions opened yesterday have been closed. A strong liquidation hunt has occurred.
If the triple bottom liquidity below the price, which I have indicated, is cleared and the area I have indicated with an arrow is broken, the rise will begin.

View original →Bitcoin analysis👇
▪️Coinbase Premium Index
We see Coinbase activity rising while the price is falling. This means they have accumulated the sold product. We are accumulating in the ‘0’ zone, which is the most important level. The zone where this accumulation will break will determine the future price movement, so we need to watch it.
▪️Funding Rate
The indicator being in the positive zone suggests that the community is bullish. If you look at the previous dip zone I indicated with the arrow, it was in the negative zone and presented a buying opportunity. However, in our latest dip zone, we are in the positive zone. This raises a question mark in my mind. The formation of liquidity cleansing leads me to take less risky trades.
▪️Open Interest
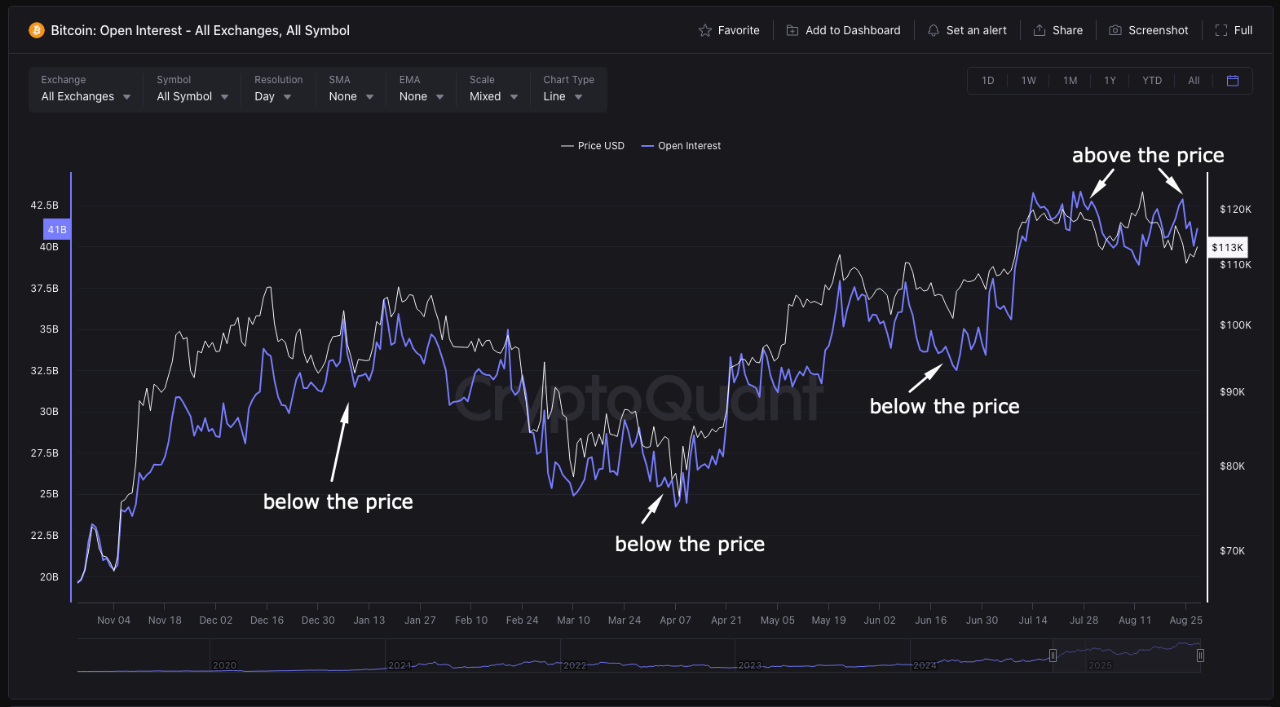
I can also use this indicator as a moving average (information I discovered myself, haven't shared before, and haven't seen anyone else mention).
If you notice, the price can act as support or resistance for the open interest price. During uptrends, it's below the price, and during downtrends, it's above the price. In the area we're currently in, it's above us. I think this level will act as resistance. If this level is broken, the price will continue to rise.
📌You can combine all this information to create a roadmap.

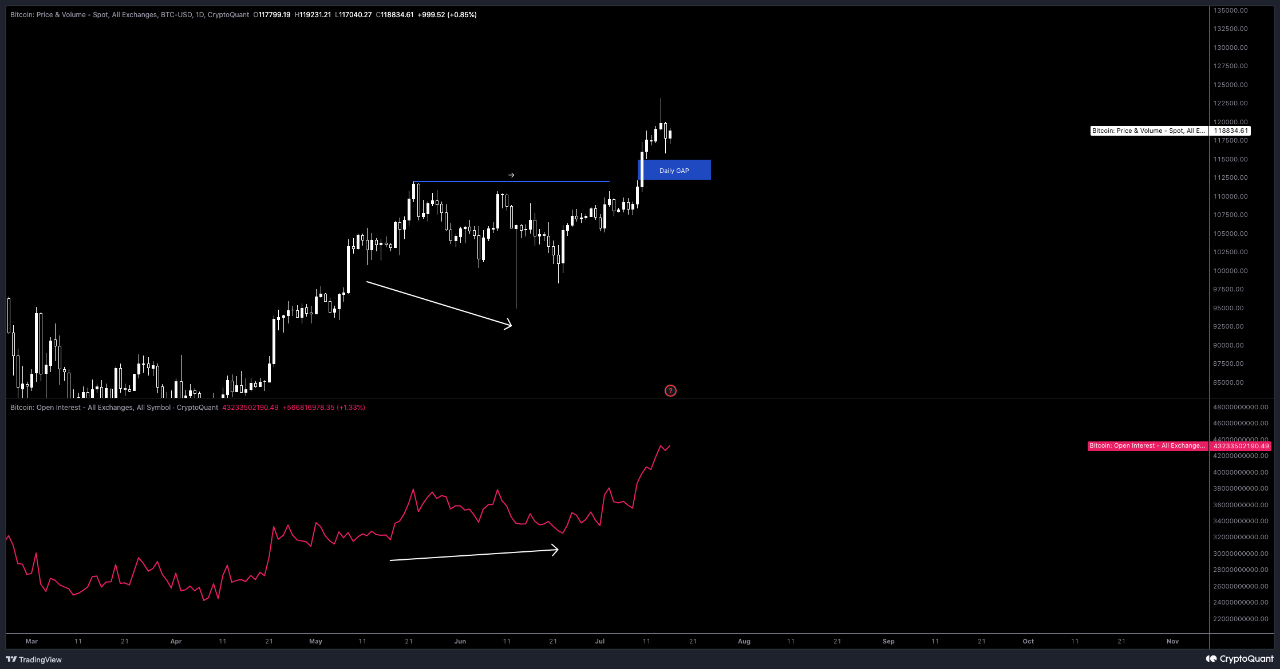
View original →Let’s start with the price action analysis first. With the breakout of the 107,000 resistance level, the algorithm has entered the distribution phase. In case of a pullback, I might consider evaluating the daily gap level below us.
When we look at the Open Interest indicator, we see a divergence with the price. This was a positive signal for us, and we started to rise afterward. Currently, the rising Open Interest along with the rising price indicates that the market is in a strong bullish phase.
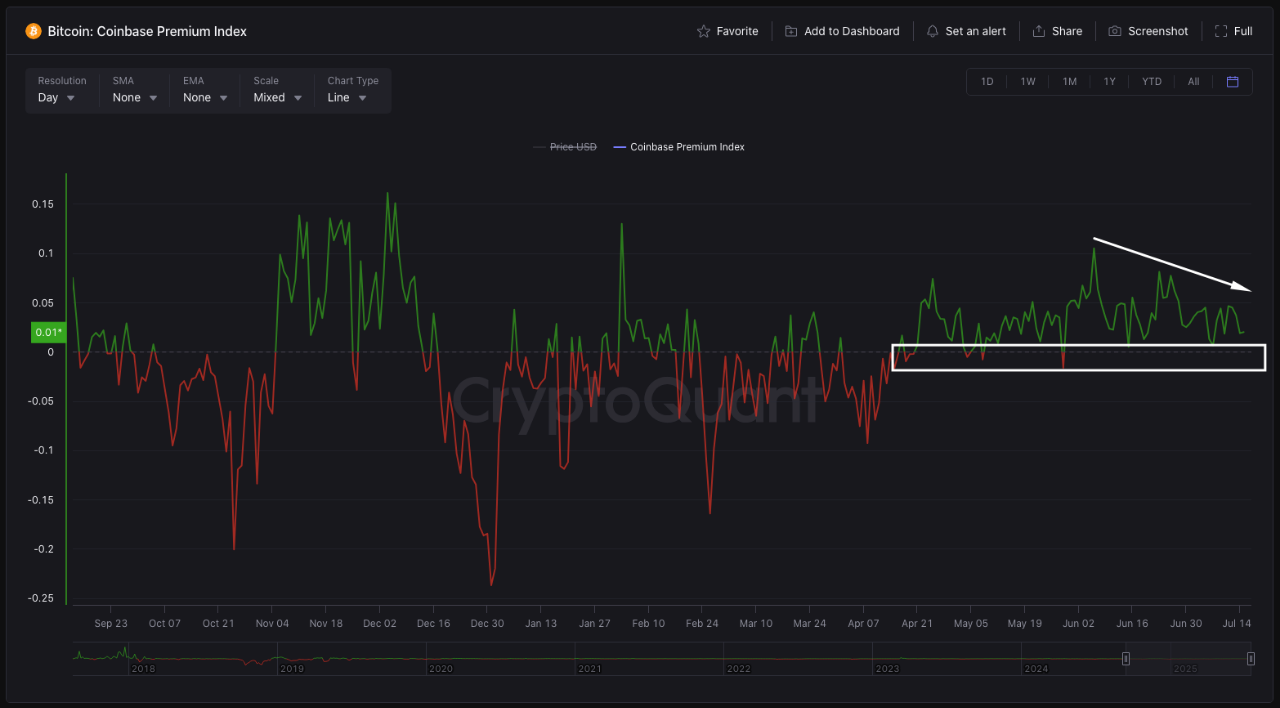
When we examine the data from the Coinbase Premium Index indicator, we can see that it is holding above the '0' level. Additionally, this area represents a Breaker structure. However, while the price is rising, the indicator remains flat. This suggests to me that major players are taking profits. If the descending trend structure I marked with an arrow is broken, the price is likely to rise much more strongly. On the other hand, if the indicator drops below the '0' level, I may consider it a buying signal, as we are still in a macro bullish market.
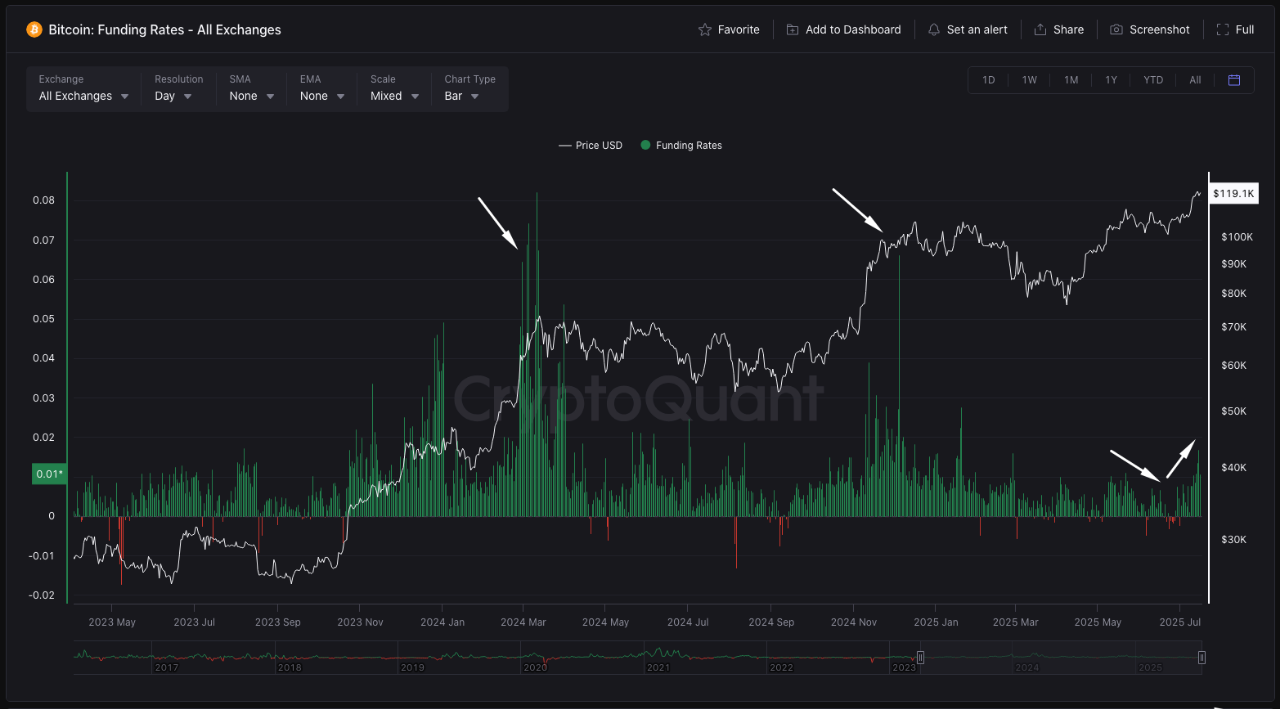
When we look at the funding rate indicator, we can see that it started to rise after a decline—this reflects growing confidence in the bullish move. However, when we examine the historical data I marked with an arrow, we notice extremely high funding rates. Back then, Bitcoin’s price was lower, yet funding rates were unusually high. Currently, the price is high, but the funding rate indicator is not showing any extremes. If it reaches an extreme level, I will take that as a potential signal.

View original →Bitcoin - Coinbase premium index / open interest
Price made a new high but Coinbase premium index made a low high.
Open interest is moving with the price. We see new trades opening.
The Coinbase premium index is dropping as new trades are opening, indicating that big players are selling or taking profits.
We should take profits on our long trades and be prepared for the Short scenario.

View original →Neutral2/5/2025
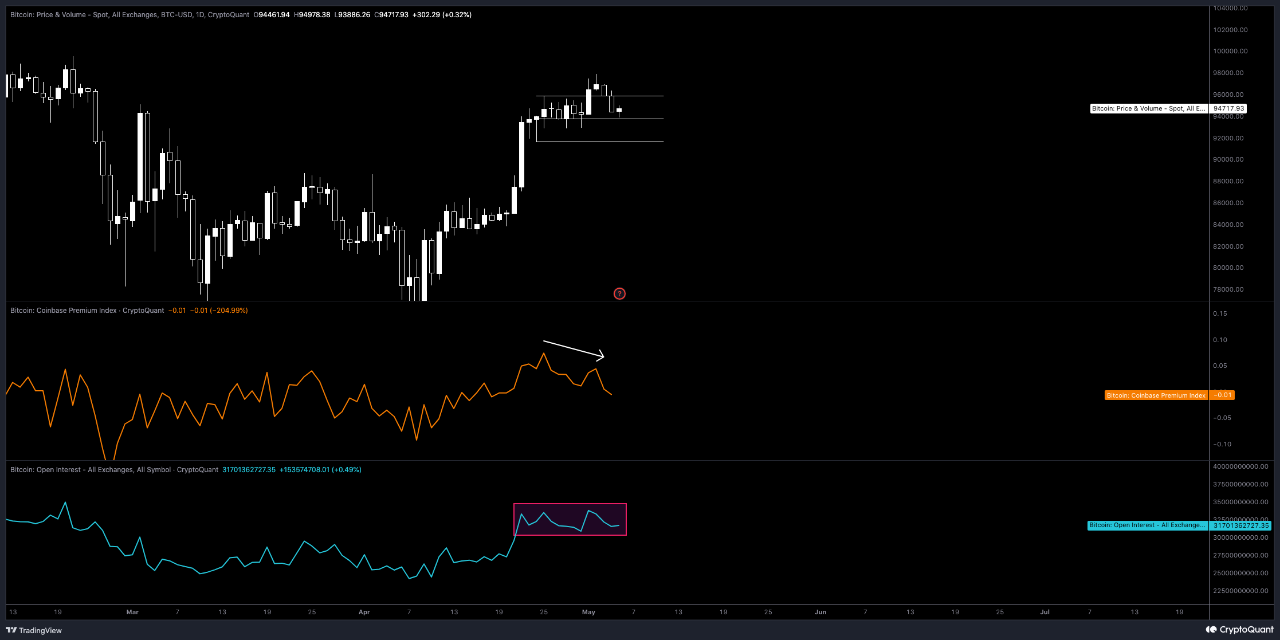
The Coinbase Premium Index indicator has broken through the '0' zone resistance with high volume. The price is now retesting this area, which also serves as an S/R (Support/Resistance) level. We should closely monitor the reaction of the price at this level.
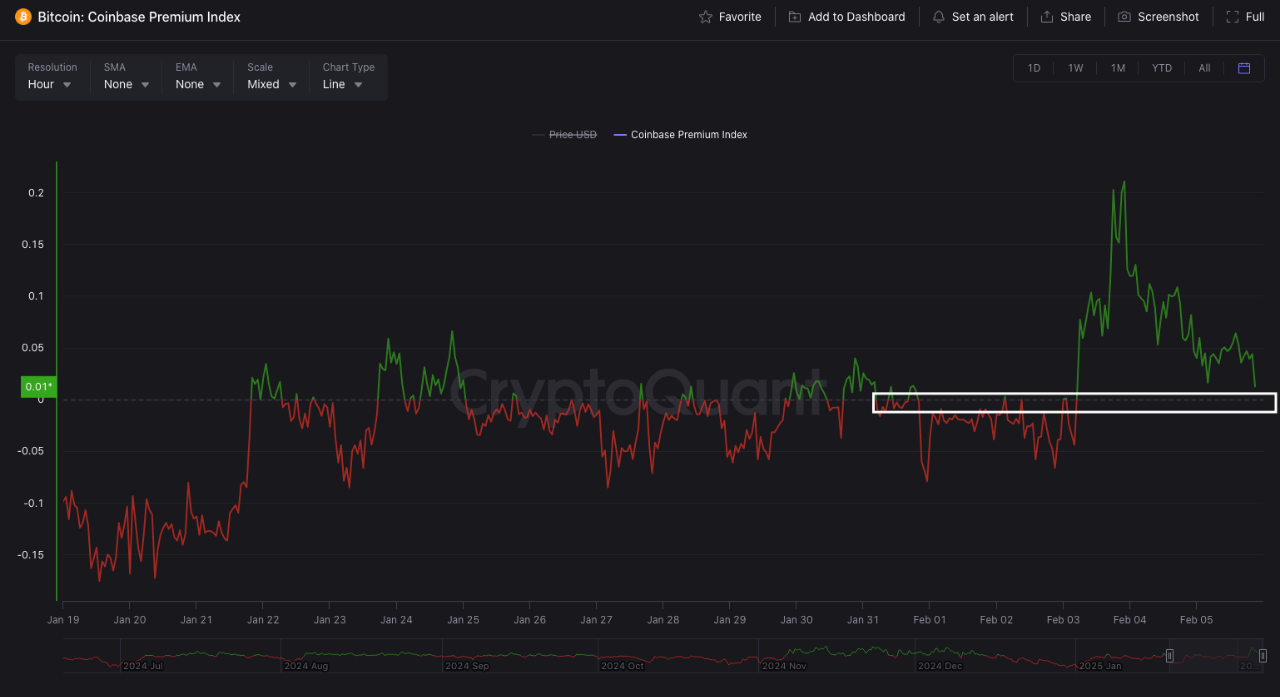

View original →Bullish(Nuanced)BTC
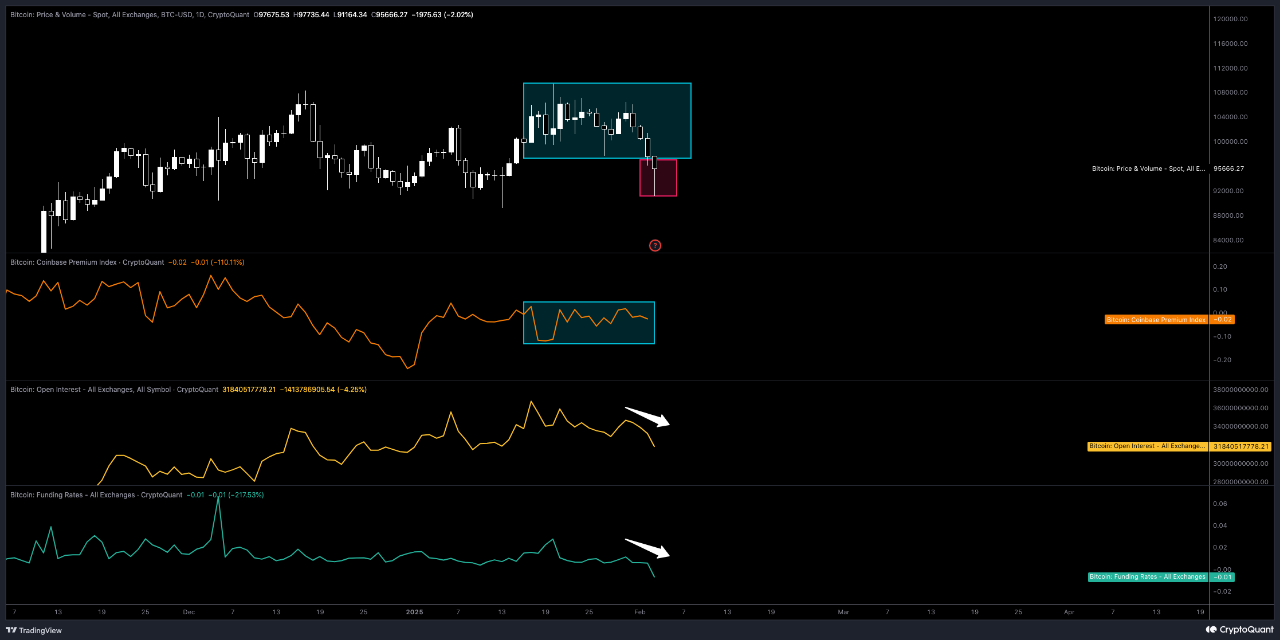
2/3/2025 -The price is dropping below the accumulation structure, meaning support levels are breaking, triggering panic selling in the market.
-The Coinbase premium index is not selling and continues accumulating, indicating that institutional or large investors are not selling but rather continuing to buy.
-A decline in open interest (a reduction in the number of open positions) shows that forced liquidations (stop-outs) are occurring, meaning leveraged positions are being closed.
-A drop in funding rates suggests that market participants are taking short positions (betting on a price decrease) and that bearish sentiment is increasing.
-This situation can be interpreted as small investors being stopped out and removed from the market while large players continue accumulating during the dip. It is a classic case of market manipulation or a "whales' accumulation phase."

View original →Bearish(Nuanced)BTC
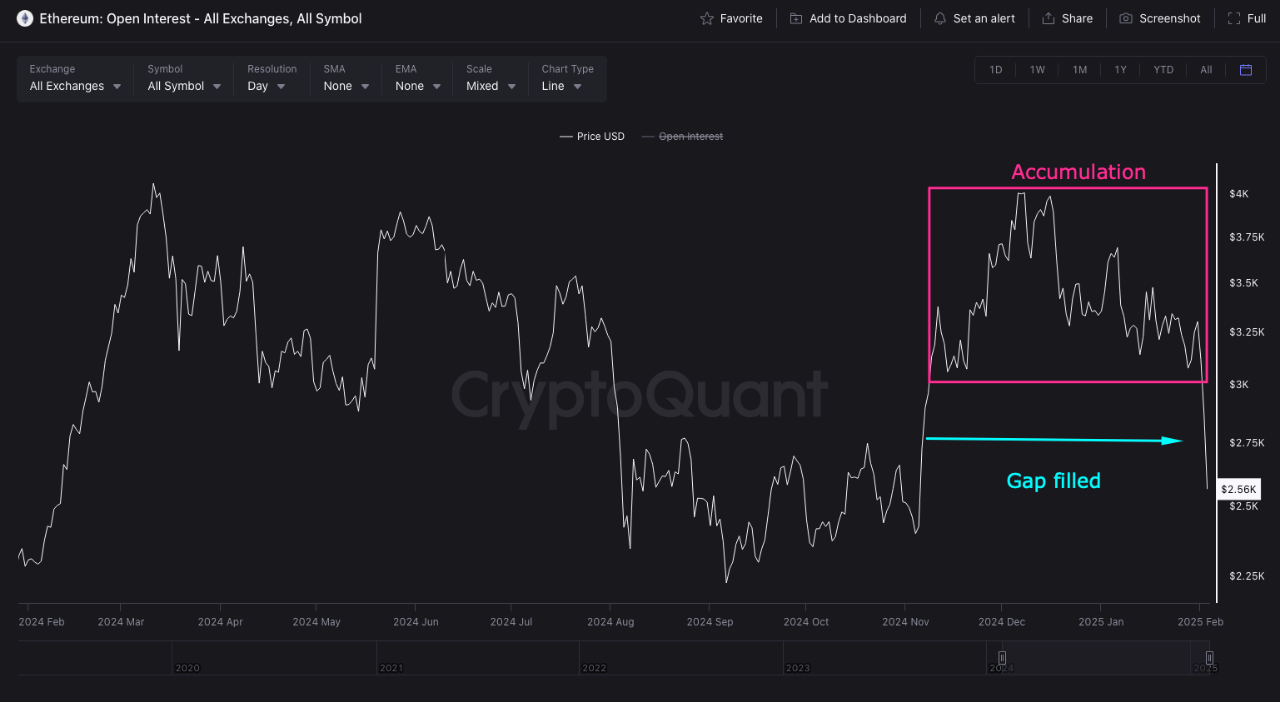
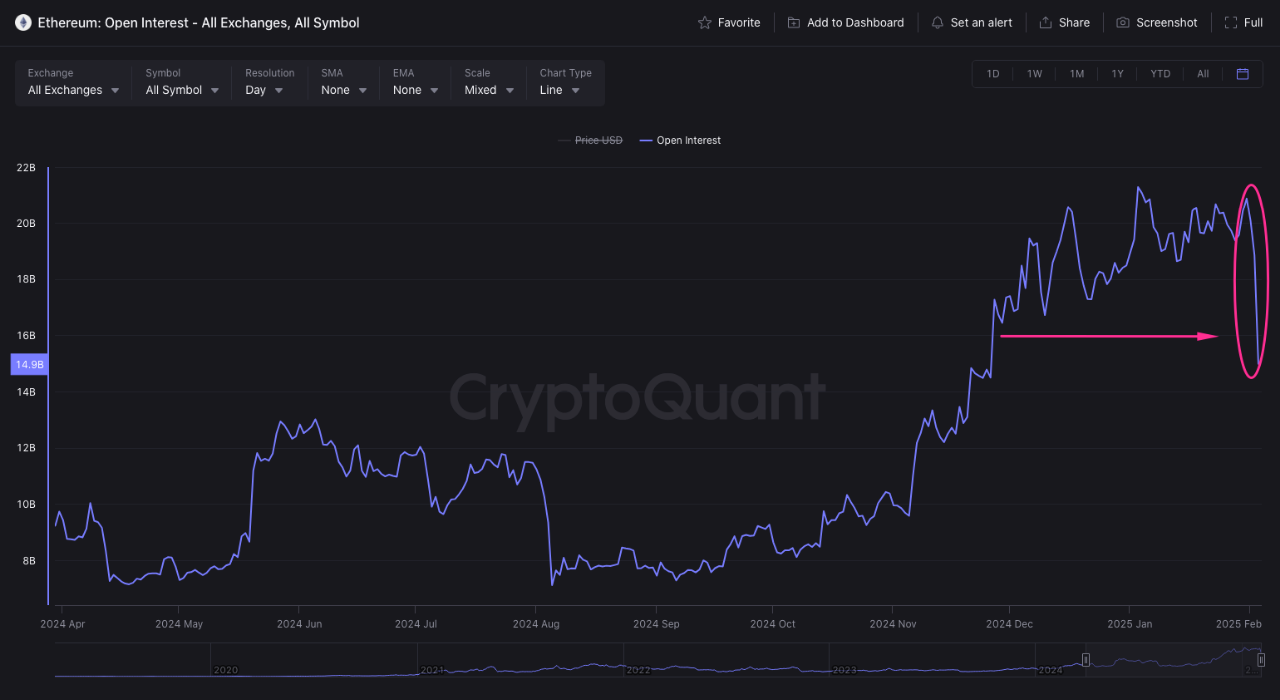
2/3/2025 In the analysis I conducted 5 days ago, I mentioned the Gap zone beneath us. As you can see, the gap zone has been filled. All players in the accumulation zone have been liquidated.
We can see that players have been sidelined due to the decline in the open interest indicator. If we can break above the market breakdown zone, it will be positive.
Funding rates were declining but have now started to rise. I believe that those expecting an upward move will be manipulated one last time.
The Coinbase Premium Index indicator failed to break the '0' resistance. For the market to enter an uptrend, this level must be broken.
As a result, I expect a short-term accumulation in the current region. After that, I anticipate an upward move following a liquidity hunt.
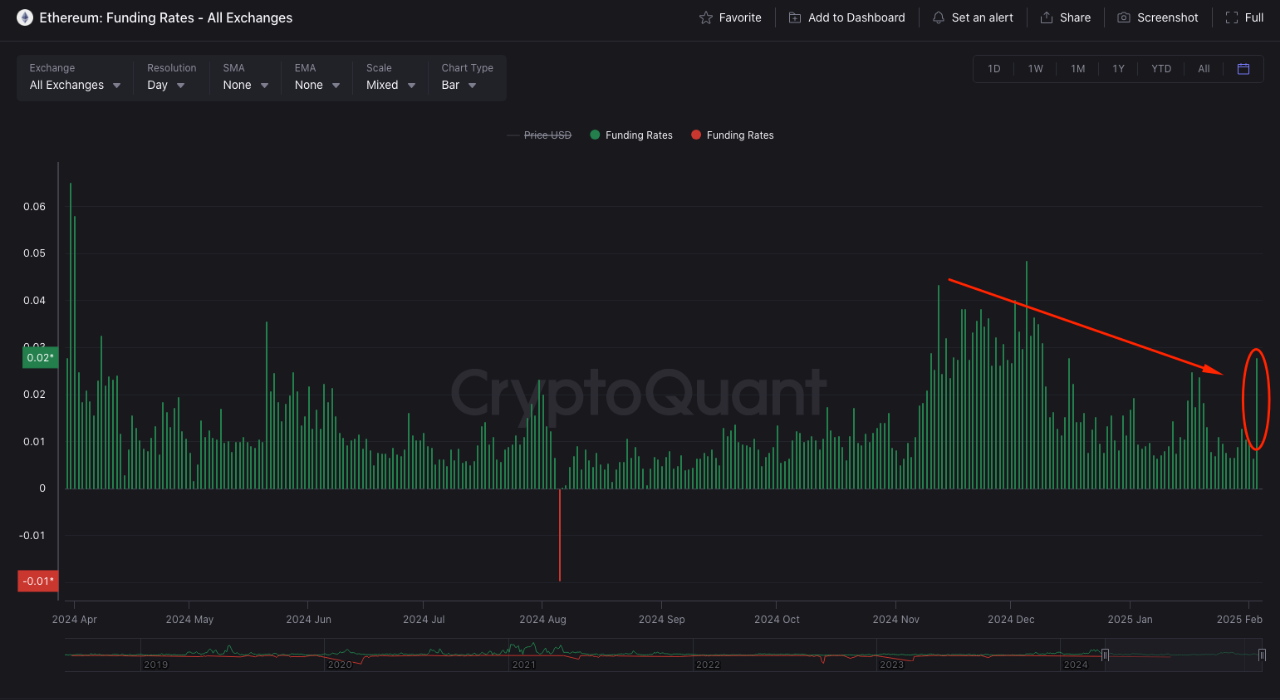
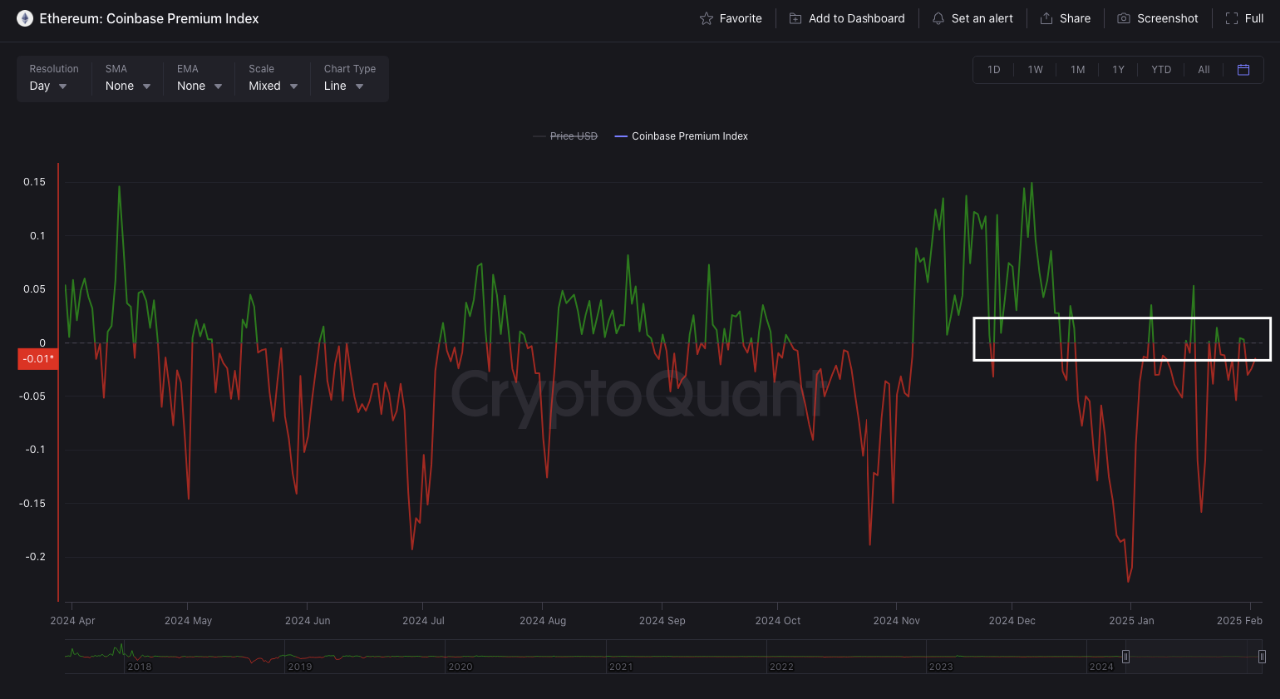

View original →The price is exhibiting sideways movements and undergoing an accumulation phase.
While the price is in the accumulation phase, I am monitoring the Open Interest indicator and observing that new positions are being opened.
To determine the direction of these newly opened positions, I am checking the Funding Rates indicator. I notice that traders are opening short positions.
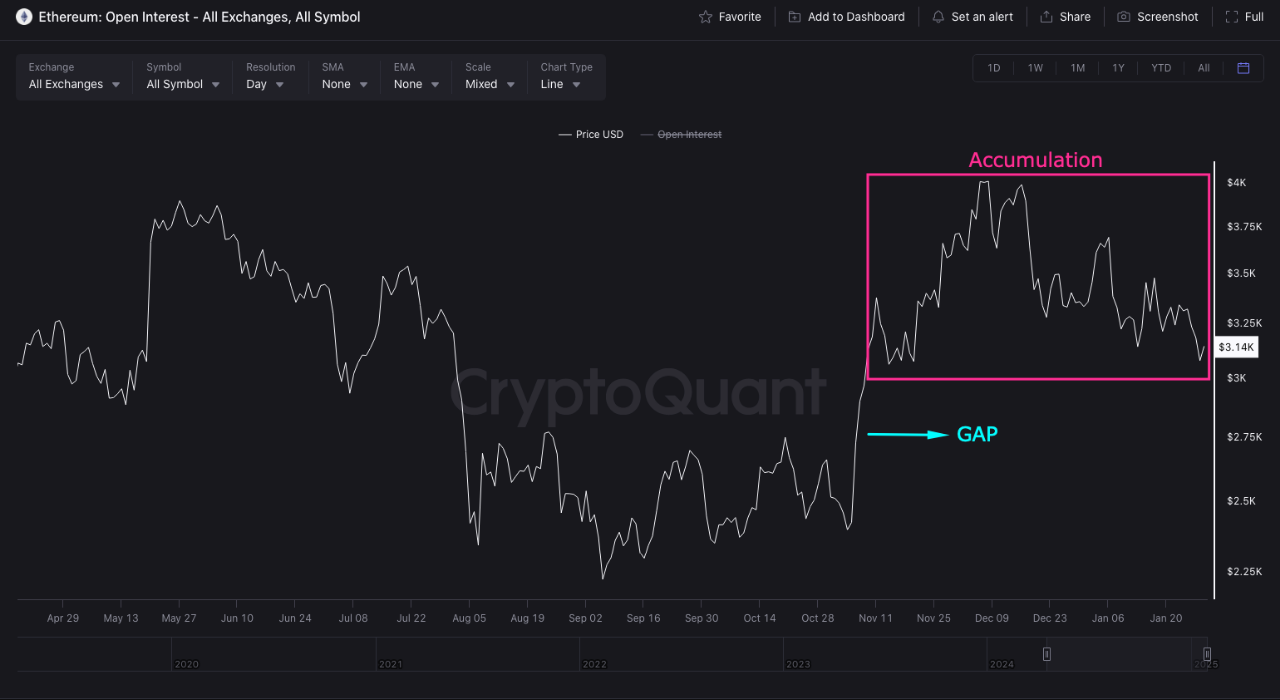
There is a Gap zone below the range structure of the price. After a drop into this Gap zone, a high level of liquidity will be formed. Traders who opened short positions will be caught off guard. I believe the safest area for a bullish move is the Gap zone.

View original →Bullish(Nuanced)1/24/2025
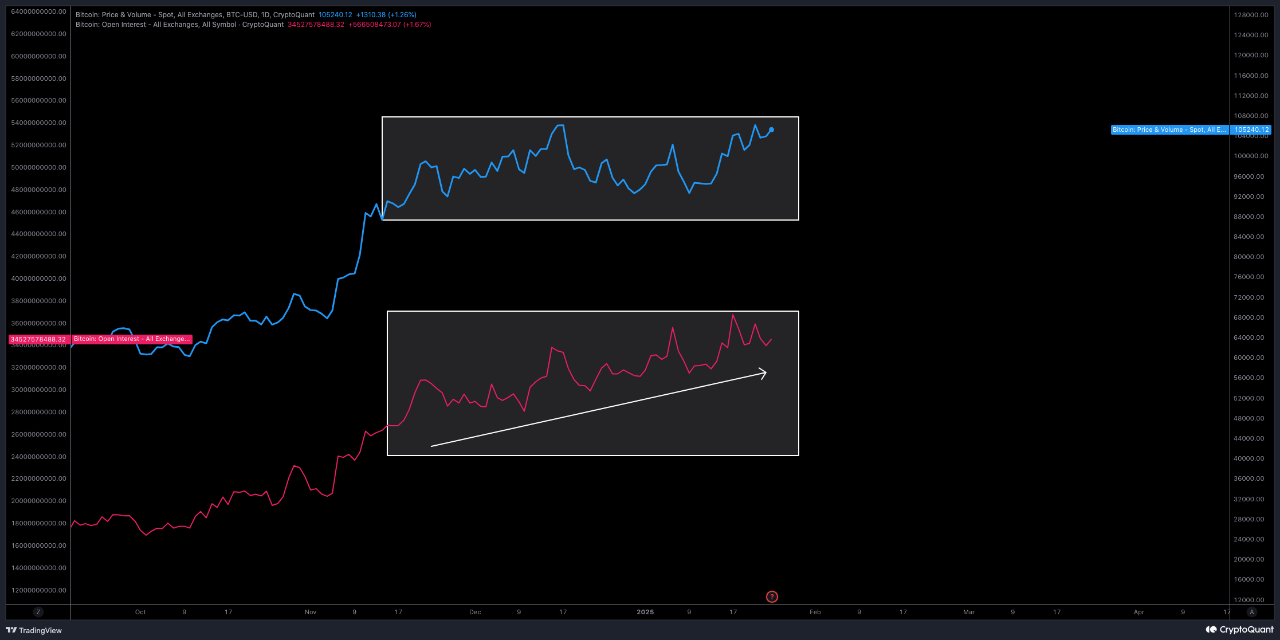
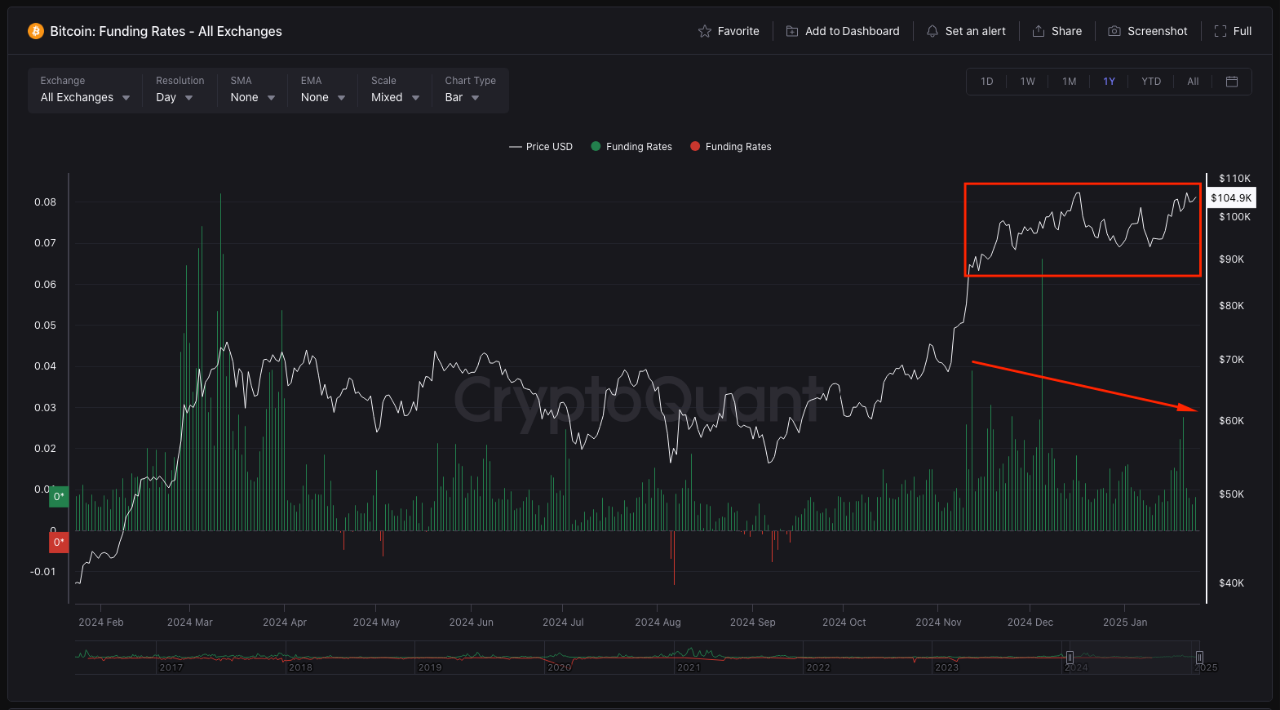
I'm looking at the price over a large time frame and noticing a horizontal accumulatio
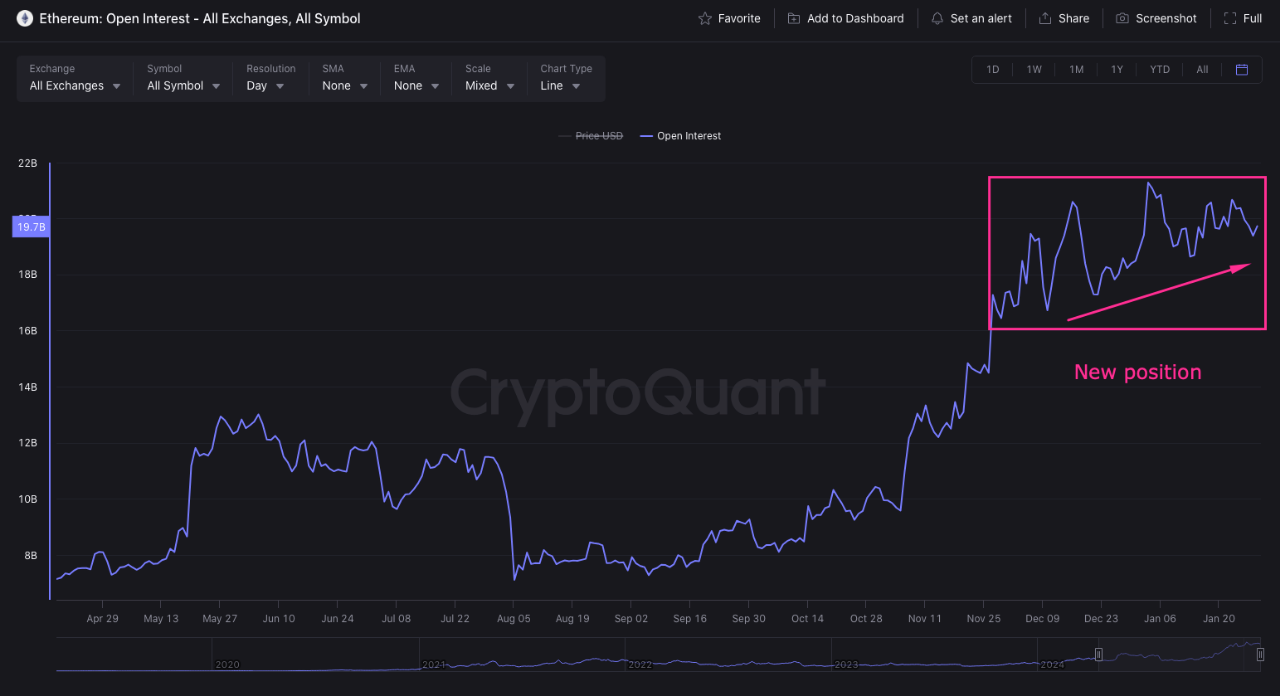
Looking at the Open Interest indicator, I see that new positions are being opened.
This means that while the price is moving sideways, new positions are being opened, as indicated by the rising Open Interest.
To determine the direction of these new positions, I analyze the Funding Rates indicshort positions.
As a result, I expect the market to first target short liquidity. After this liquidity sweep, for a healthy upward movement, we should wait for Funding Rates to turn negative.

View original →

