Recent on-chain data clearly indicate that Binance-driven selling pressure is leading the current market decline.
Three major indicators—Coinbase Premium, Funding Rate, and Taker Buy/Sell Ratio—are all showing consistent signals that point to this trend.
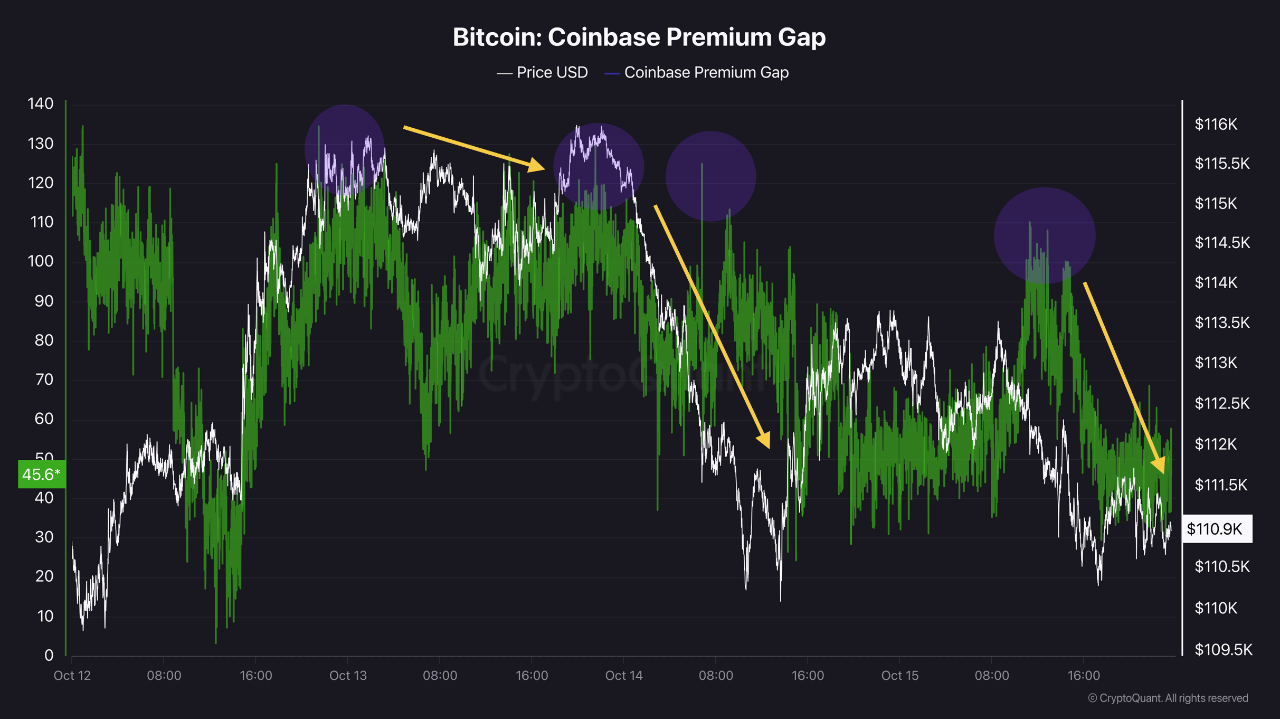
First, the Coinbase Premium has remained at a relatively high positive level, yet Bitcoin’s price continues to fall. Normally, a positive premium suggests stronger buying activity on Coinbase, but in this case, the opposite is true.
This pattern implies that the selling pressure from Binance is outweighing the buying interest from U.S. investors.
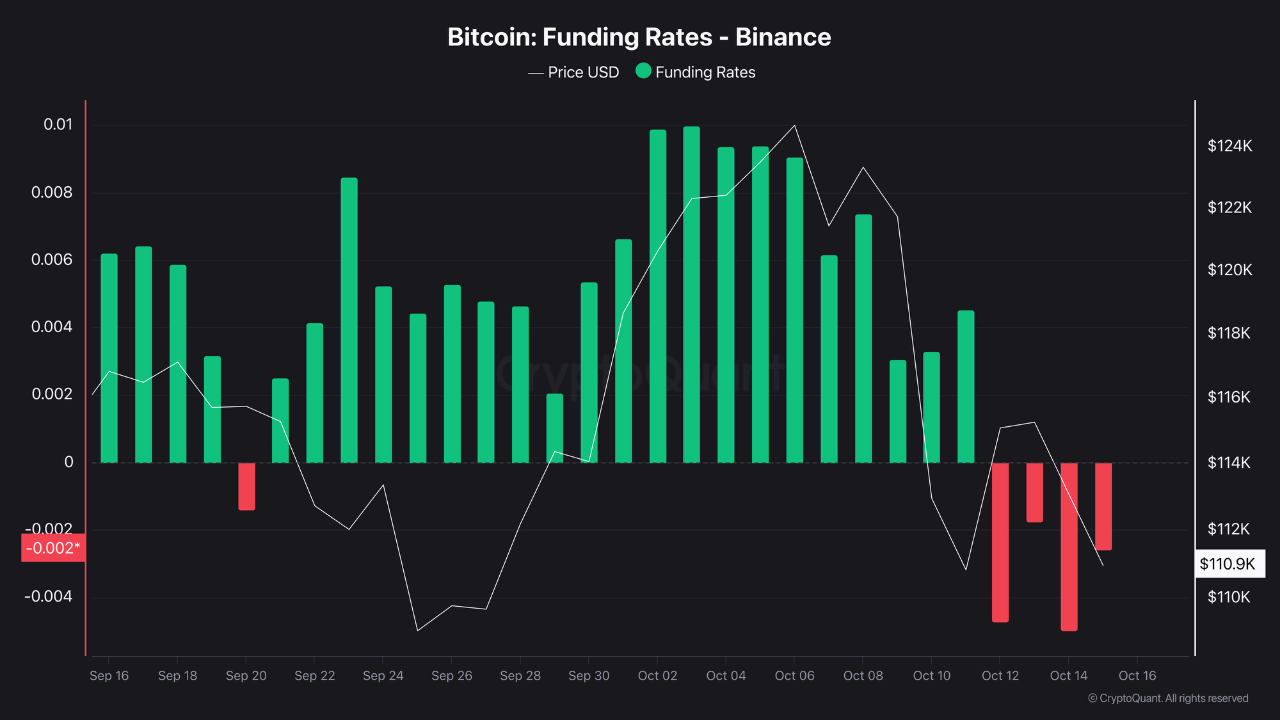
Second, the Funding Rate, which reflects investor sentiment in the futures market, shows an interesting divergence. While most exchanges maintain positive funding rates, Binance has recorded four consecutive days of negative funding.
This signals that traders on Binance futures are increasingly positioning for a short-term downside move.
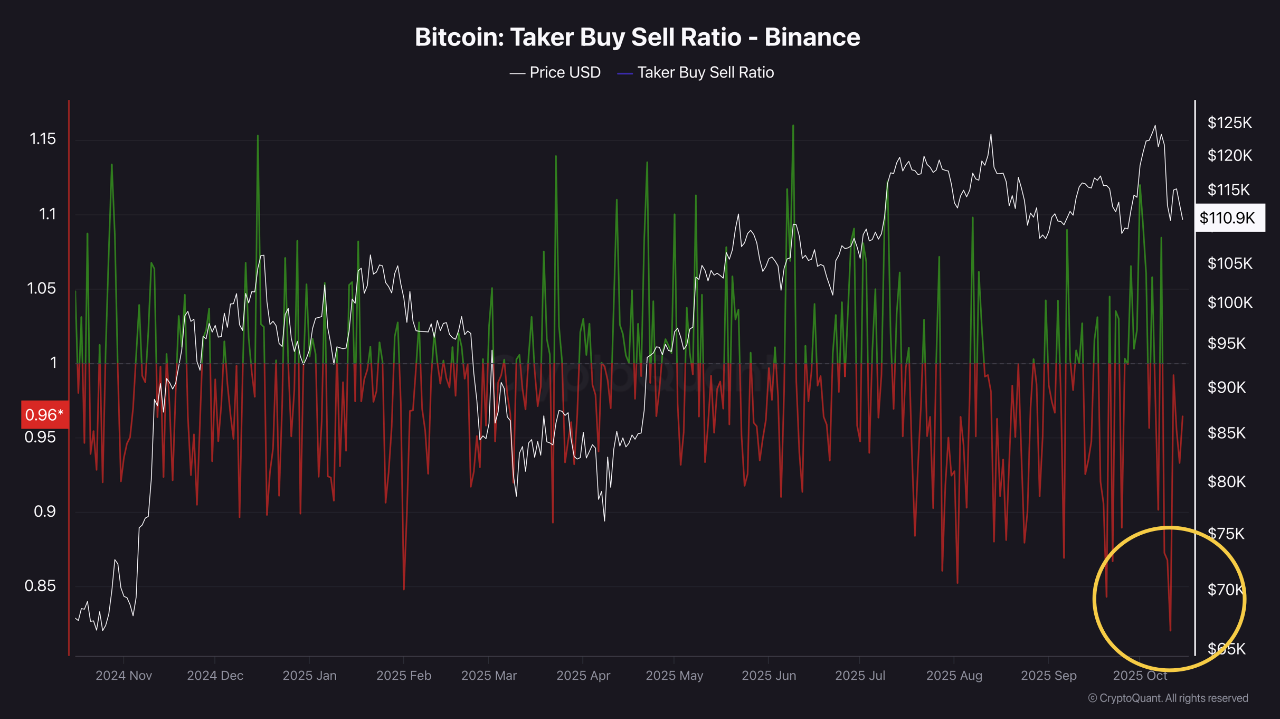
Lastly, the Taker Buy/Sell Ratio—a measure of market order flows—has dropped to its lowest point in over a year, indicating a surge in aggressive selling activity.
Taken together, these data points suggest that the recent Bitcoin correction has been largely driven by Binance-based traders.
However, this short-term weakness does not necessarily mark the end of the current market cycle. On-chain fundamentals remain resilient, and the broader bullish structure is still intact.
For now, a conservative and observant approach is advised, watching how the market digests this Binance-led correction before making new directional bets.

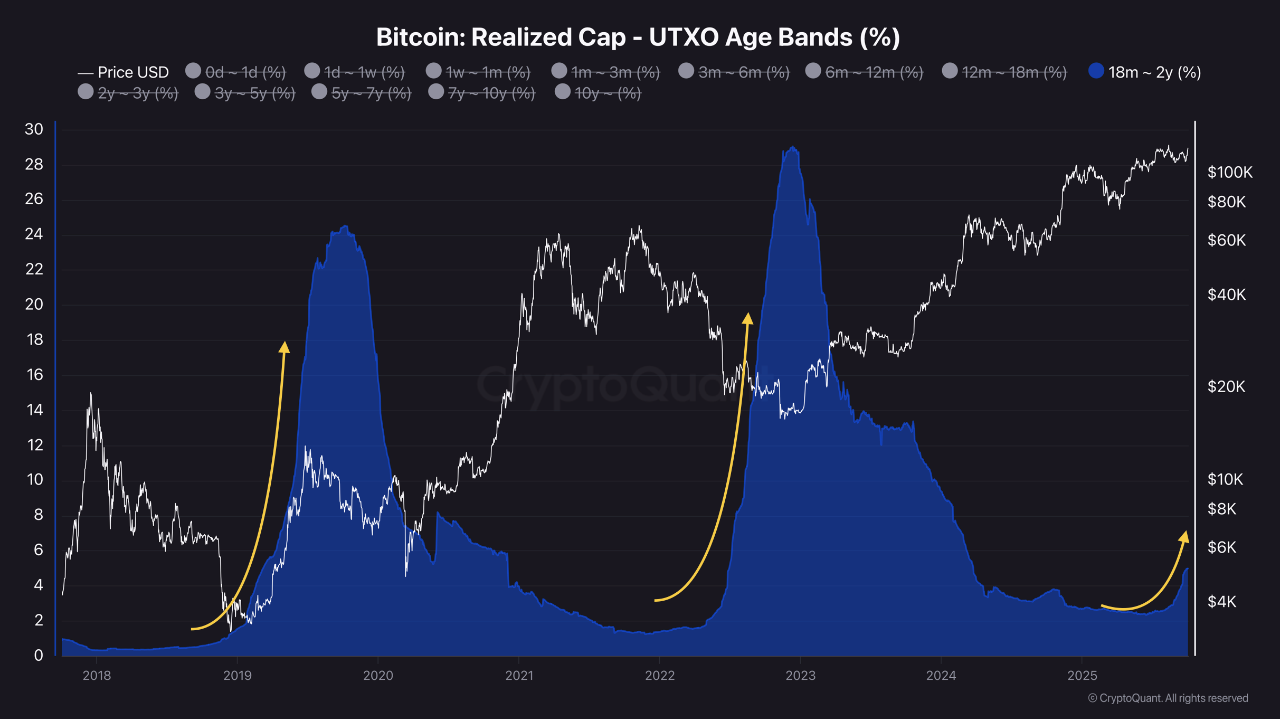
View original →Bitcoin’s recent rebound shows strong momentum, but what stands out even more is the rising share of long-term holders—those who have kept their Bitcoin for 18 months to 2 years.
Historically, these investors held onto their coins through bear markets, waiting for the next bull cycle. Interestingly, their holding period closely aligns with the approval of the spot Bitcoin ETF in January 2024, a milestone that marked Bitcoin’s entry into traditional finance. This suggests that their decision to hold was not simply a matter of enduring downturns, but a strategic move grounded in growing confidence following structural changes in the market.
As Bitcoin continues to consolidate and move upward, the increasing proportion of these long-term holders indicates a shift in strategy—from passive endurance to active conviction in Bitcoin’s long-term uptrend.
If this trend continues, it signals that more investors are not just holding because of past conditions but are deliberately positioning for long-term growth. This reflects a growing trust in Bitcoin’s sustained bullish trajectory and highlights the increasing maturity of the market.

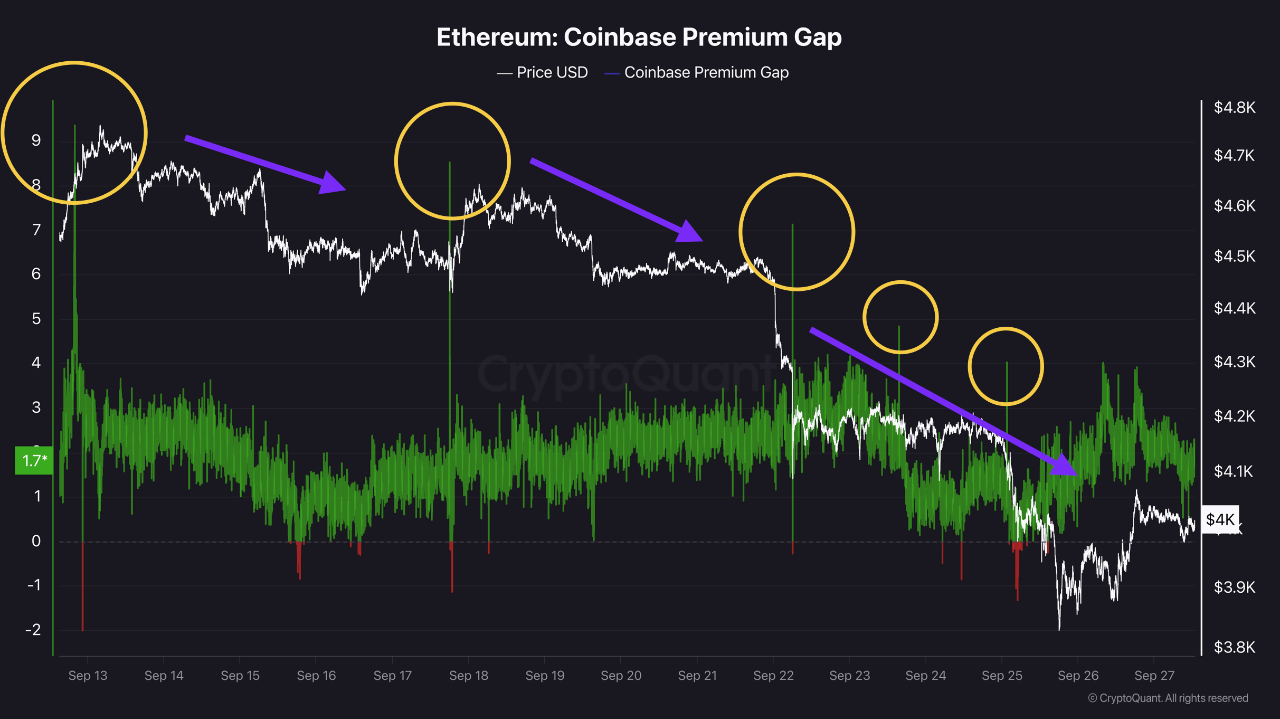
View original →Ethereum’s Coinbase Premium has recently spiked into positive territory, drawing attention from the market. However, despite this increase, Ethereum’s price has continued to decline. The Coinbase Premium measures the price difference between Coinbase and Binance. While a positive premium is often interpreted as stronger buying pressure on Coinbase, the current situation suggests otherwise: **the stronger factor is the selling pressure on Binance**, which has outweighed demand.
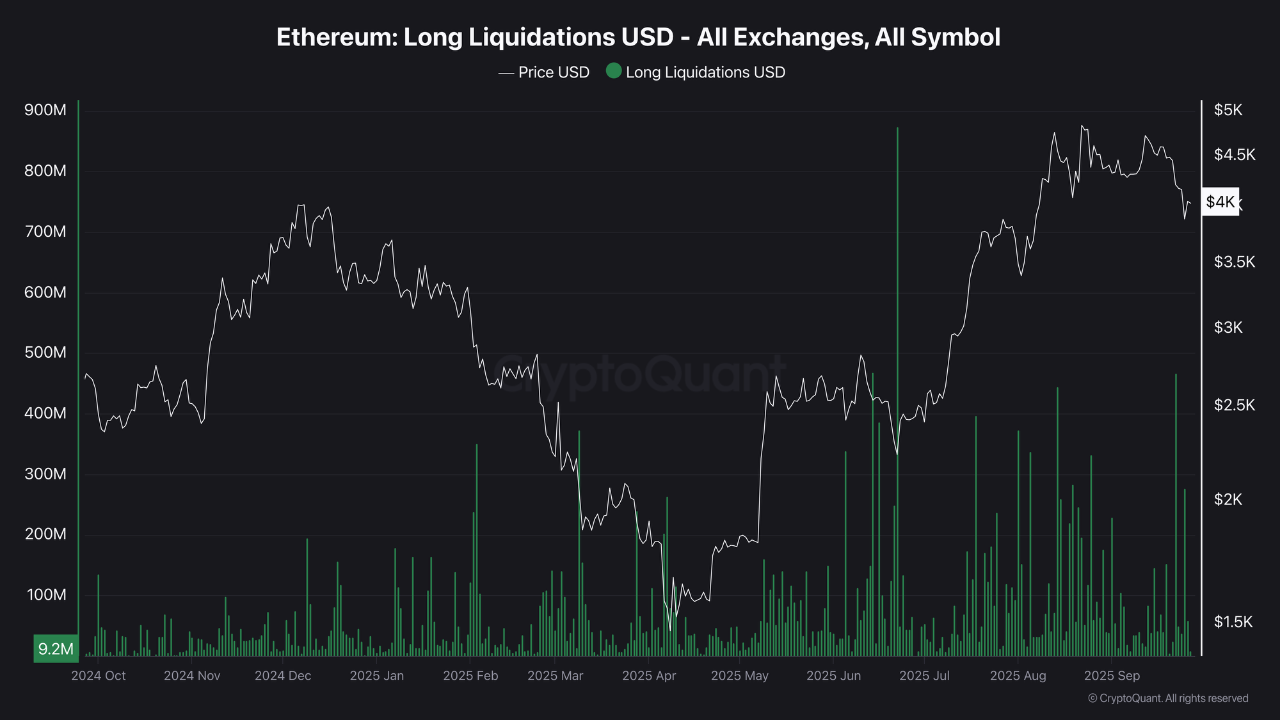
In addition, Ethereum long liquidations have surged, marking the second-highest level in the past year. This indicates that many traders had positioned themselves with a bullish outlook. Yet, markets often move counter to investor sentiment, and this heavy liquidation event signals the potential for short-term weakness or continued correction in Ethereum’s price.
That said, this assessment remains a **short-term perspective**. The cryptocurrency market is known for sudden reversals triggered by unexpected catalysts. Therefore, investors should remain cautious, avoiding both excessive optimism and undue pessimism, while continuing to track market flows closely. Ultimately, the broader outlook still underscores the importance of maintaining a balanced, medium- to long-term perspective.

View original →Recent on-chain data highlights a structural shift in miner behavior and the growing resilience of the Bitcoin network.
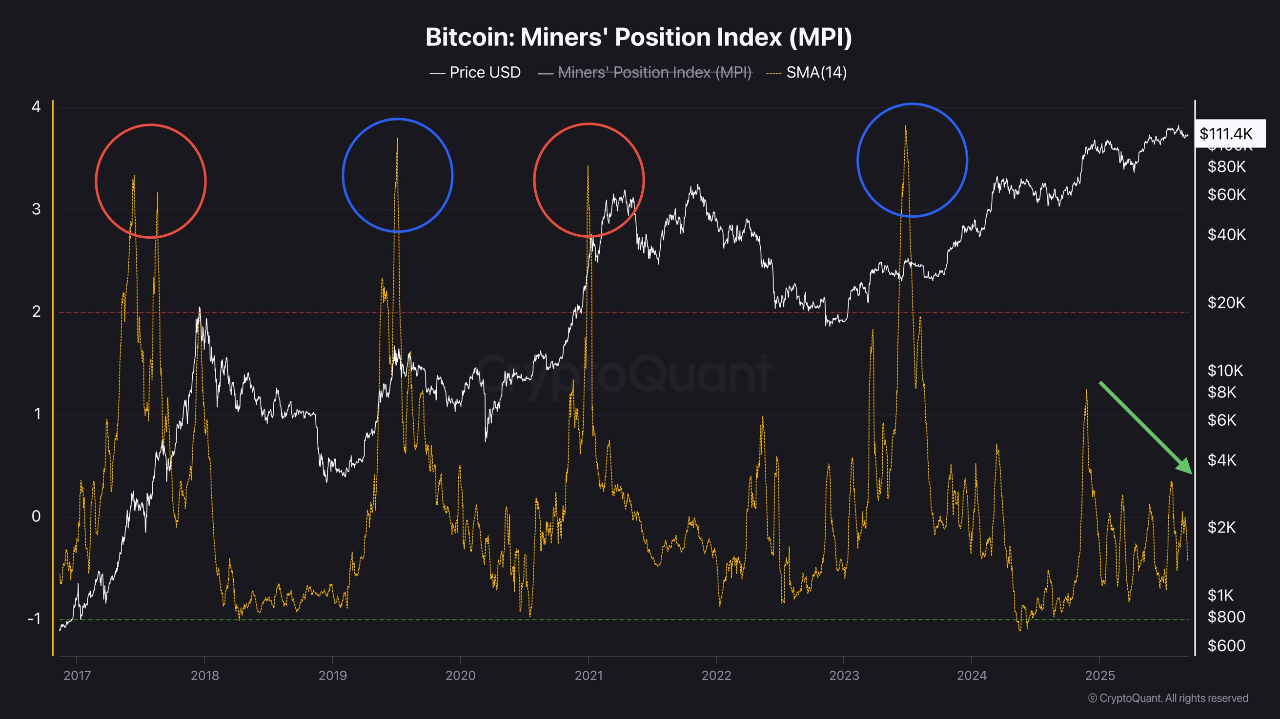
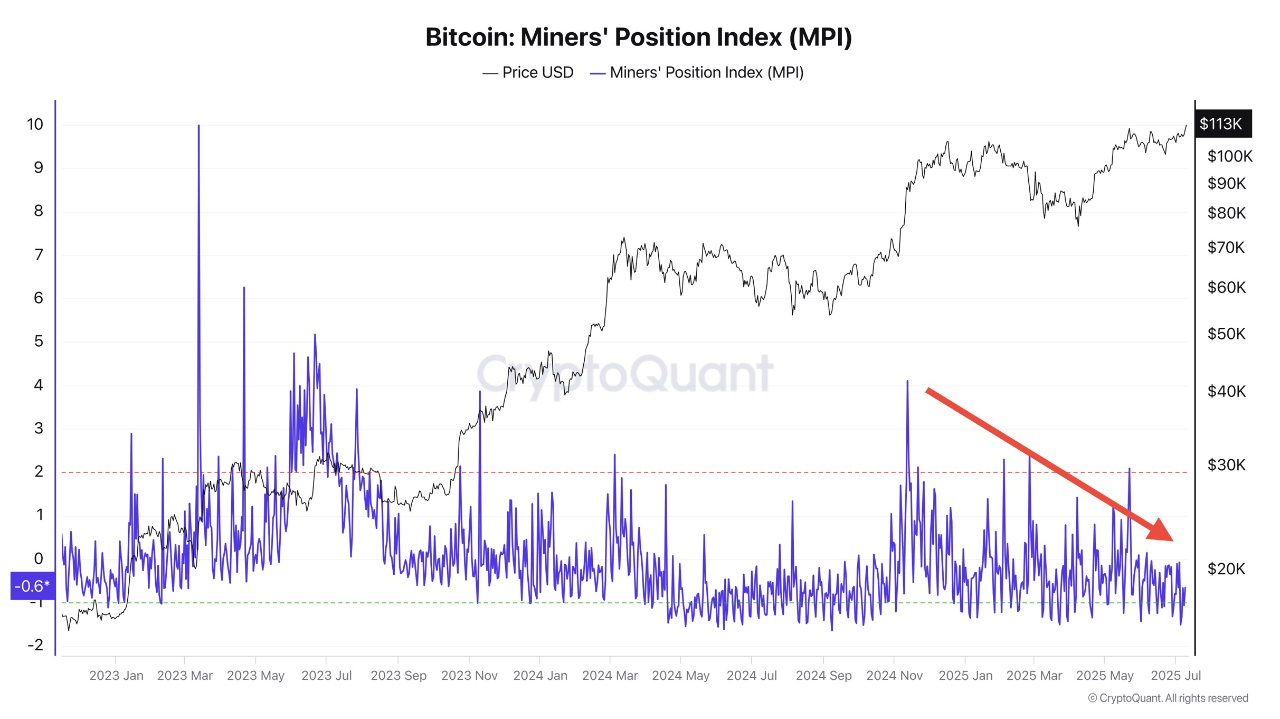
Looking at the Miners’ Position Index (MPI), sharp increases have historically occurred in two scenarios: ahead of a halving, when miners strategically offload holdings, and in the late stages of a bull market, when they sell heavily into new retail inflows. The current cycle, however, shows a different trend. While some pre-halving selling is evident, the aggressive late-cycle sell-offs are absent. This suggests that ETF approvals and the adoption of Bitcoin as a strategic reserve asset by major economies may be influencing miners’ strategies, shifting them from short-term selling toward long-term accumulation.
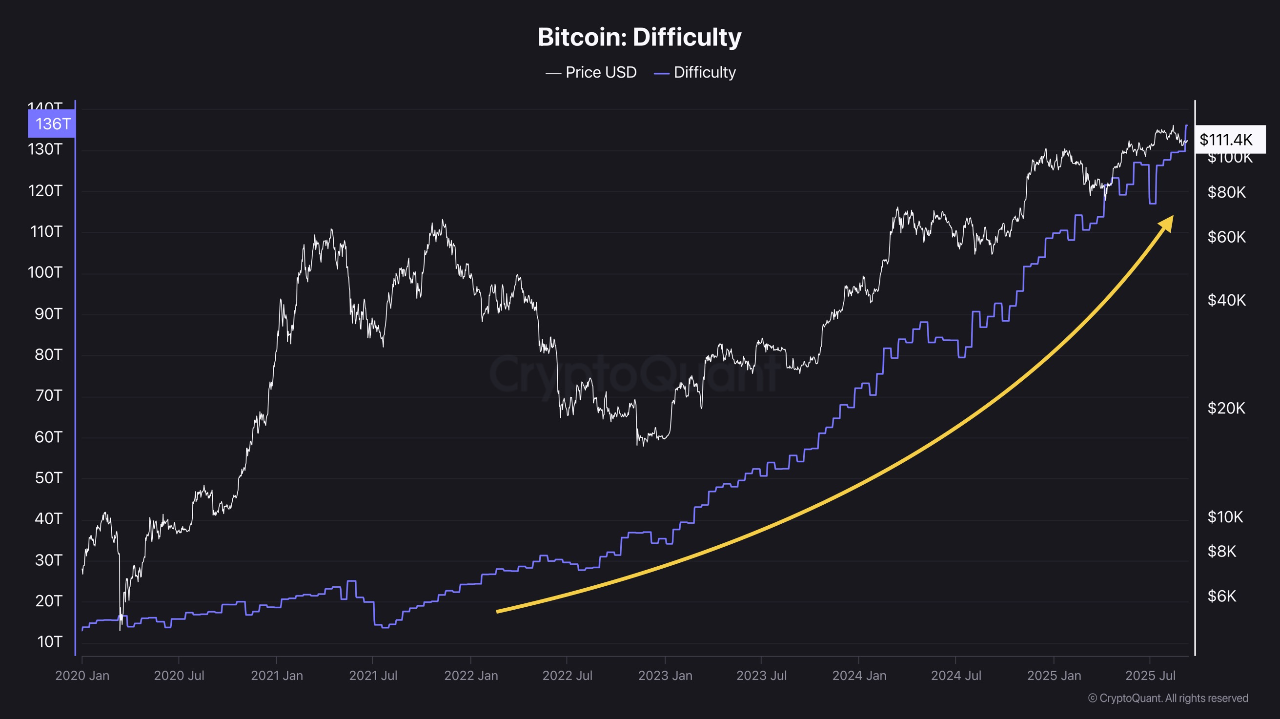
Mining difficulty has also reached an all-time high, with its growth curve forming the so-called “Banana Zone” of sharp increases. This reflects rising participation in the Bitcoin network and reinforces its security and robustness.
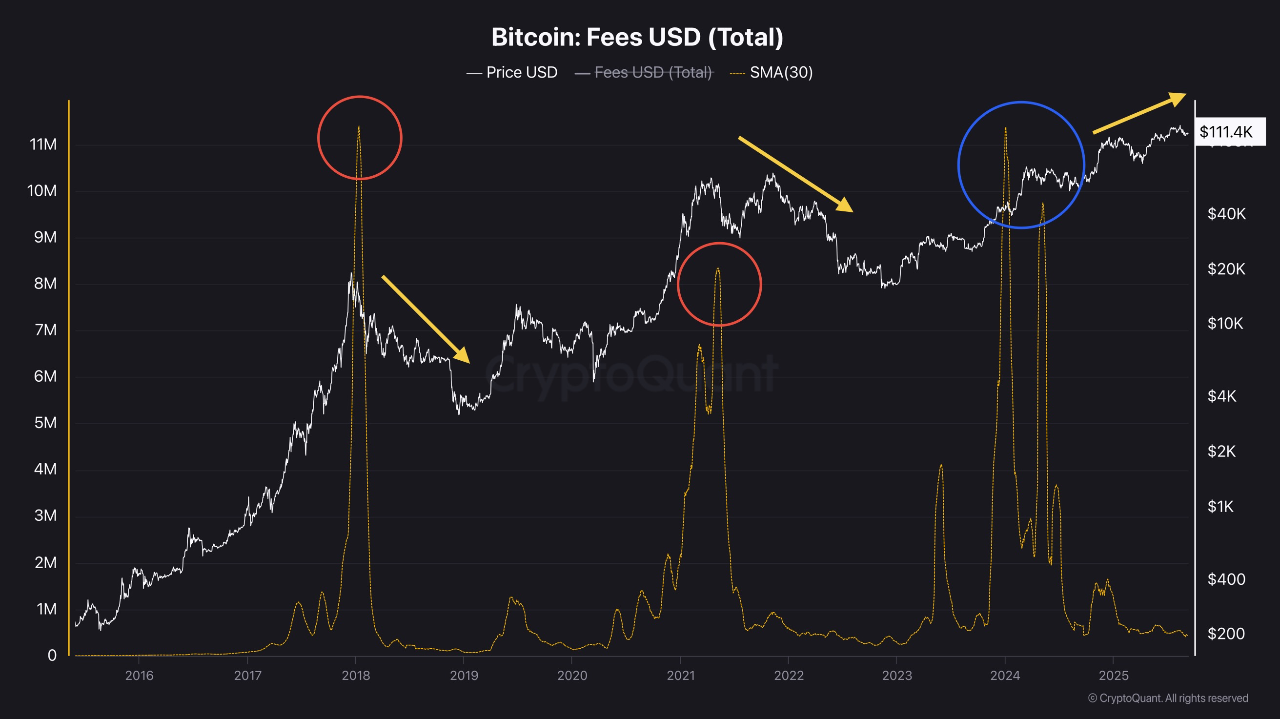
Another key indicator is network transaction fees (measured in USD). In past cycles, sharp spikes in fees typically signaled the late stages of a bull market, often followed by the onset of a bear phase. This time, however, despite fees surging significantly, Bitcoin’s price has continued to climb in a stair-step pattern rather than overheating and collapsing. This shift strongly indicates that miners are leaning toward holding their Bitcoin instead of liquidating into short-term demand.
In summary, the combined signals from MPI, difficulty, and fee metrics reveal a clear departure from past patterns. Miners appear increasingly focused on accumulation, while the network itself grows stronger. Together, these dynamics support a sustained bullish outlook for Bitcoin over the medium to long term.

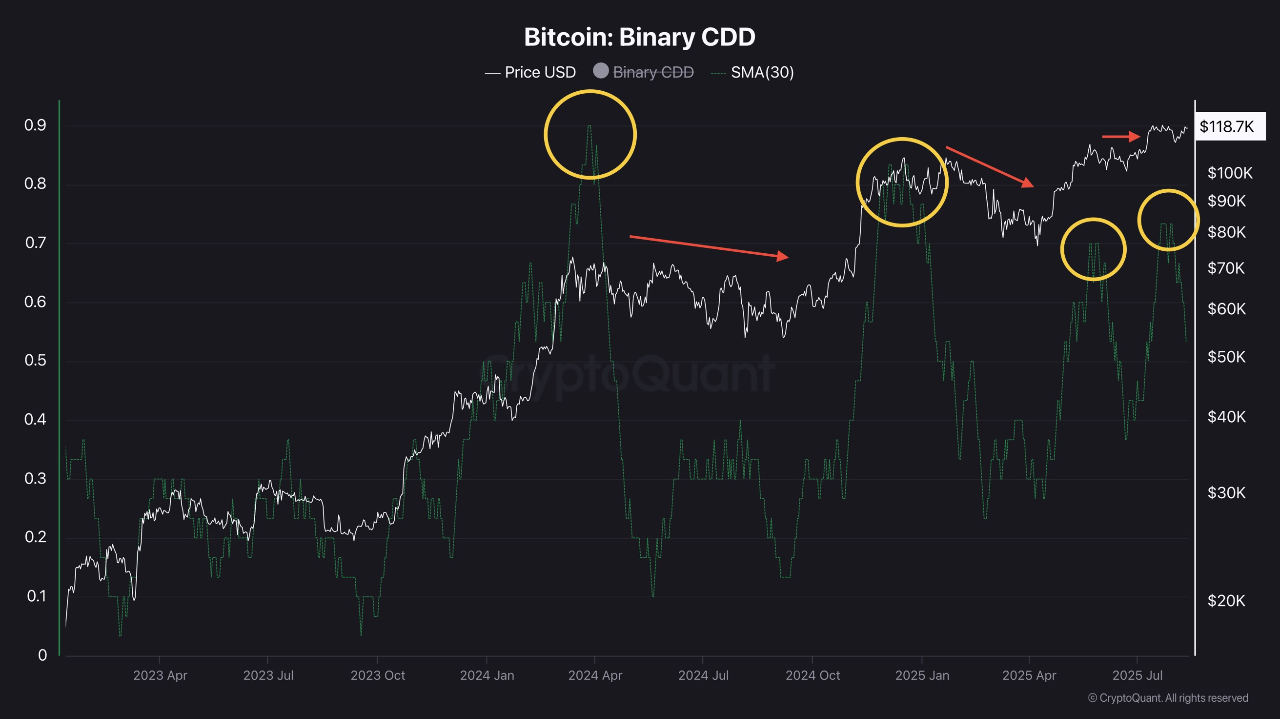
View original →Binary CDD has recently turned down after a brief rise, while Bitcoin’s price remains in a sideways range. Historically, the movement of long-dormant coins often signaled an intention to sell, and a rise in Binary CDD was considered a sign of market overheating. However, in today’s market environment, factors such as changes in custody practices, increased OTC activity, and institutional asset management strategies make it harder to interpret CDD spikes as purely overheating signals.
Recent data shows that after Binary CDD rises, Bitcoin has often moved sideways or experienced a correction for several months. The current trend appears to be a “stair-step” rally — a gradual upward movement that cools off short-term heat while sustaining long-term momentum. This pattern can be healthy for the market, preventing rapid exhaustion of buying power.
In the near term, this sideways-to-gradual-uptrend structure may persist, and traders should closely monitor both Binary CDD fluctuations and price action to gauge trend shifts. Importantly, other on-chain indicators show that long-term holder selling pressure remains limited, supporting the view that Bitcoin retains strong upside potential over the long run.

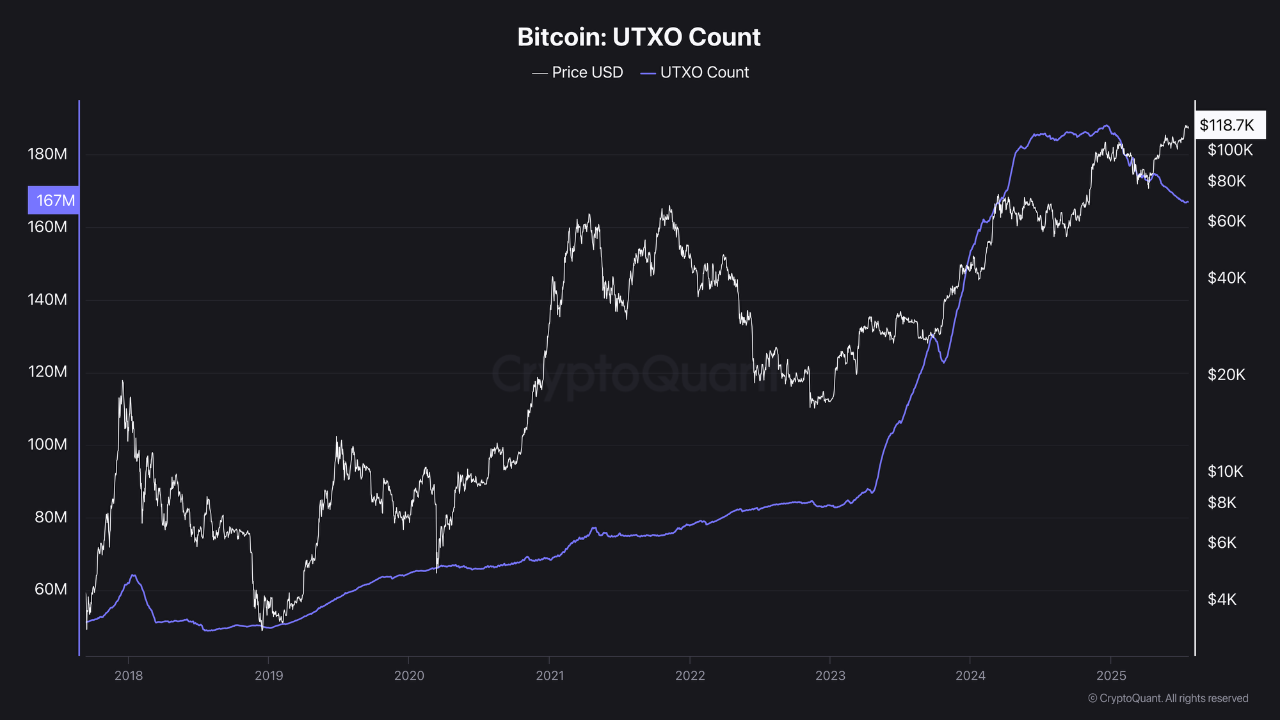
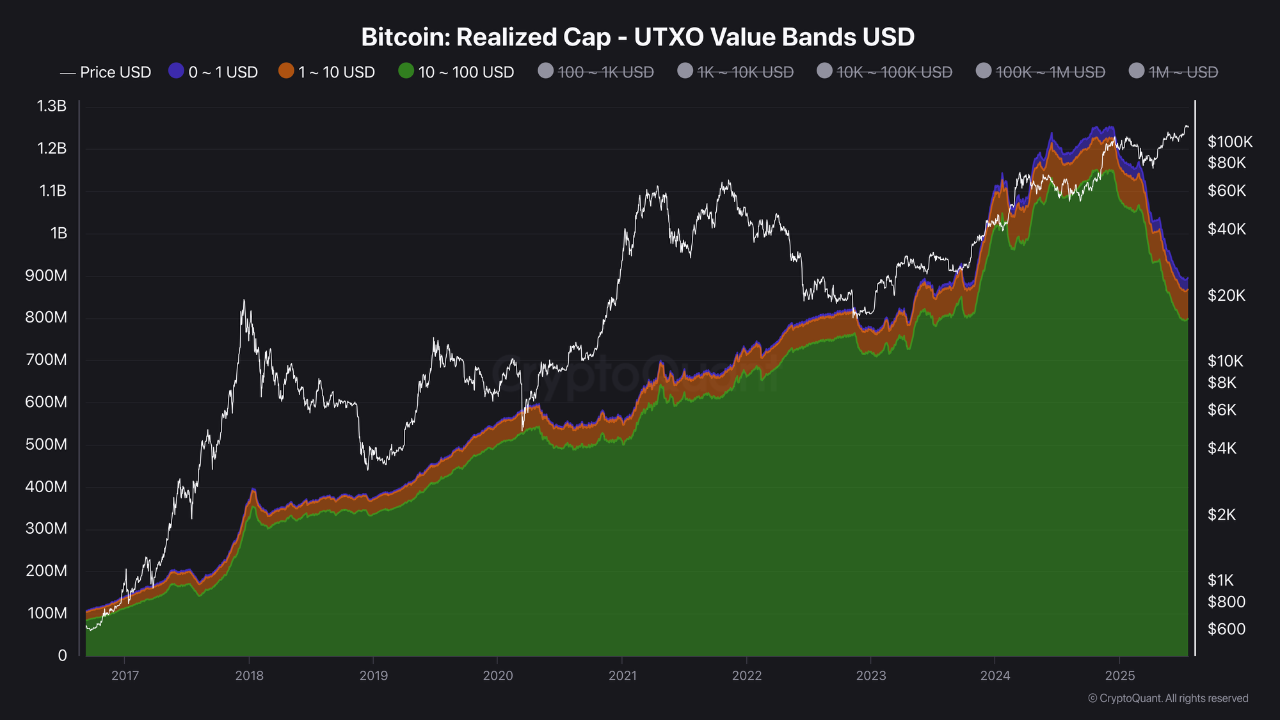
View original →Since December 2024, Bitcoin’s UTXO count has shown a steady decline. This trend is not simply due to lower transaction volumes but is closely tied to wallet restructuring through OTC deals by whales and institutional investors. These entities are consolidating multiple UTXOs into fewer addresses, increasing their custody holdings and reorganizing the on-chain structure toward a “fewer & bigger” model.
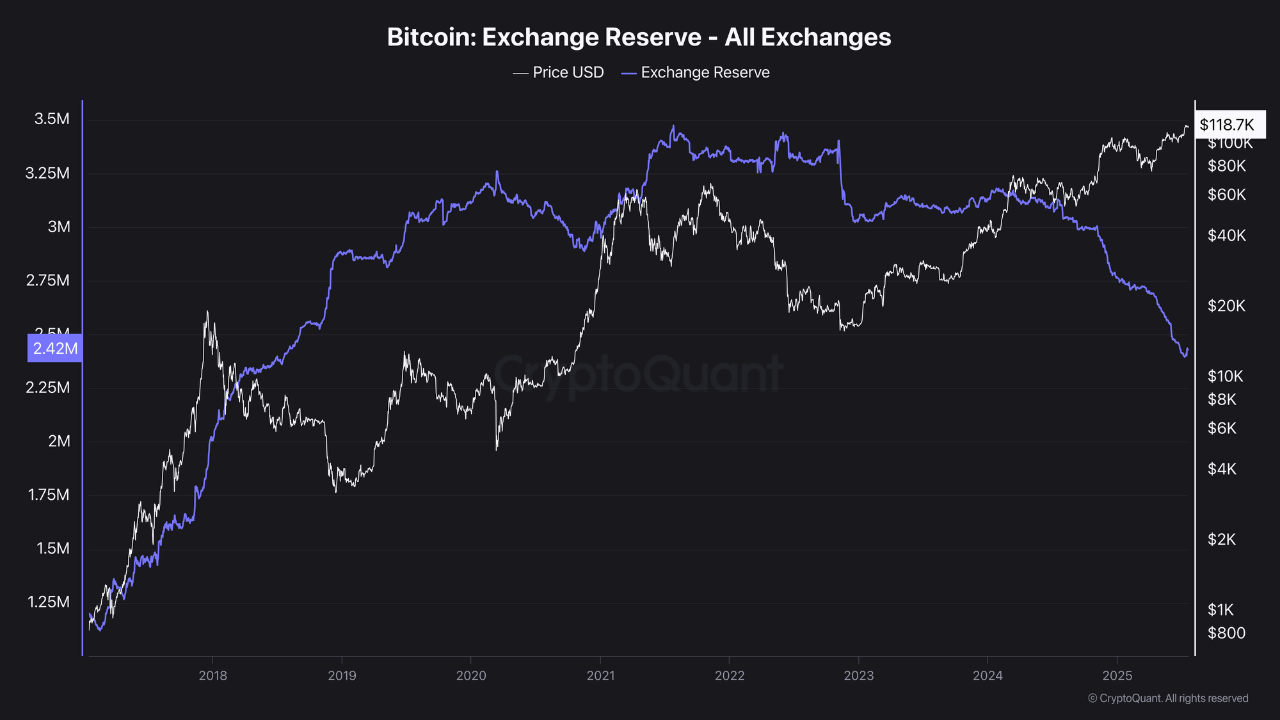
Following the approval of U.S. spot ETFs, institutional demand has continued to grow. However, Bitcoin held on exchanges keeps flowing into custody wallets. This signals that large holders are securing assets away from exchanges for long-term storage, contributing to the ongoing decline in UTXO count.
Retail investor participation also remains muted in this cycle. In previous bullish phases, active retail inflows led to increased UTXO counts through higher transaction volumes. This time, retail inflows are subdued, and the number of newly created UTXOs remains stagnant.
Looking ahead, whales and institutions will likely continue consolidating assets into custody solutions. However, if the market enters a strong bullish phase, increased inflows from short-term investors could lead to a rise in exchange activity and UTXO counts. This could signal more speculative trading, potentially increasing future sell pressure.
Nevertheless, key on-chain indicators still support a positive outlook. Long-term holders continue to accumulate, institutional transfers persist, and exchange inflows remain moderate compared to previous market peaks. These factors suggest Bitcoin retains strong potential for further long-term growth.

View original →Bearish(Nuanced)ETH
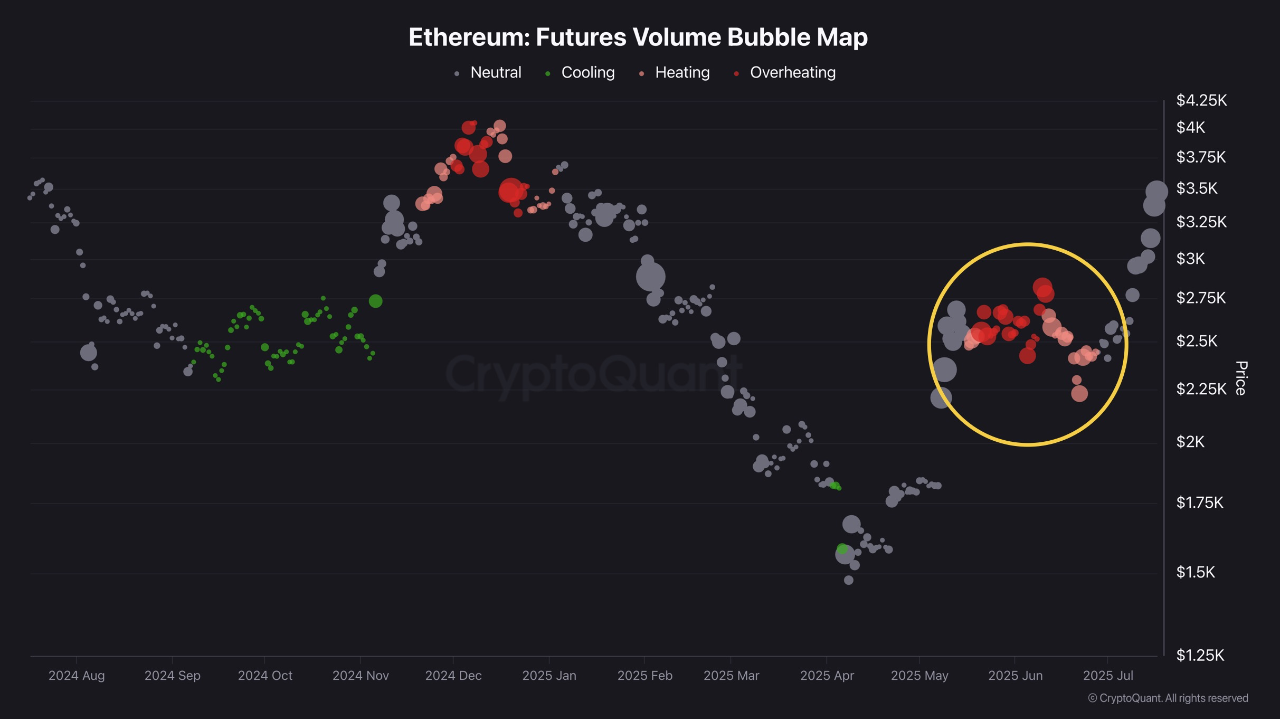
7/18/2025 Ethereum’s recent rally appears to be primarily driven by activity in the futures market.
The Ethereum Futures Volume Bubble Map clearly highlights overheating in the areas marked with yellow circles. During this period, a surge in futures trading volume signaled short-term market overheating, leading to an increase in Ethereum’s price. This suggests that leveraged trading has been the primary catalyst behind the recent upward price movement.
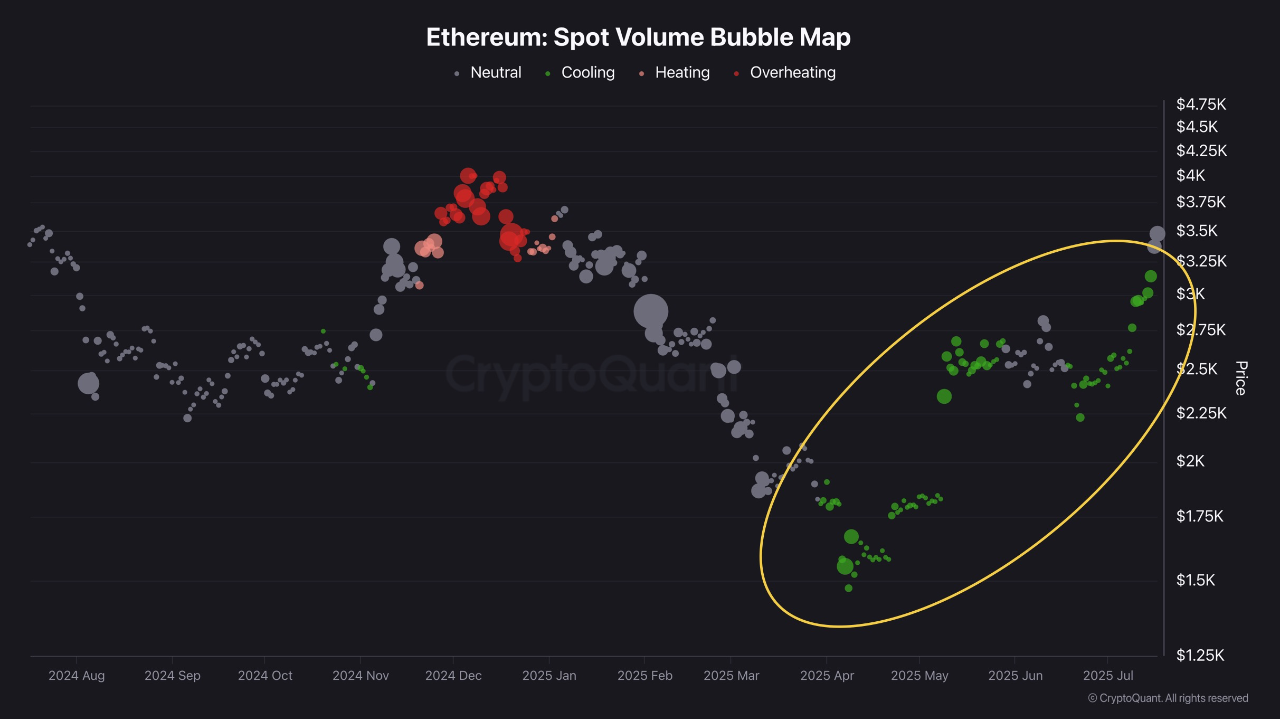
In contrast, the Ethereum Spot Volume Bubble Map presents a different picture. Despite the sharp price rise, spot volume has remained relatively stable without signs of overheating, indicating a cooling phase. This reflects the current absence of significant spot market buying pressure. Should spot demand increase going forward, it could further support Ethereum’s upward momentum.
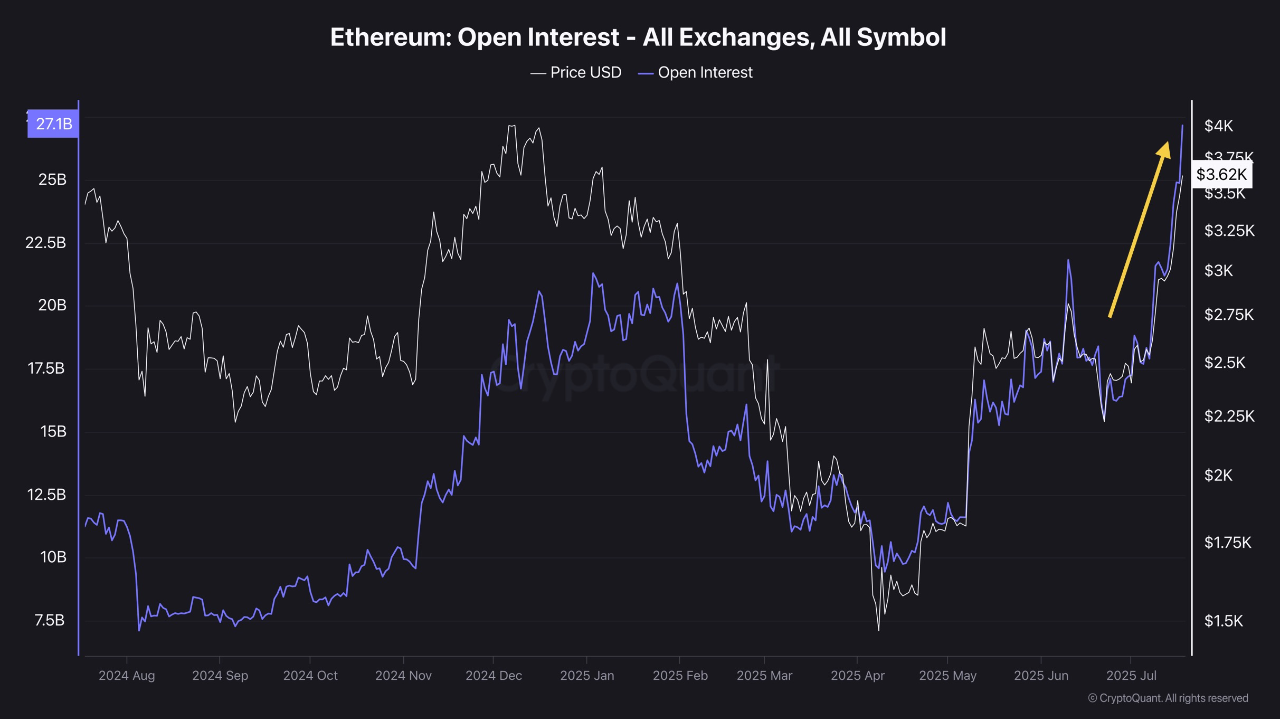
Additionally, Ethereum Open Interest (OI) has surged to reach new all-time highs. This reinforces the view that the futures market is currently the key driver behind Ethereum’s price action.
In summary, Ethereum’s current rally is being led by the futures market. The key question now is whether this speculative momentum will transition into genuine demand from the spot market. If spot buying accelerates, Ethereum’s rally could broaden into a wider altcoin market surge. Therefore, investors should carefully monitor not only futures market dynamics but also signs of increasing spot demand.

View original →Bearish(Nuanced)BTC
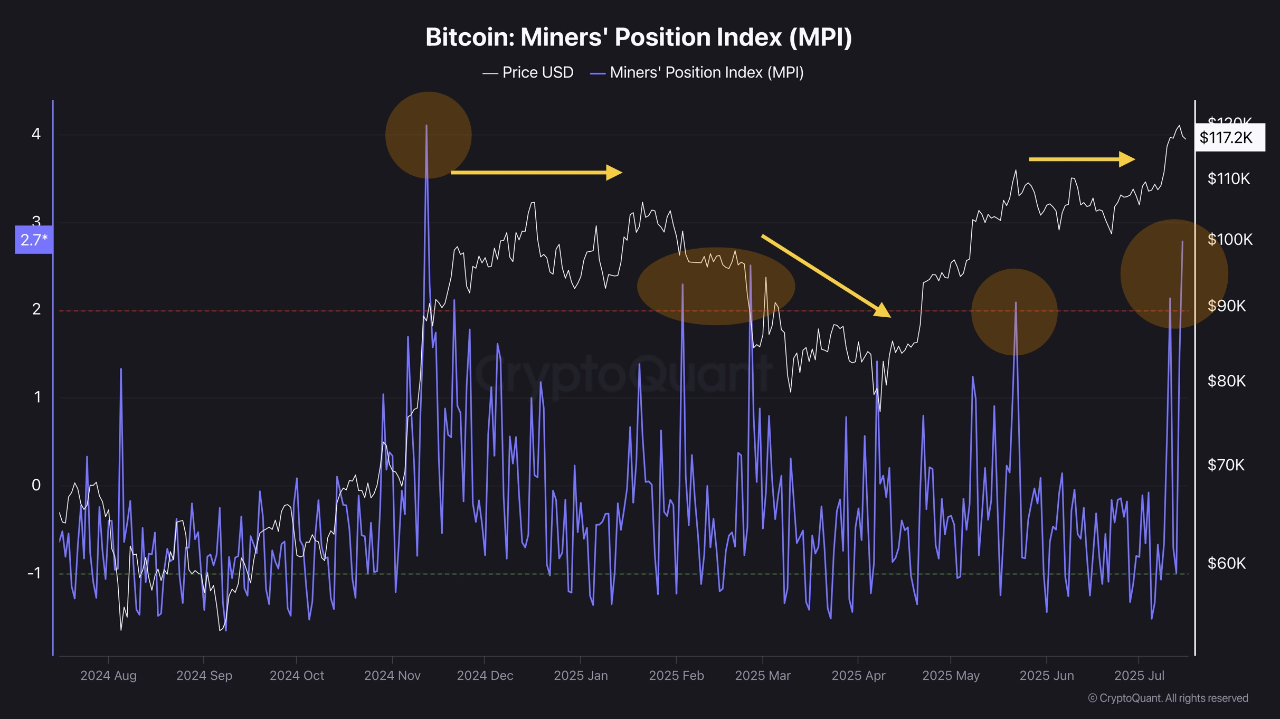
7/16/2025 The Miners’ Position Index (MPI) has recently surged above 2.7. This index reflects the volume of Bitcoin miners are withdrawing compared to their 1-year average. A high MPI indicates that miners are transferring more coins to exchanges than usual, potentially adding some short-term selling pressure to the market.
While this spike in MPI suggests the possibility of short-term correction or sideways price action, it remains far below the extreme levels typically observed at the end of previous bull cycles. This movement appears to align with the recurring intra-cycle pattern of “correction followed by further upside,” which Bitcoin has demonstrated in recent months.
It is also worth monitoring whether this miner behavior will prove to be a one-off event or develop into a more sustained wave of selling pressure. Should continuous miner outflows persist, further short-term corrections could occur.
Nevertheless, the mid-to-long-term bullish outlook for Bitcoin remains intact. Long-term investors should stay focused on their strategies without being swayed by temporary market fluctuations. With supportive macroeconomic trends and strong underlying fundamentals, Bitcoin’s price is likely to continue its upward trajectory over time.

View original →Bullish(Nuanced)BTC
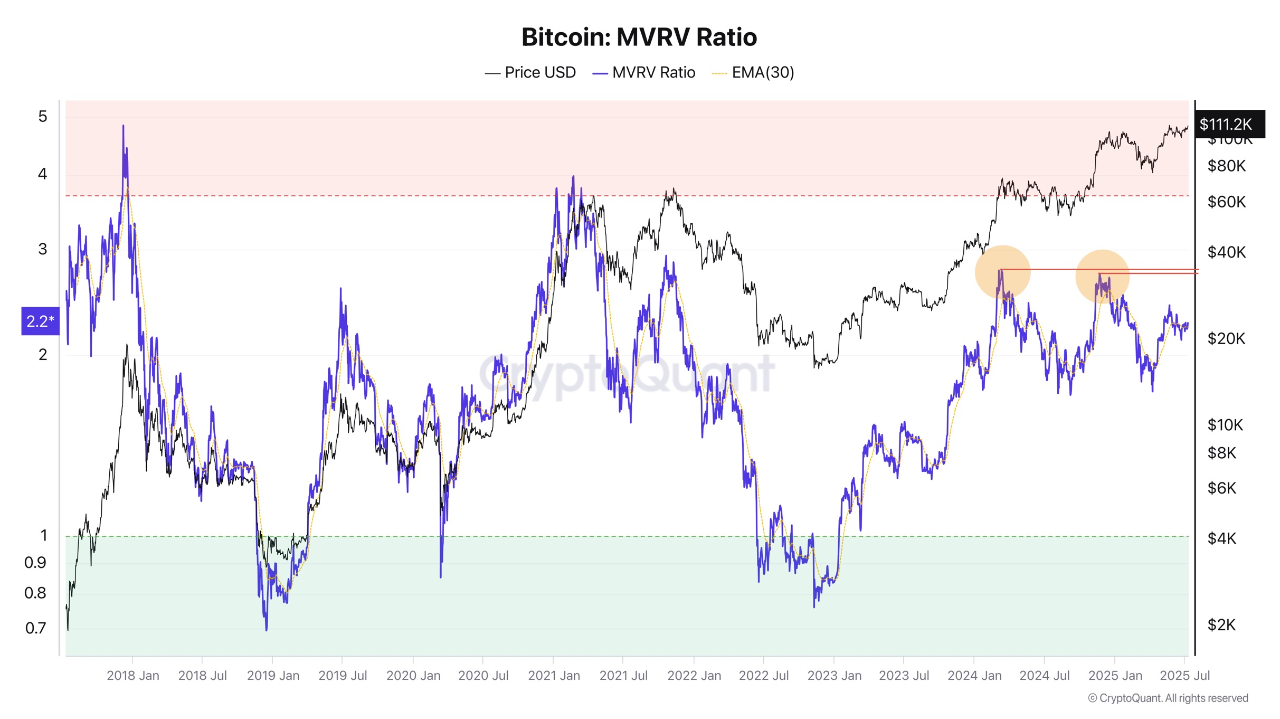
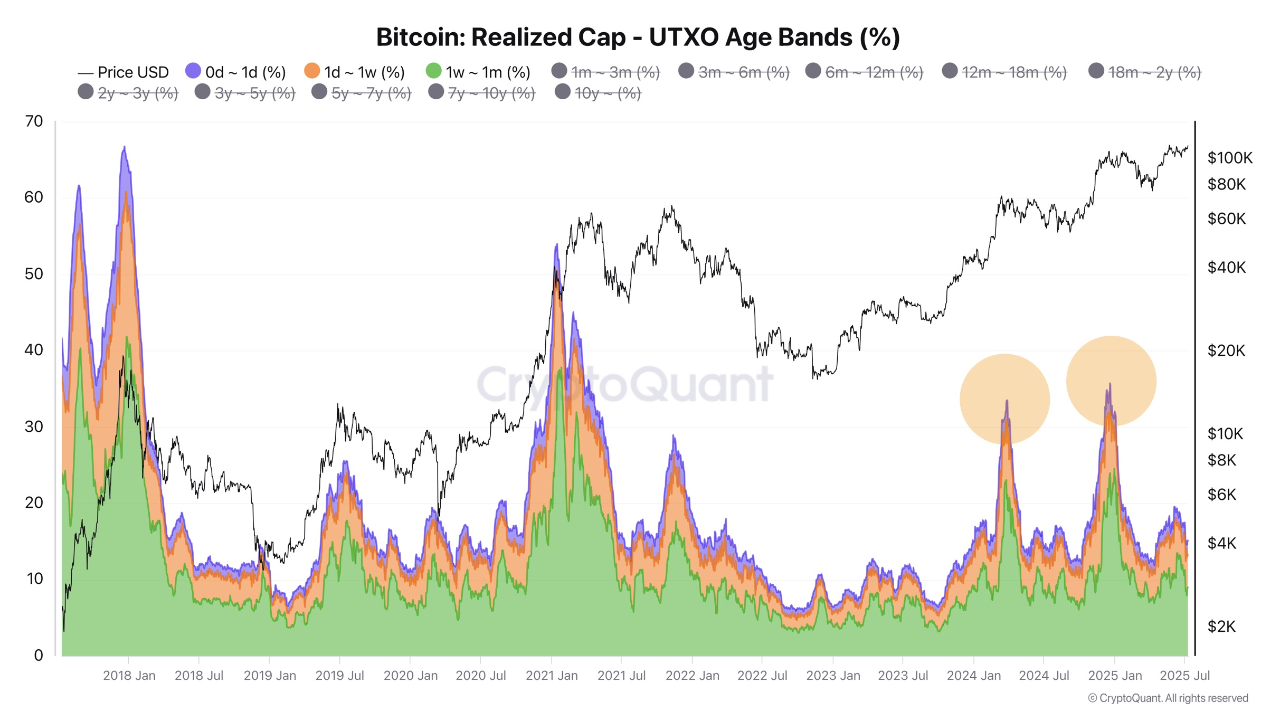
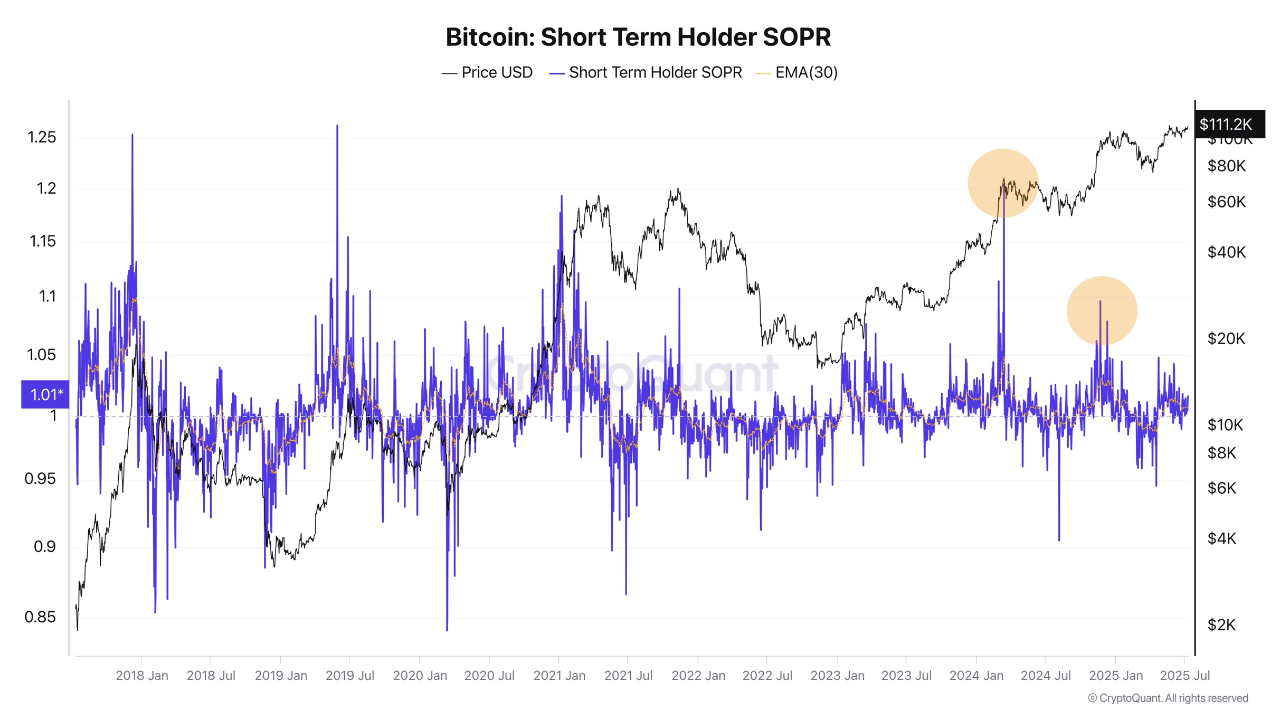
7/10/2025 Bitcoin has reached a new all-time high, but the overall sentiment and market dynamics this time are strikingly different from previous peaks. This shift is clearly reflected in various on-chain indicators.
During the previous all-time highs in March and December 2024, the MVRV ratio exceeded 2.7. In contrast, the current high is accompanied by a much more moderate level of 2.2, indicating a lack of excessive market speculation.
UTXO data also shows a limited inflow of new investors. While short-term holders (under 1 month) accounted for around 30% during the previous peaks, that number has now fallen to just 15%. This suggests that new capital inflow into the market remains weak.
Accordingly, the Short-Term Holder SOPR does not show signs of aggressive profit-taking, indicating minimal sell pressure from short-term investors.
The Miner Position Index (MPI) is also on a downward trend, showing only limited selling activity. Notably, there is a growing trend of mining firms strategically accumulating Bitcoin rather than liquidating their holdings.
In previous cycles, bull markets often ended as spot and derivatives investors rushed in, leading to widespread distribution. But this cycle appears to be driven by different forces, including strategic adoption by nation-states and corporations, suggesting a structurally different growth path.
As a result, analyzing on-chain data today requires deeper and more contextual interpretation, rather than relying solely on repetitive historical patterns.
Because this recent breakout to a new high occurred without signs of overheating, there is solid potential for further price appreciation in the mid-to-long term.

View original →Bullish(Nuanced)BTC
6/23/2025 Bitcoin’s price recently dropped sharply to $98,000 but has since recovered to above $100,000. While concerns about a potential double top are spreading and market sentiment is turning bearish, as mentioned before, on-chain data has not shown any significant warning signs.
Overall, Bitcoin still appears to be in a quiet phase of consolidation, gathering strength, and based on the 30-day moving average of Binary CDD, long-term holders continue to hold rather than sell.
In a previous analysis, I noted that a Binary CDD 30MA value above 0.8 often preceded correction phases. However, this time the indicator peaked around 0.6 and has started to decline, suggesting that the market is not yet showing signs of overheating.
Although the data may not align perfectly from cycle to cycle, this moderation below 0.8 still implies the market may be entering a consolidation period, and further price or time correction could follow.
Importantly, this does not signal the end of the bull cycle. Instead, similar to the past two phases, we may once again see a staircase-like movement where consolidation is followed by another leg up.
Historically, Bitcoin’s explosive rallies tend to occur when market attention fades and sentiment is quiet, making the current silence potentially a precursor to the next big move.


View original →

