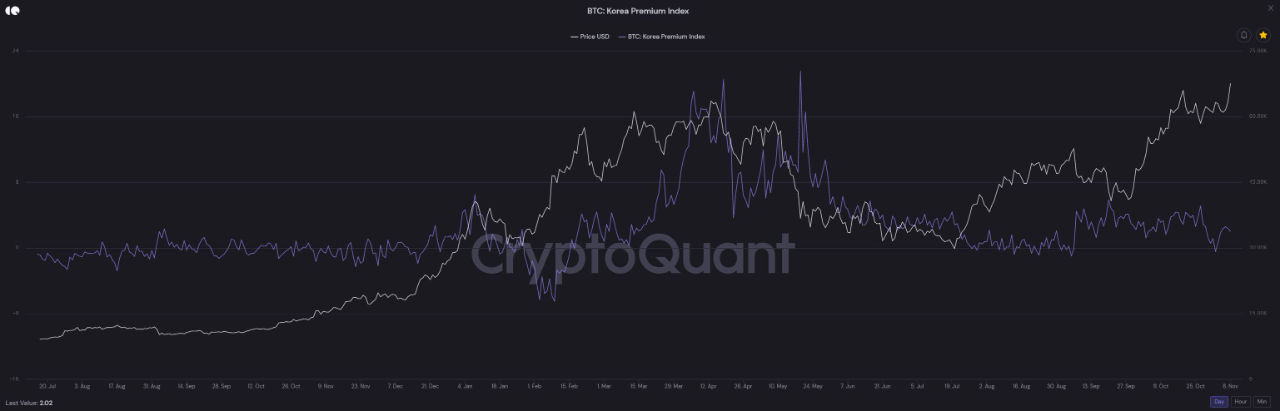
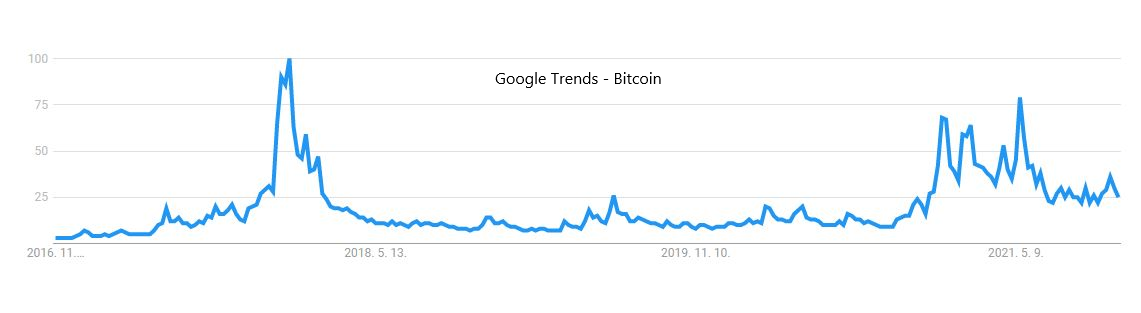
There is still no sign of overheating in Korean Premium and Google Trends.
Short-term investors have just begun to input their money.
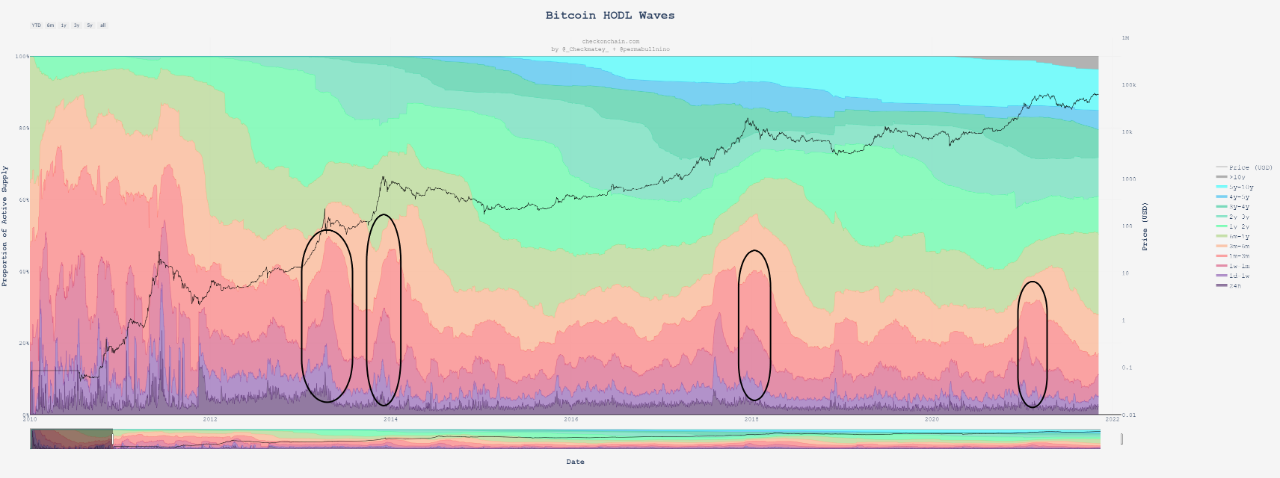
In the HODL-Waves, short-term investors were always overheated at the end of the bull market.
As in the previous bull market, stop-hunting can often occur due to leverage, but there seems to be no reason to sell for Spot HODLER.
Wait for the rush of short-term investors

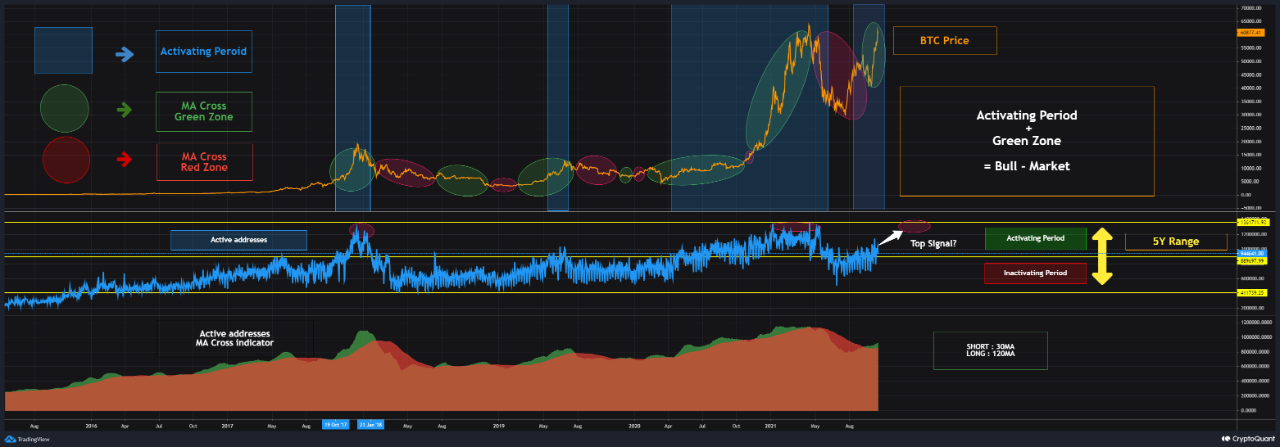
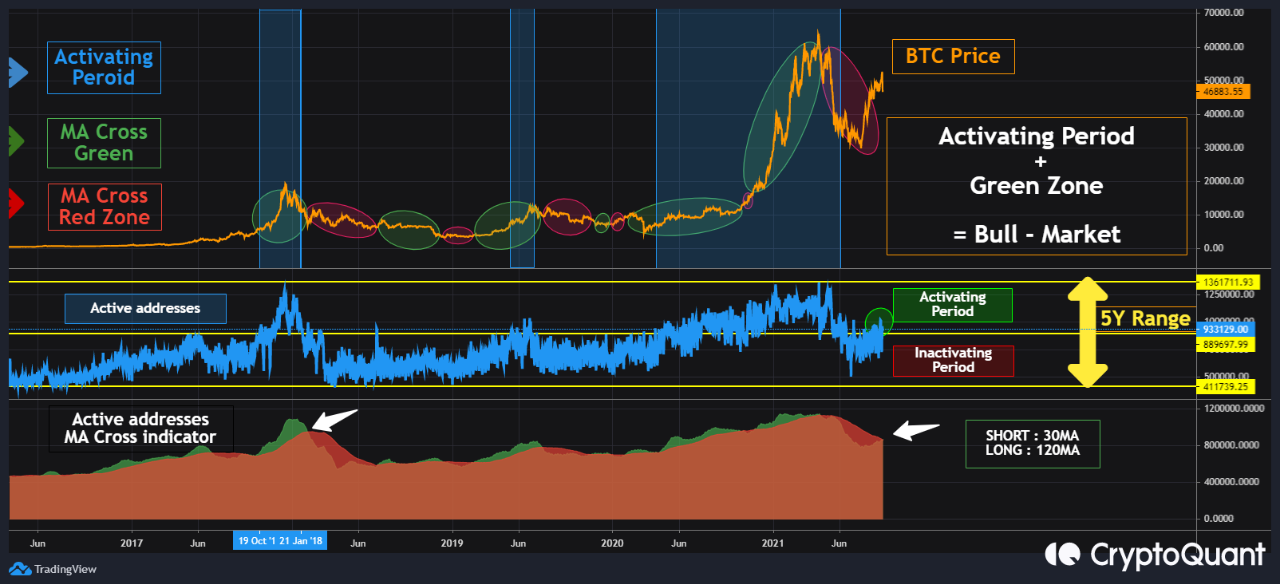
View original →According to activating addresses level and MA Cross indicator, We already have entered the bull-market!
Now what we need to look at is when we will take a profit.
Network participants peaked at around 1.2M in 2017 and around 1.3M in early 2021, and the price also peaked.
As time goes by, the number of participants will naturally increase as the network grows.
But when active addresses get to around 1.2-1.4M, you will have to check whether the peak is coming.
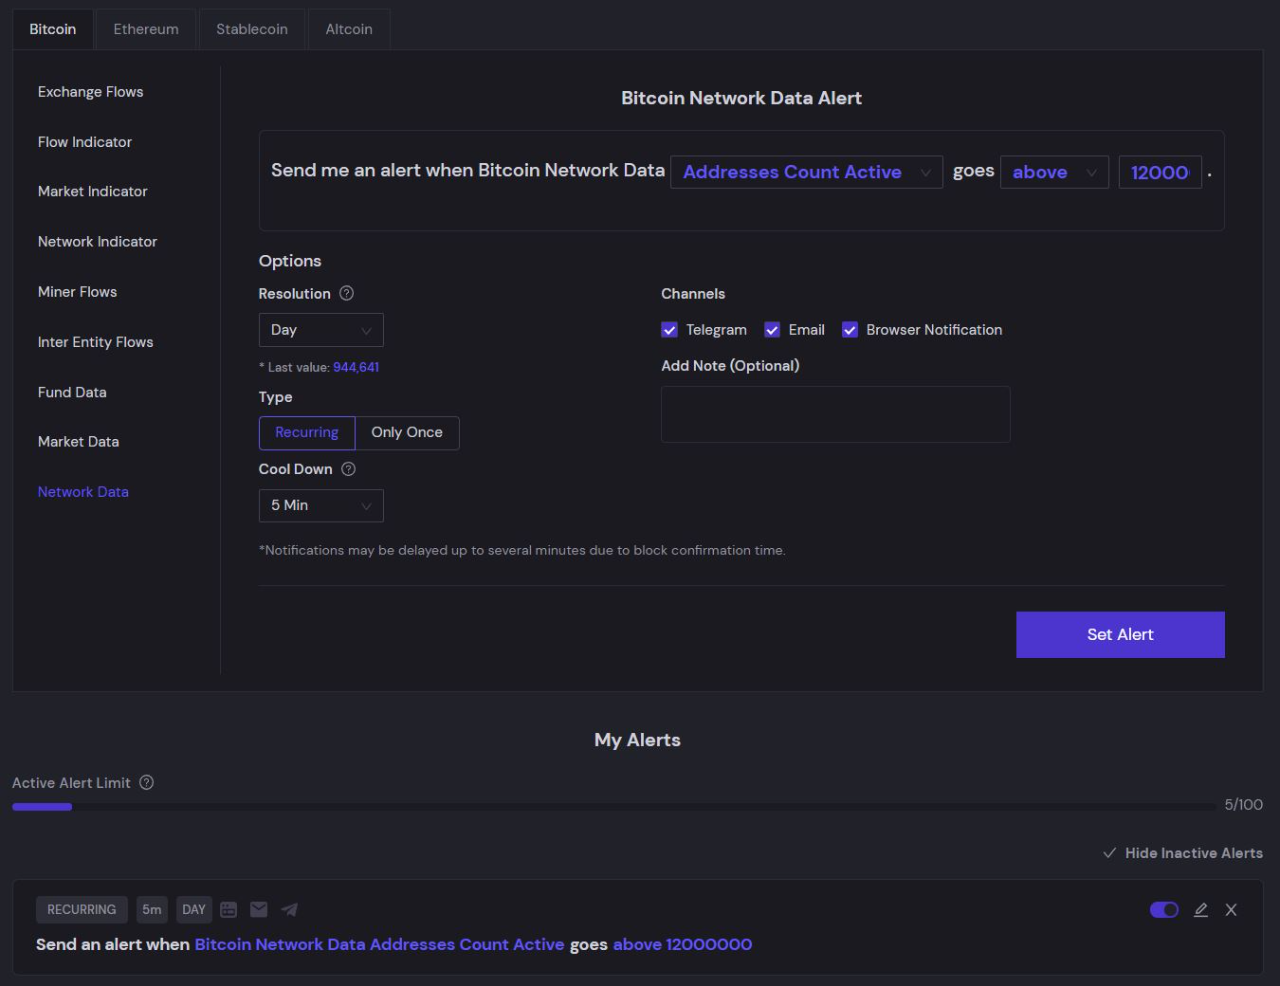
Set the alarm level above 1.2M!

View original →Bearish(Nuanced)BTC
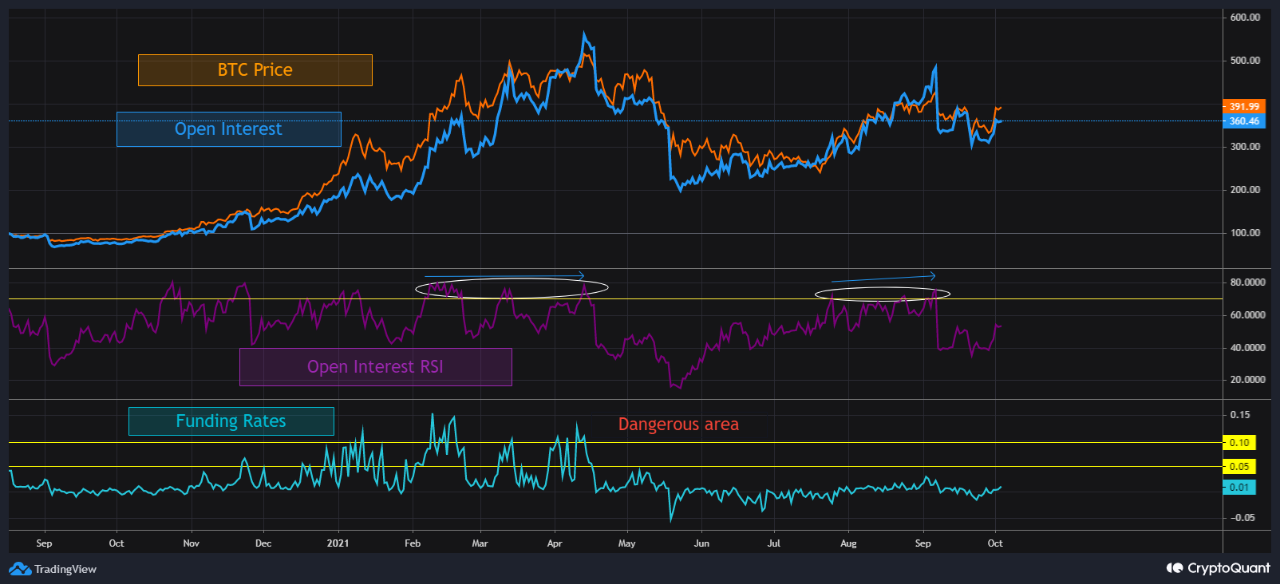
10/4/2021 Open interest(OI) and PRICE move almost similarly, but the increase in OI is noticeable in the excessively leveraged section.
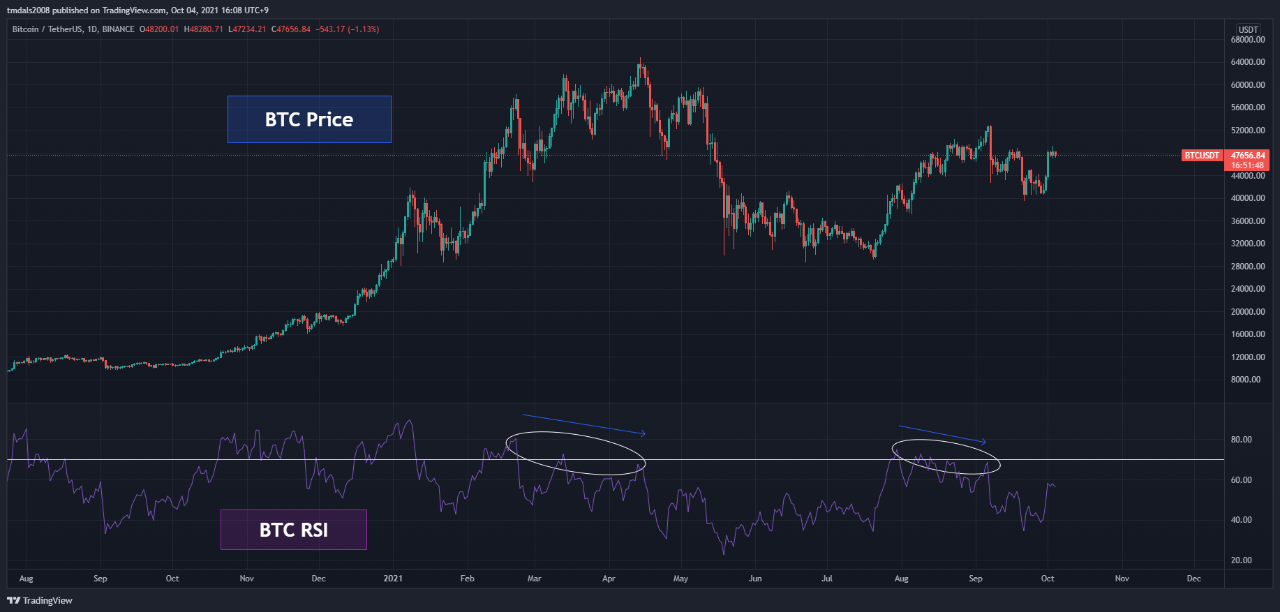
During the PRICE RSI draws down-trend, OI RSI draws flat or up-trend occurs.
This means that OI increase relatively faster than PRICE increase.
Even if the funding rate is not high, the degree of leverage can be checked through the opposite trend of OI RSI and PRICE RSI.
We should take a profit or decrease leverage position in this section.

View original →Bearish(Nuanced)BTC
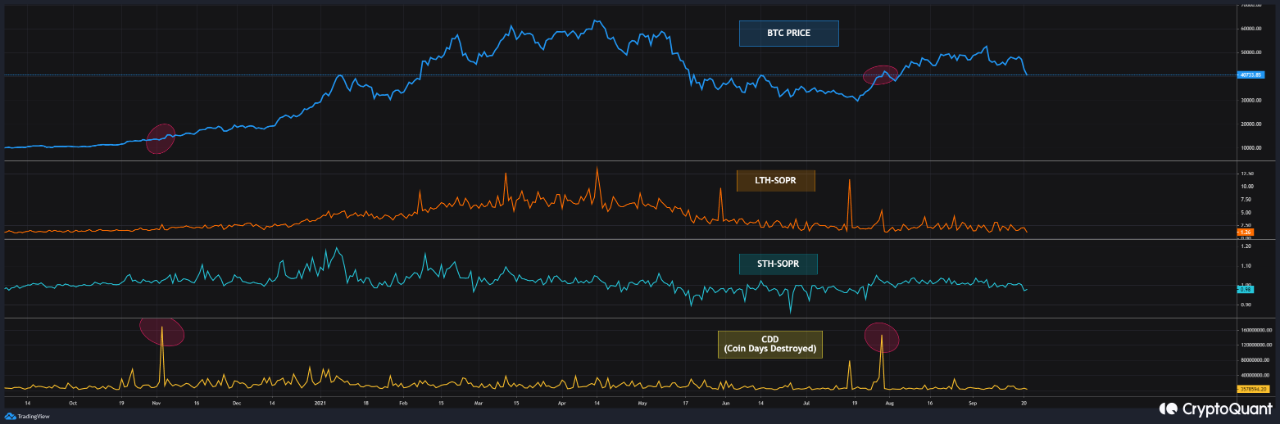
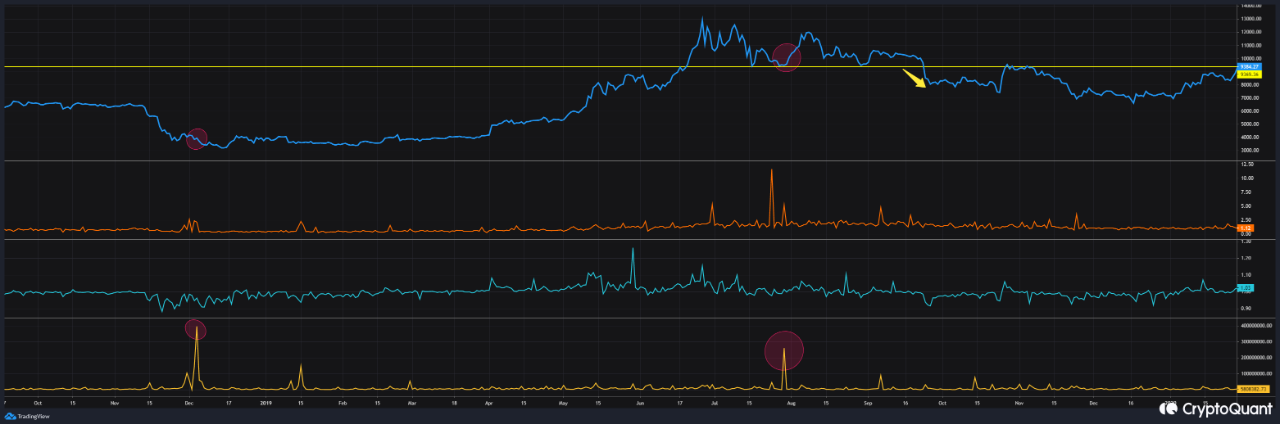
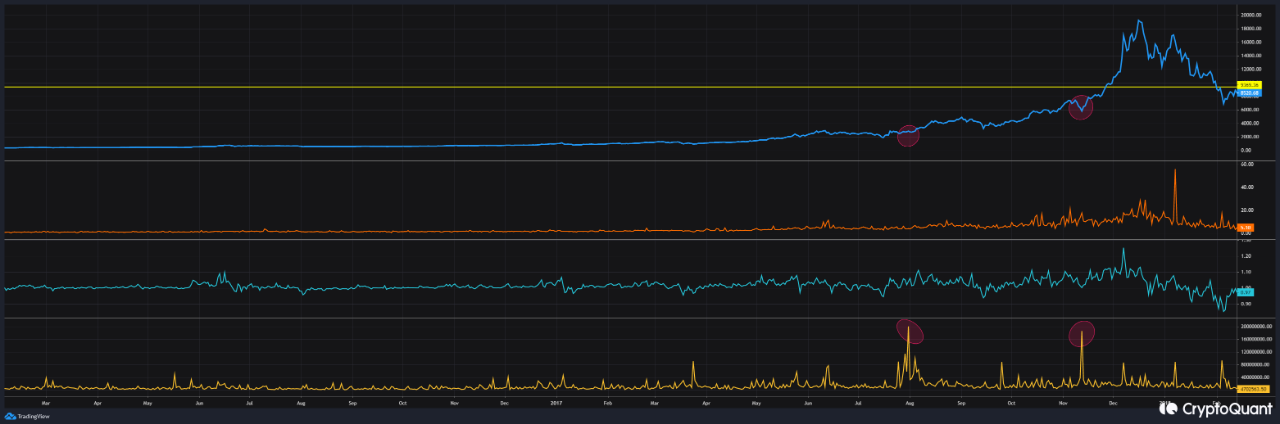
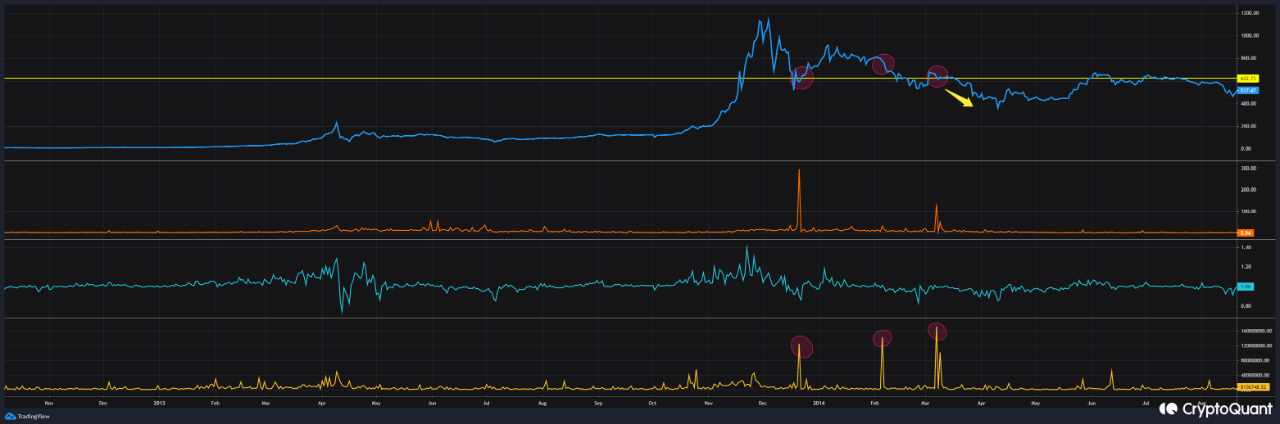
9/22/2021 CDD captures the activity of whales and long-term holders.
Historically, high-CDD level has often been an important turning point.
Indicators more often appeared from the bottom prior to a new bull-run.
But... If BTC lost the price that captured high-CDD level, BTC used to show a big drop.
CDD that captured at 39K-40K are also likely to represent important turning points.
BTC showed a good bounce at 39-40K.
But if we lose this section and go down, 100k will be difficult in this year.

View original →The largest long liquidation occurred after the crash in May, and it was a hard day for many traders.
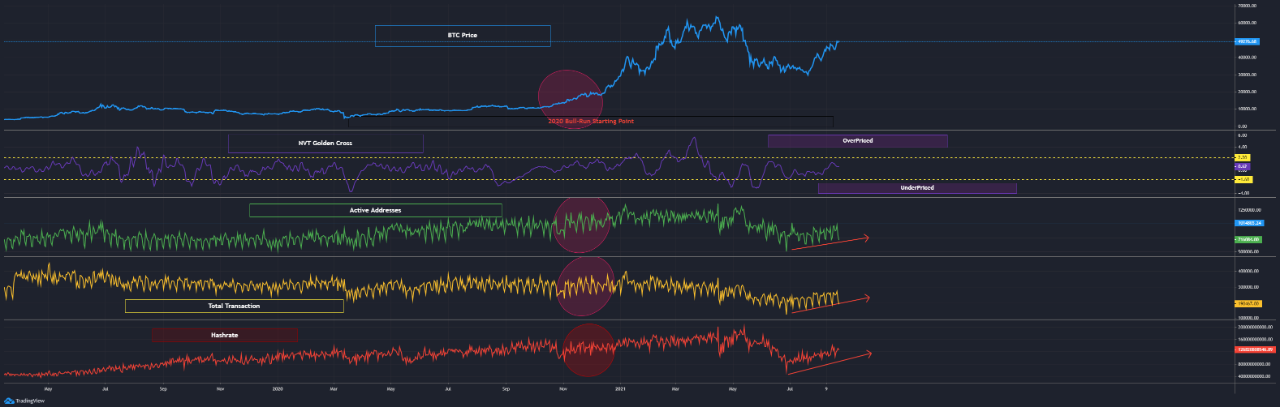
However, the network indicator is still strong. Hashrate, which fell due to CRASH from China, is almost recovered.
Participants returned to the 2020 Bull-run level.
If you look closely at the active addresses, it has entered the activating period again, unlike the 2017 Dead Cat Bounce. And the MA cross indicator almost reached the green zone!
Calm down. Stay focus. BTC is still strong.
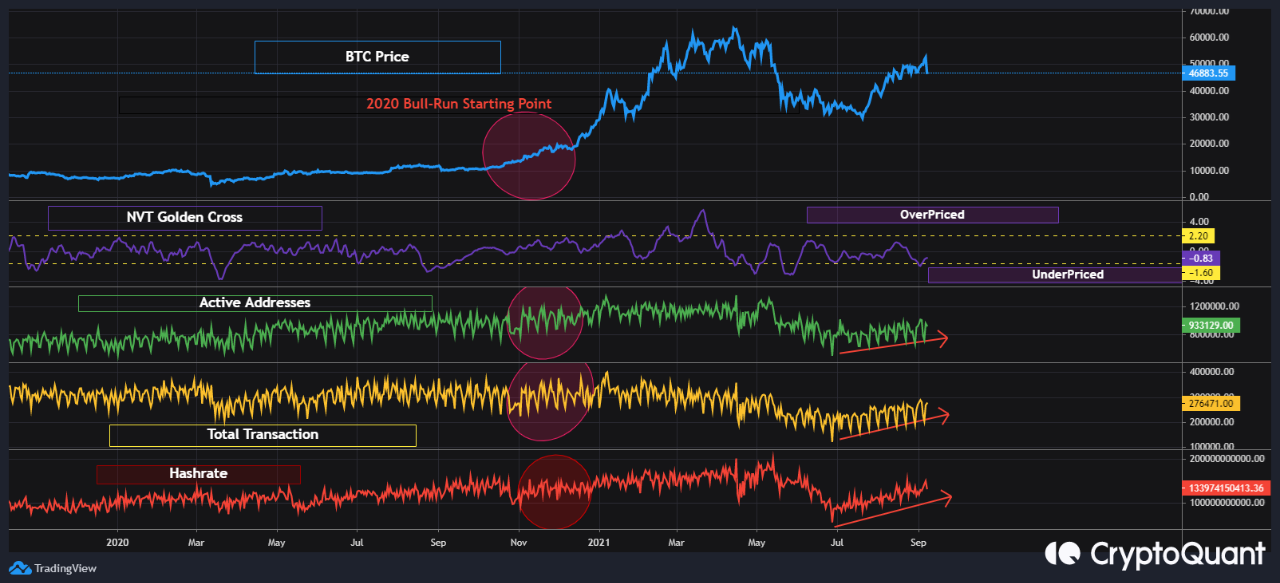

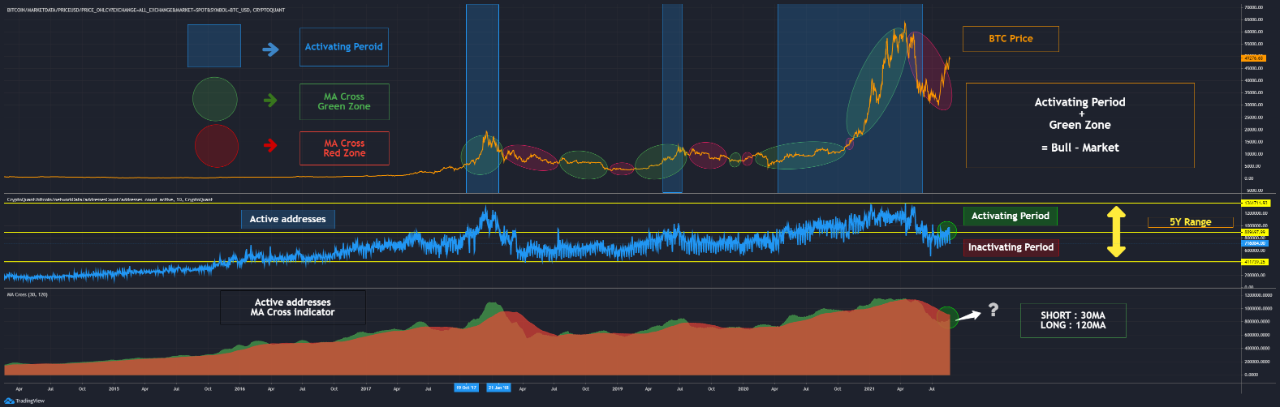
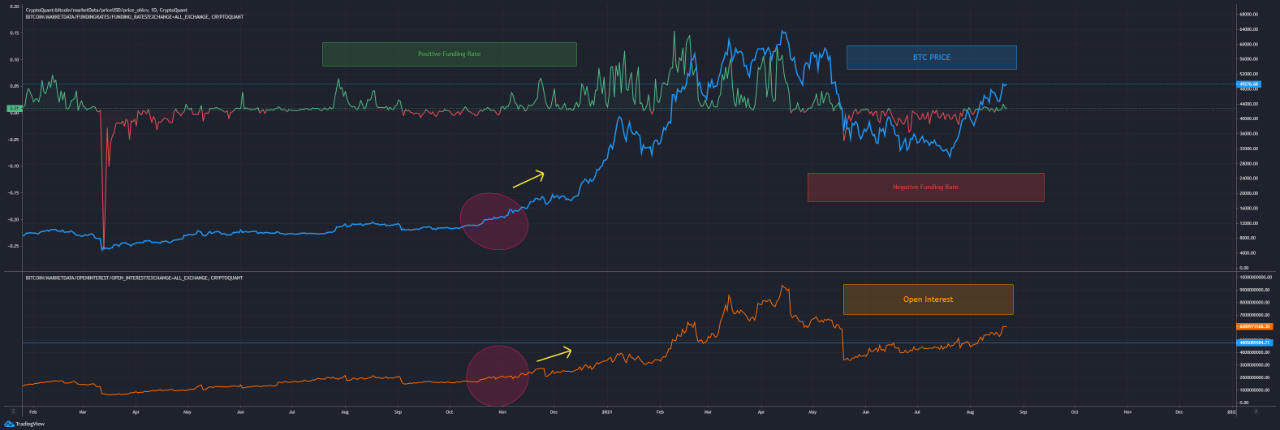
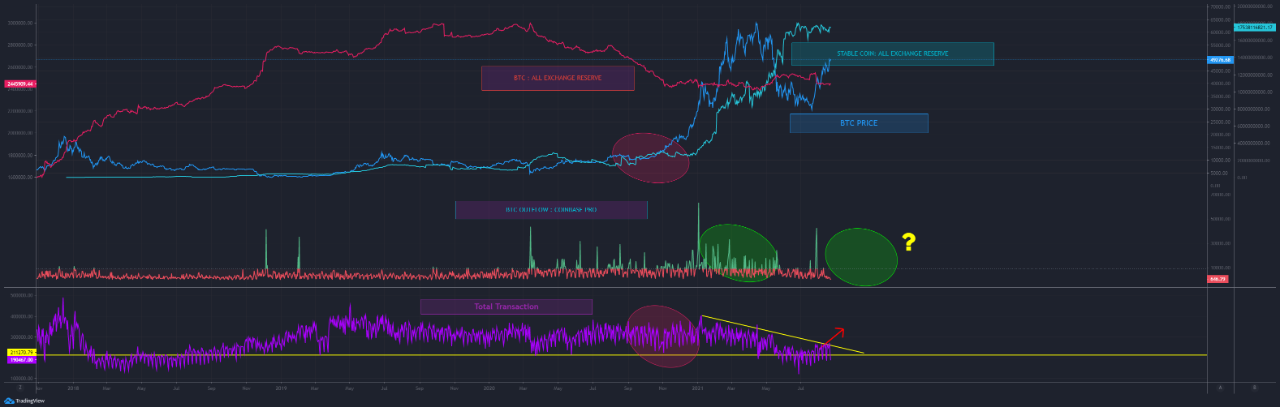
View original →Network indicators are recovering to previous bull market starting points.
Active addresses are starting to enter the activating period and the green zone is likely to be confirmed in MA Cross soon.
Open interest continues to increase, but funding rate is still low condition.
This means many investors still have fear.
Demand-Supply Ratio is always good! Network indicators are almost recovered! But many retail investors still have fear!
What a beautiful situation!

View original →Bullish(Nuanced)BTC
8/8/2021 Data from the past five years show that many network participants have not returned to the market yet.
According to the active addresses data, BTC network has not entered the activating period yet.
Also, the MA Cross indicator has not reached the Green zone yet .
However, if the movement of the past few weeks continues, the participants in the last bull market will come back, and we can see the green zone in the MA cross.
If BTC network enters a bull-market cycle, we will see ATH over 100k!!


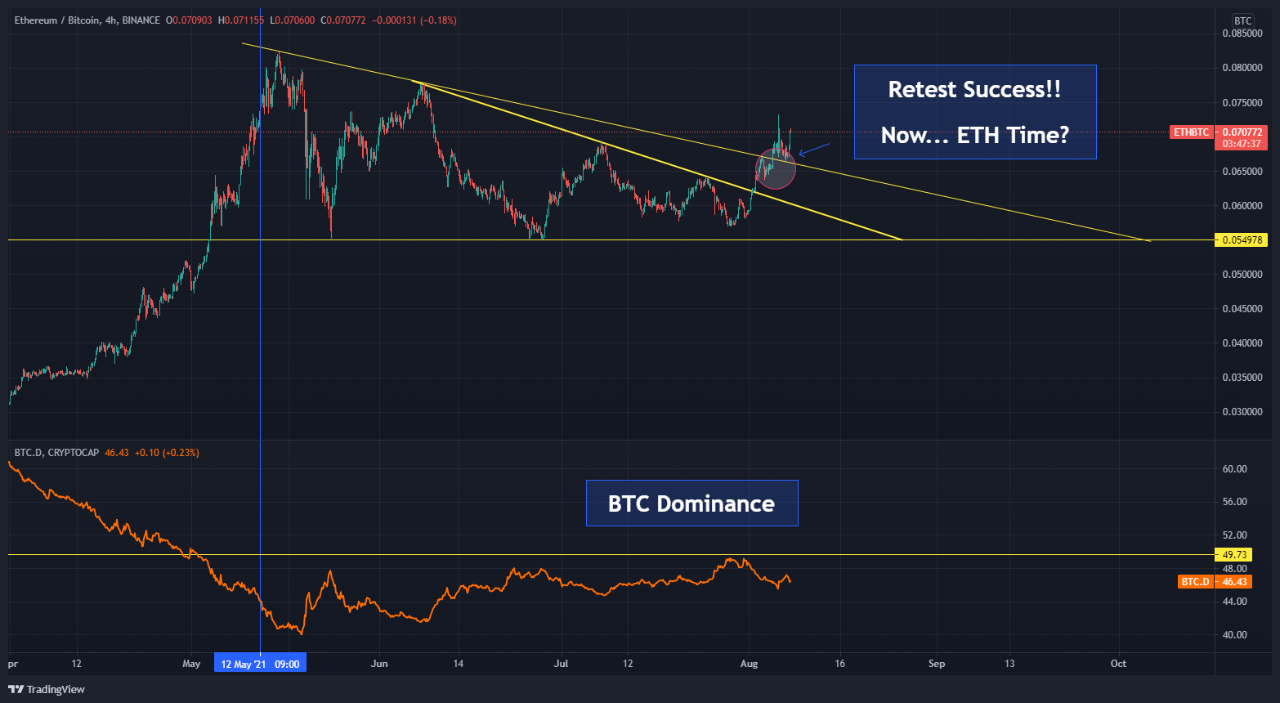
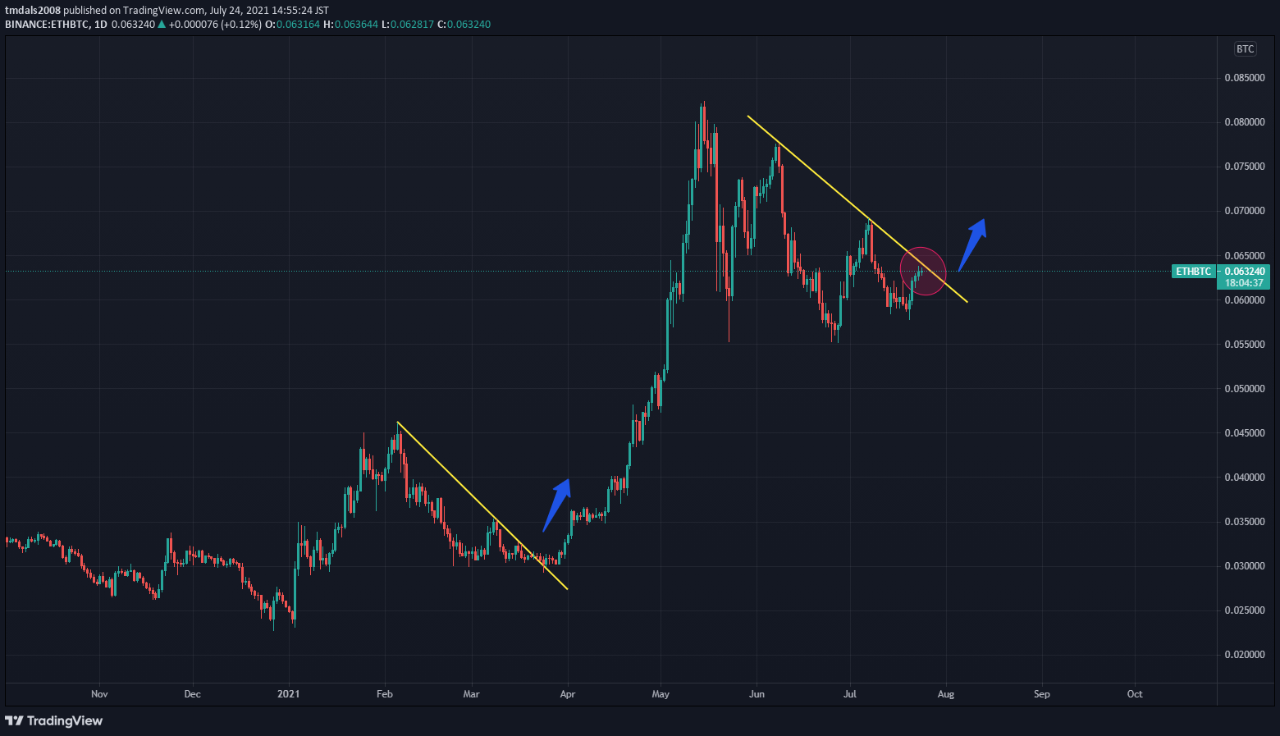
View original →ETH/BTC Chart shows successful retest the downtrend line!
The London hard fork was successfully completed. 9000 ethereum burned in 48 hours!
In my opinion, ETH looks still more attractive than BTC
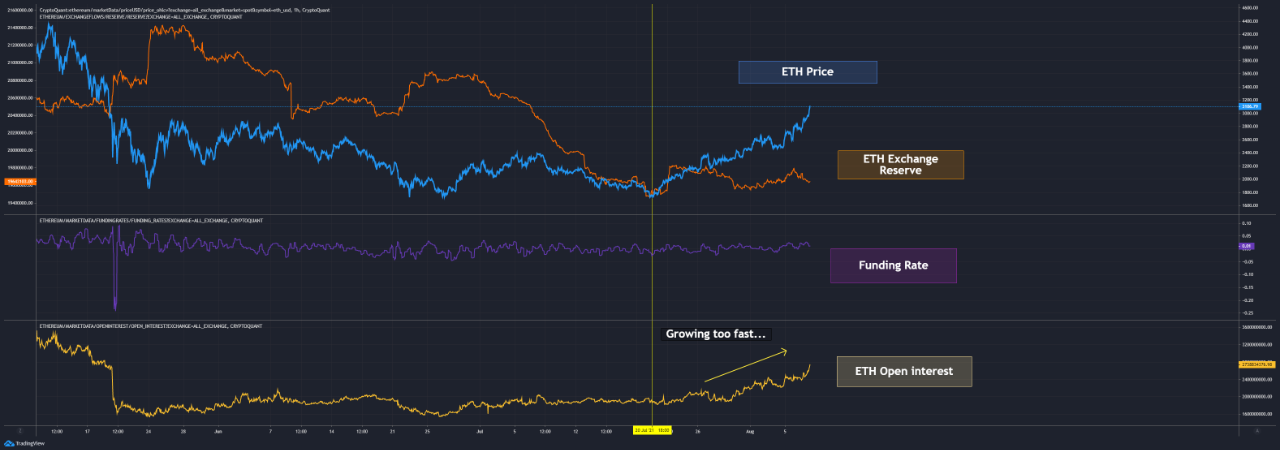
But over the past few days, ETH Open interest has grown too fast...
I think this is not good timing to take a high-risky Long position.
Please do not FOMO!!


View original →Bearish(Nuanced)BTC
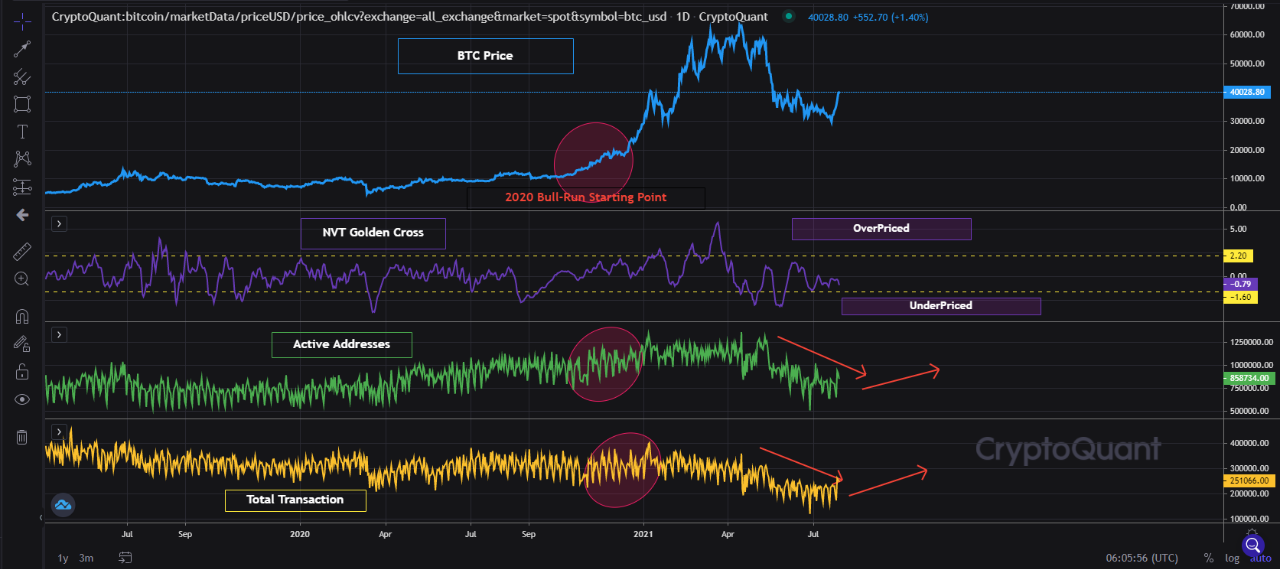
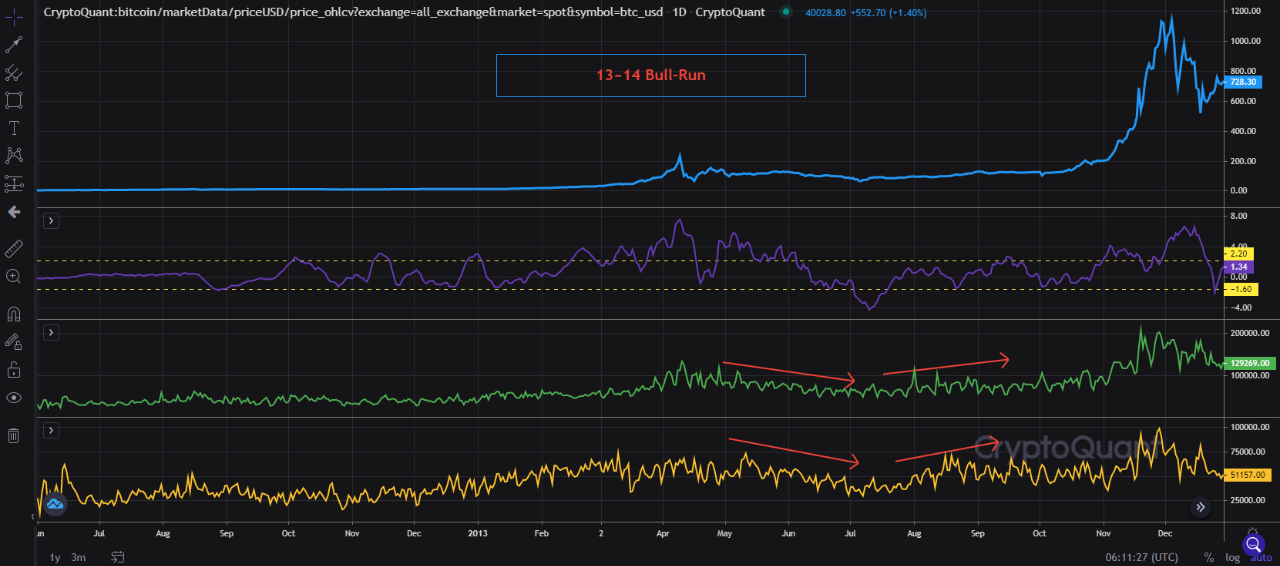
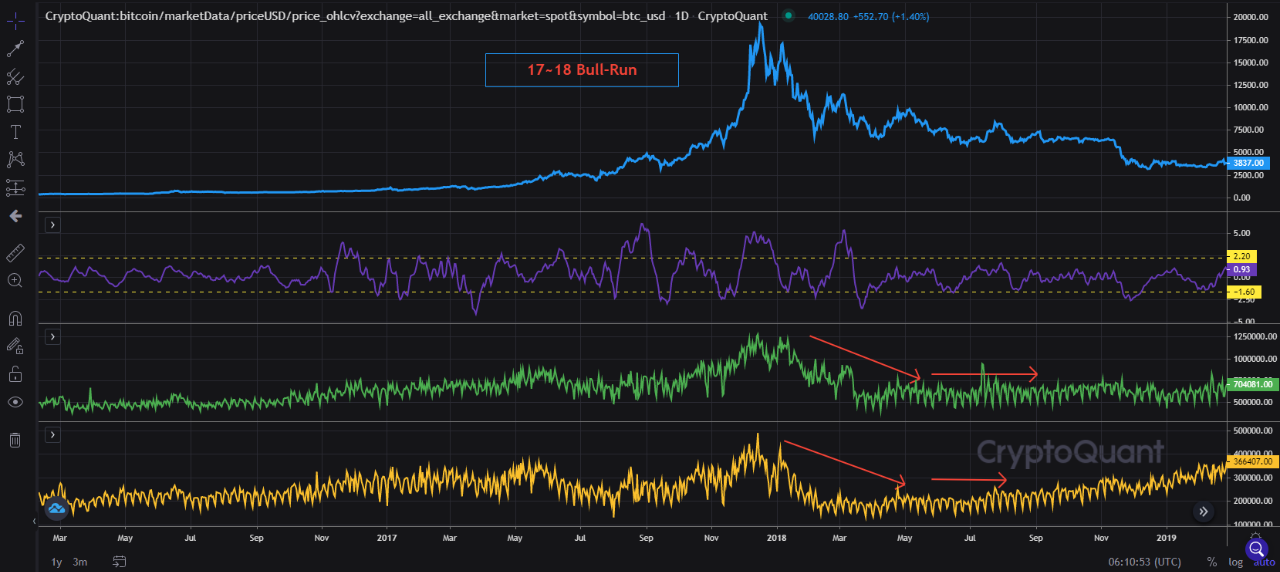
7/29/2021 NVT Golden Cross, a network indicator, is currently at a neutral level.
Due to the regulations on Chinese miners and price dumping, network activity has become very weak
Let's take a look at the Bull-Run in 2013 and 2017.
For another bullish cycle to come like the last bull market, network activity must be recovered.
If network activity does not maintain the previous 20-21 bull-run starting point level, We should doubt whether the new bull-run cycle is right.

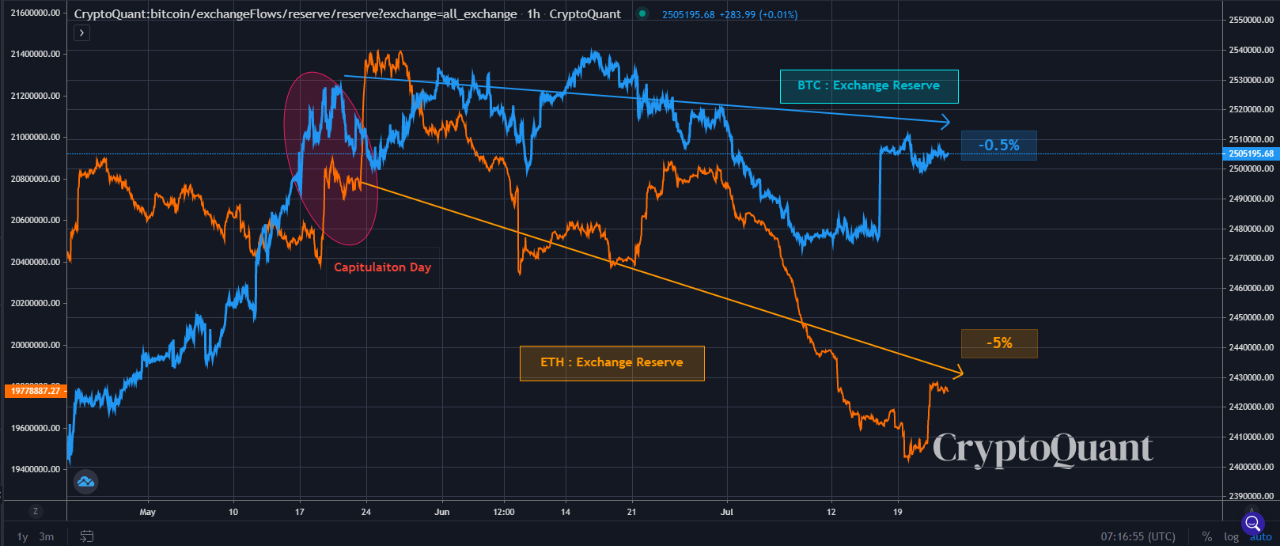
View original →1. According to the recent trend of EXCHANGE RESERVE, ETH looks more attractive.
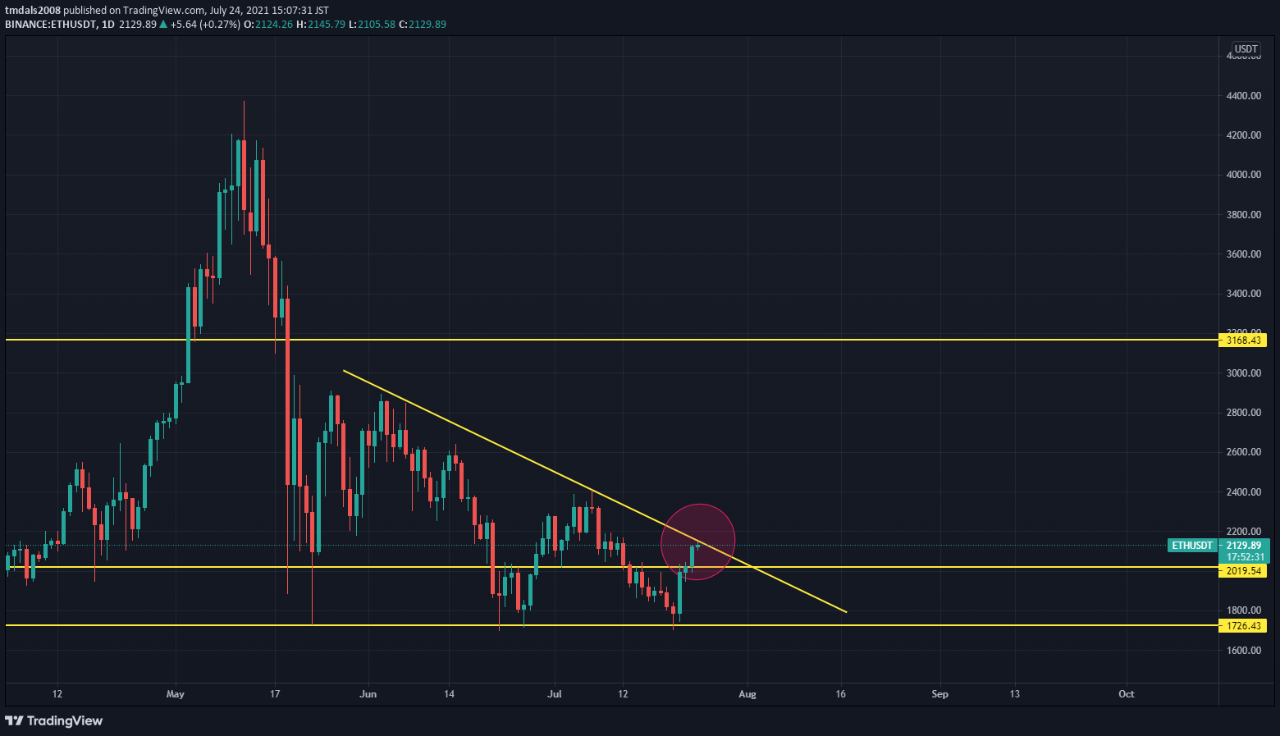
2. ETHUSDT / ETHBTC
Both charts are on the verge of breaking the downtrend line.
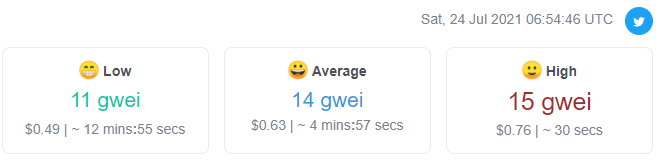
3. Lower gas fee + Frequent BSC Rug pull >> ETH attractiveness in Defi is increasing.
If the next bull-market starts and supply shock will occur, It is expected that ETH will show a better rate of return compared to BTC

View original →

