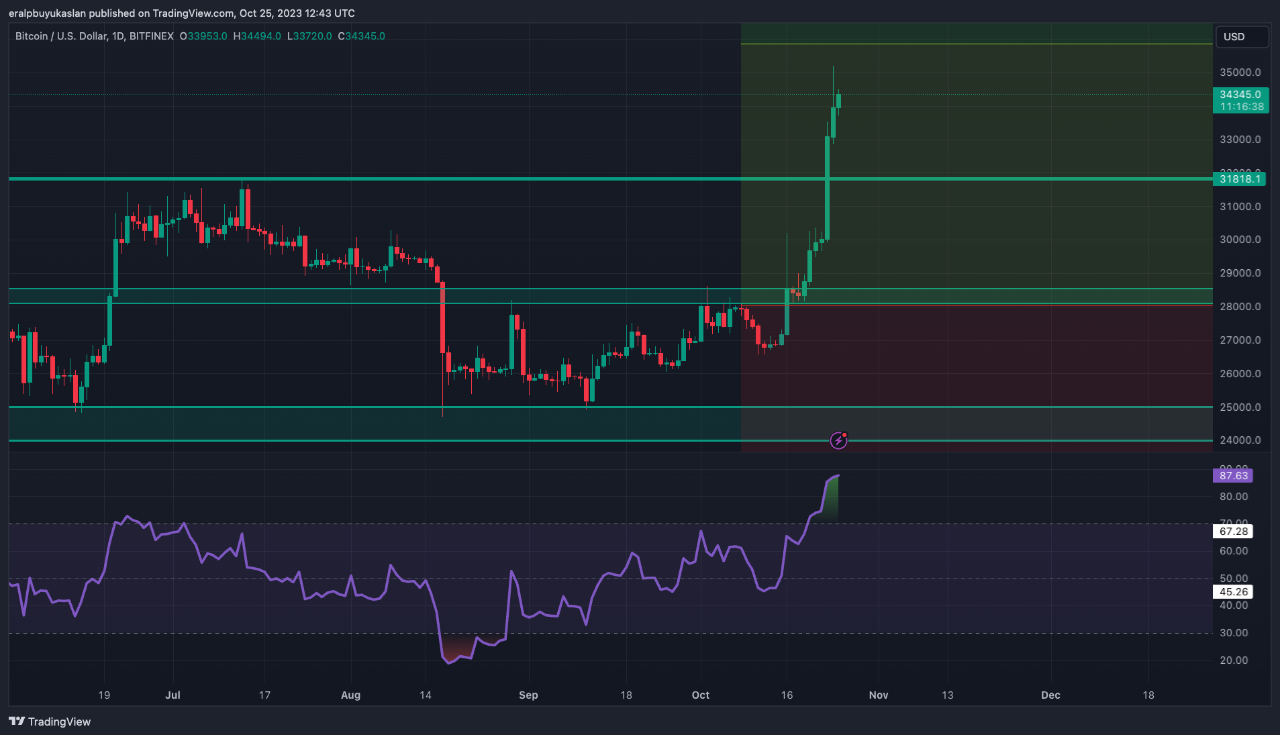
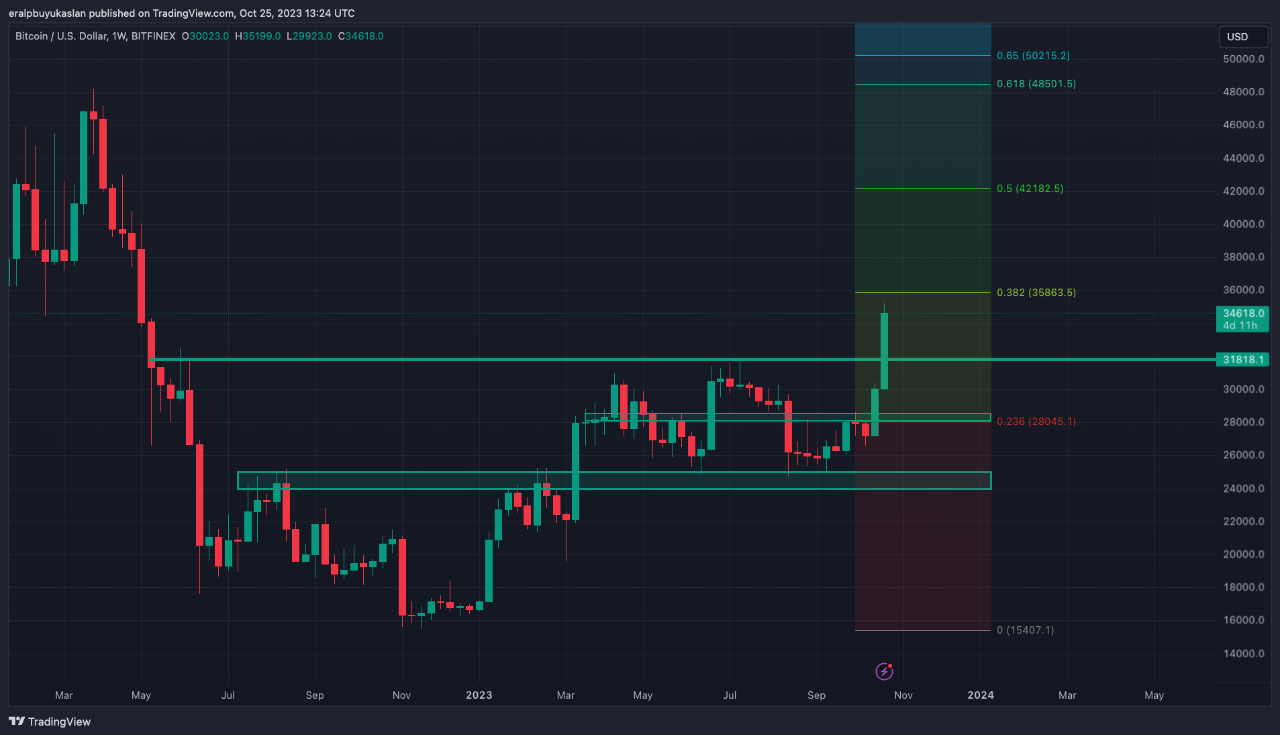
Even though the HYPE in the market may make us believe that this upward movement will continue without slowing down, we shouldn't forget that the Resistance Line we are in (35K-36K) contains both Technical and Fundamental risks.
1.RSI Indicator: This indicator has climbed up to 87 levels on the daily chart, and this means risk.
2.FIB 0.382 level: Based on the Fibonacci Retracement drawn by taking the November 2021 peak and November 2022 through as a basis, the 0.382 level corresponds to the 35863 USD level. Generally considered a significant indicator for trend breaks, this level is regarded as a major resistance unless its broken.
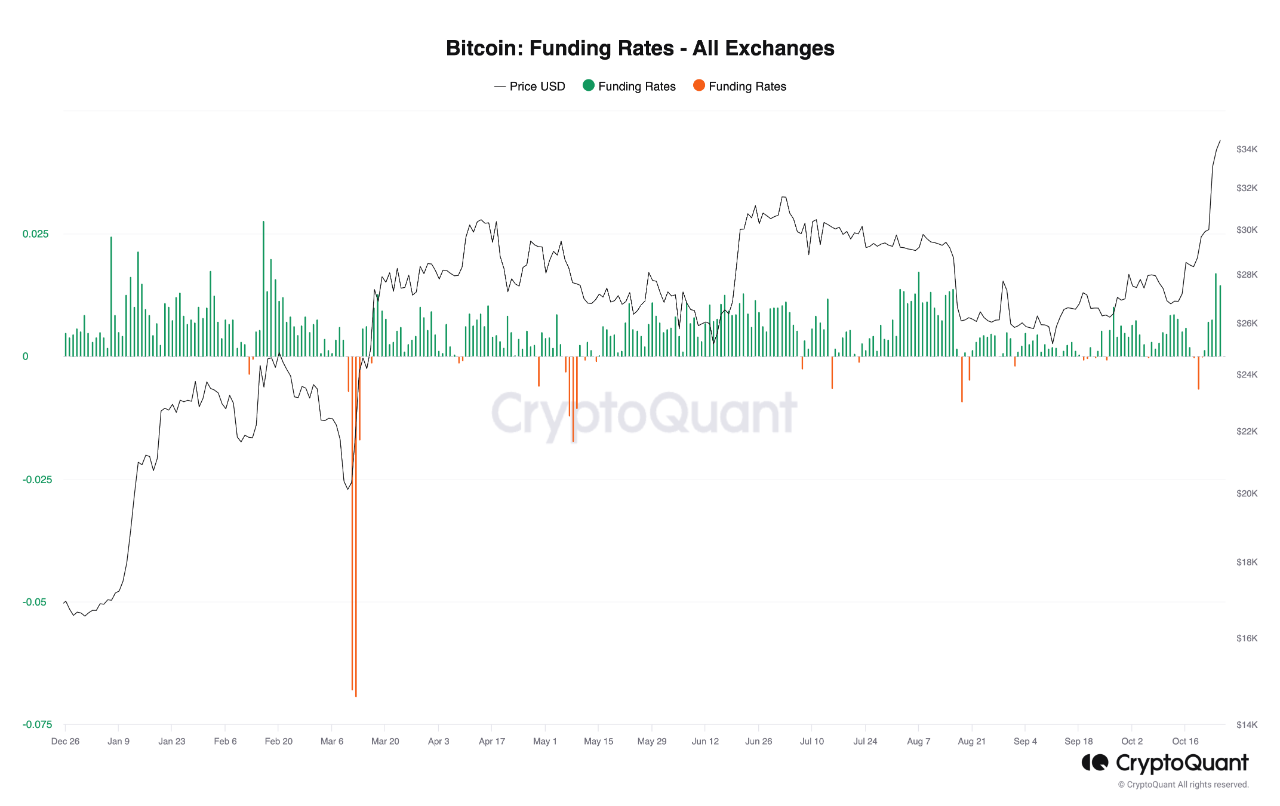
3.Funding Rates have been positive for days: On exchanges where retail investors are active, we see that investors have been taking substantial long positions for days. While this situation may indicate increased optimism among investors, it also implies a short-term correction risk. We know that whenever the Funding Cost turned this positive in 2023, corrections followed within the next 4 to 5 days.
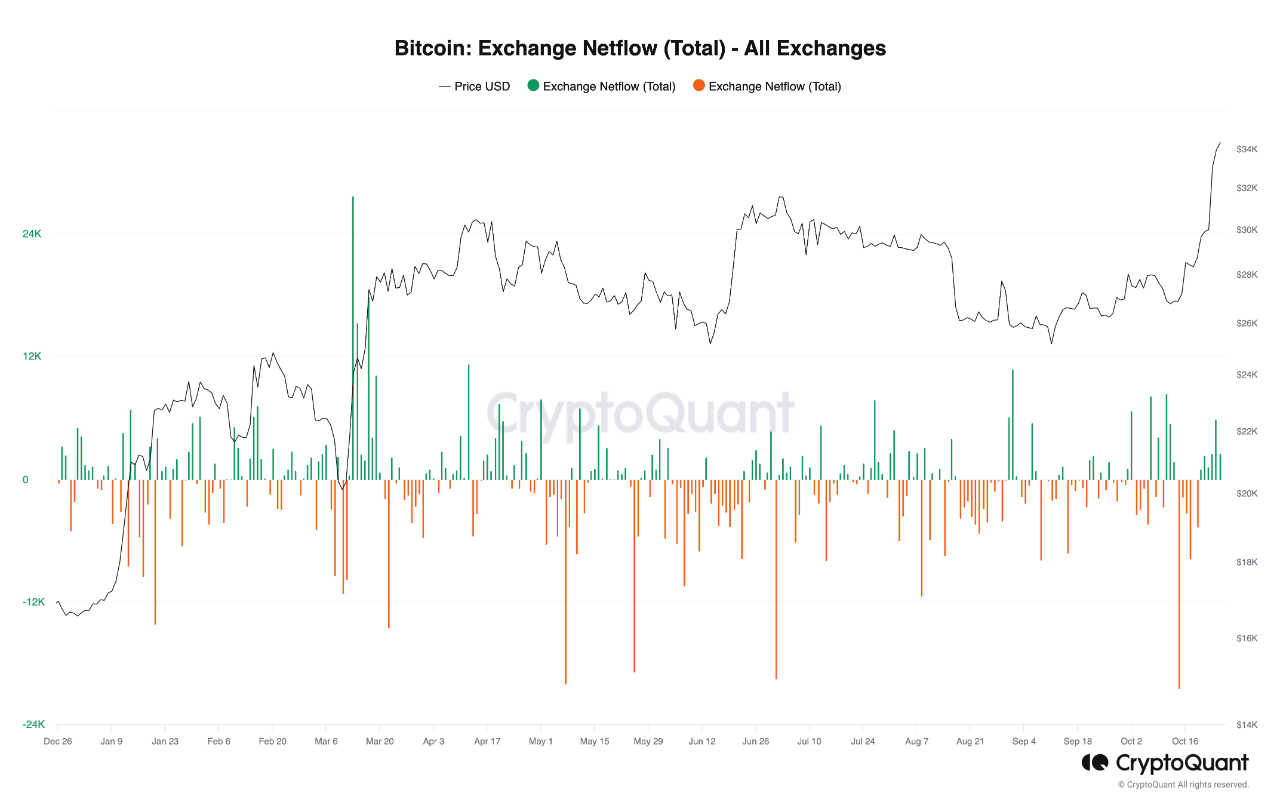
4. Exchange Net Flow chart: Looking at this chart, we see that the amount of BTC entering the exchanges is more than what's leaving. Based on this indicator, I believe we are not in a risky area yet, but if this trend continues in this manner, we might consider it an on-chain risk.
Considering these indicators, it would be more reasonable to anticipate a small correction to the 32K range rather than a deep correction that would completely reverse the trend.

View original →Bearish(Nuanced)BTC
10/12/2023 Always wandering at high levels of these metrics makes me uneasy
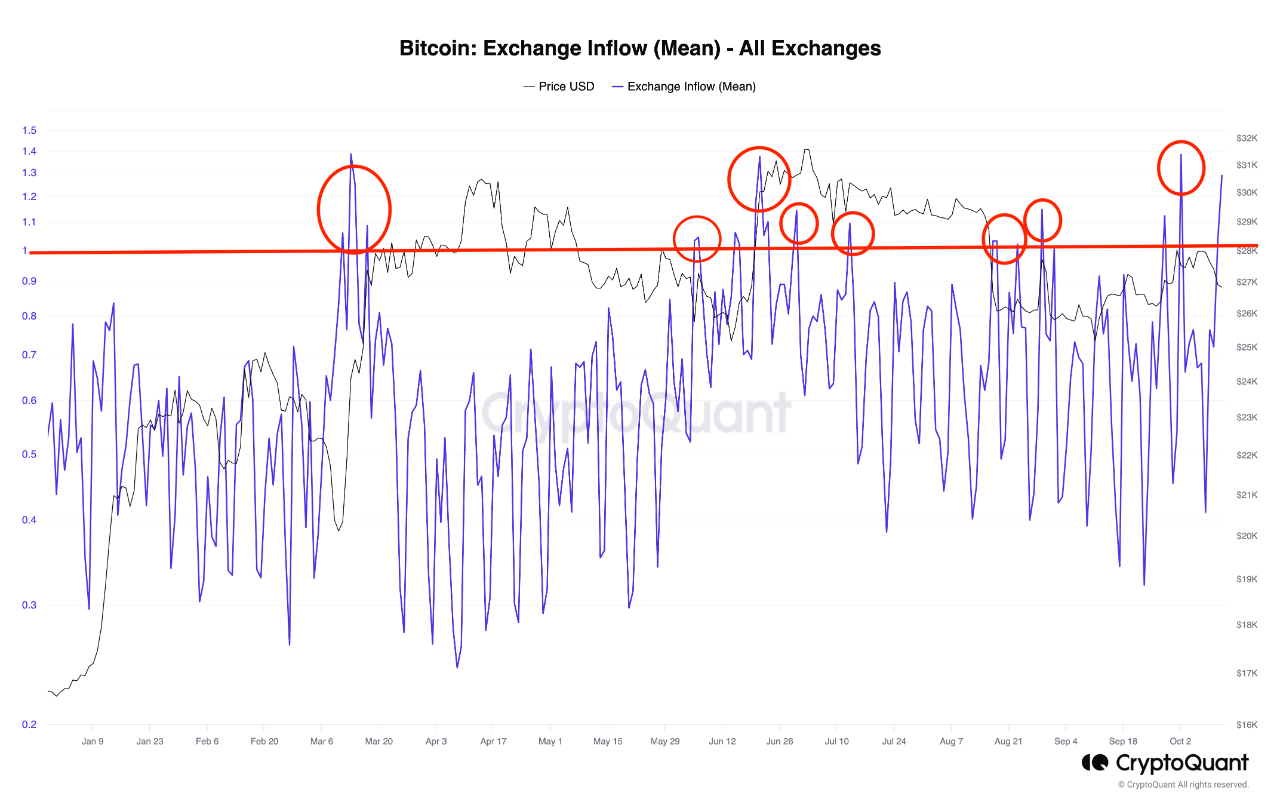
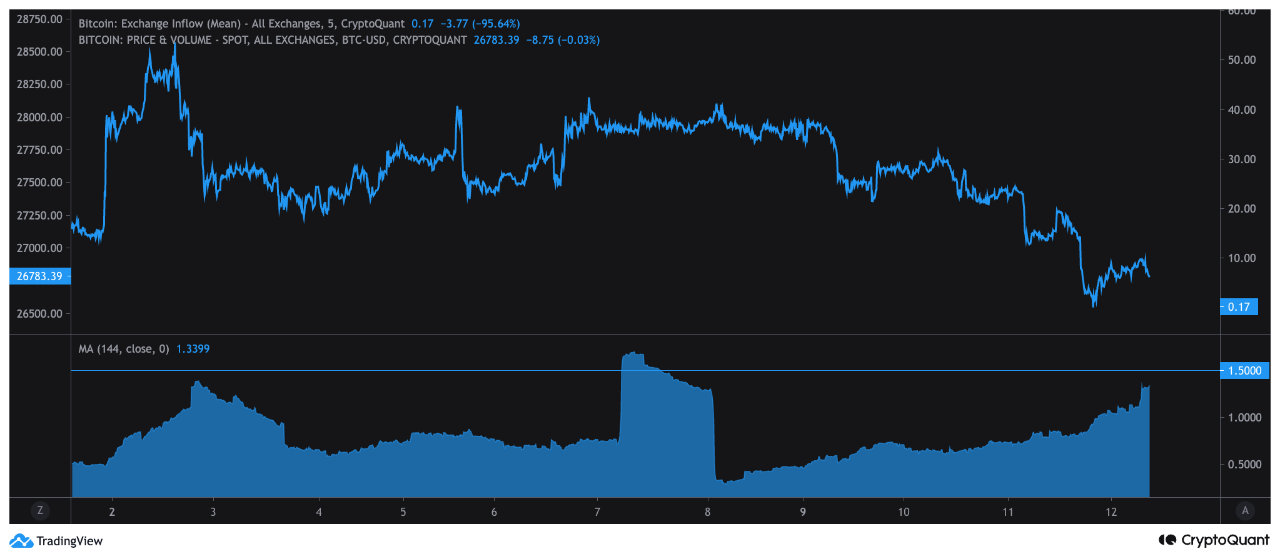
Currently, two classic metrics clearly indicate that we are in quite risky areas.
Despite the correction that has been ongoing for 4 days, being at these levels can also be interpreted as the correction will continue.

View original →Bearish(Nuanced)BTC
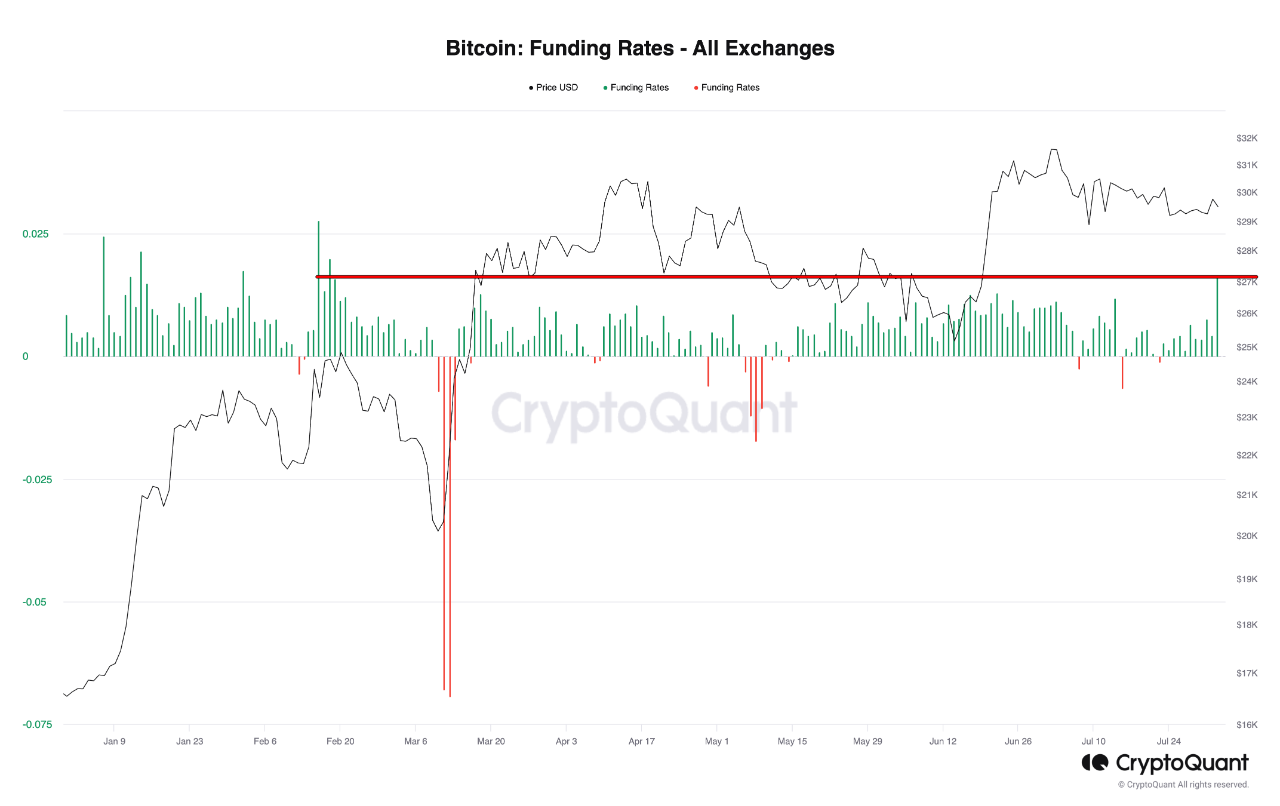
8/2/2023 According to Bear Market dynamics; this Funding Rate Increasing has to be remind DO NOT FORGET TO PUT STOP ORDER on your High Leverage Longs
We didn't see that amount of Funding Rate since Feb 2023. At that time that F.R caused correction
🚨So be careful with your HİGH LEVERAGE LONGS AND DO NOT FORGET TO PUT STOP ORDER

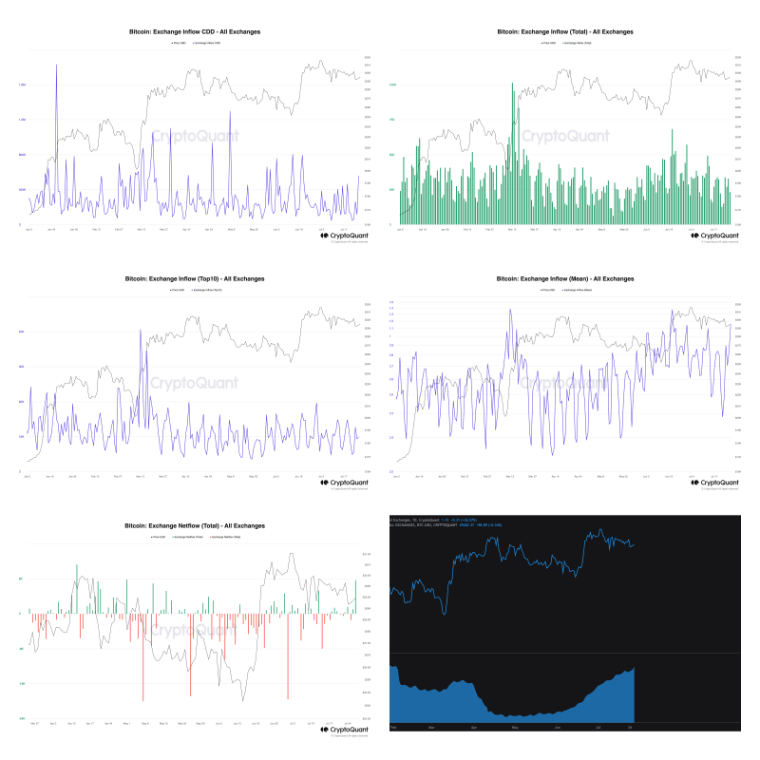
View original →According to Exchange Inflows based On-Chain Metrics; Inflow Levels are attention getting🚨
Lets look one by one:
- Bitcoin Exchange Netflow: According to 2023 market conditions those levels are problematic🔴
- Bitcoin Exchange Inflow(Mean): According to 2023 market conditions those levels are problematic🔴
- Bitcoin Exchange Inflow (Top10):According to 2023 market conditions those levels are not a big deal🟢
- Bitcoin Exchange Inflow (Total): According to 2023 market conditions those levels are not a big deal🟢
- Bitcoin Exchange Inflow CDD: According to 2023 market conditions those levels are problematic🔴
- All Exchanges Inflow Mean(ProChart): According to 2023 market conditions those levels are argumentative🤔
👉According to metrics we can not speculate. However I would like to prdeicate on NETFLOW in here so problematic side outweigh for me actually

View original →Bearish(Nuanced)BTC
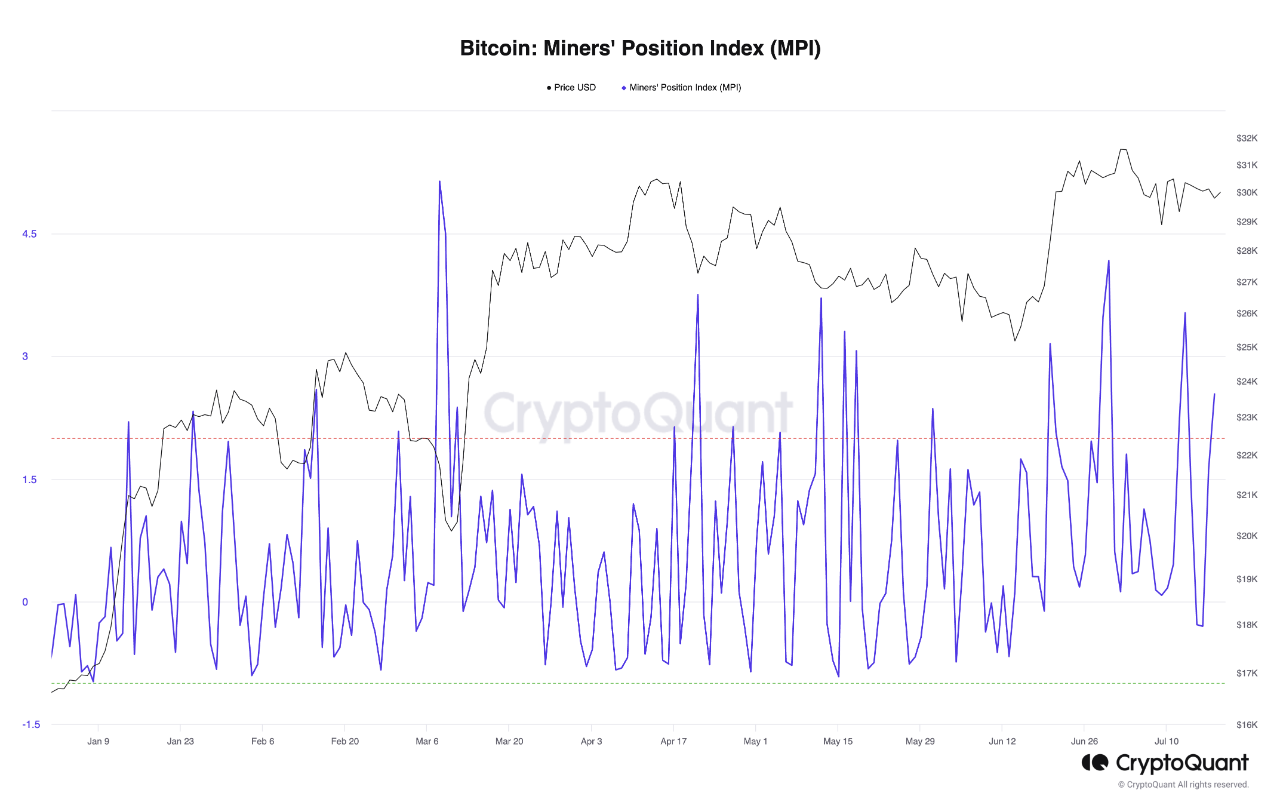
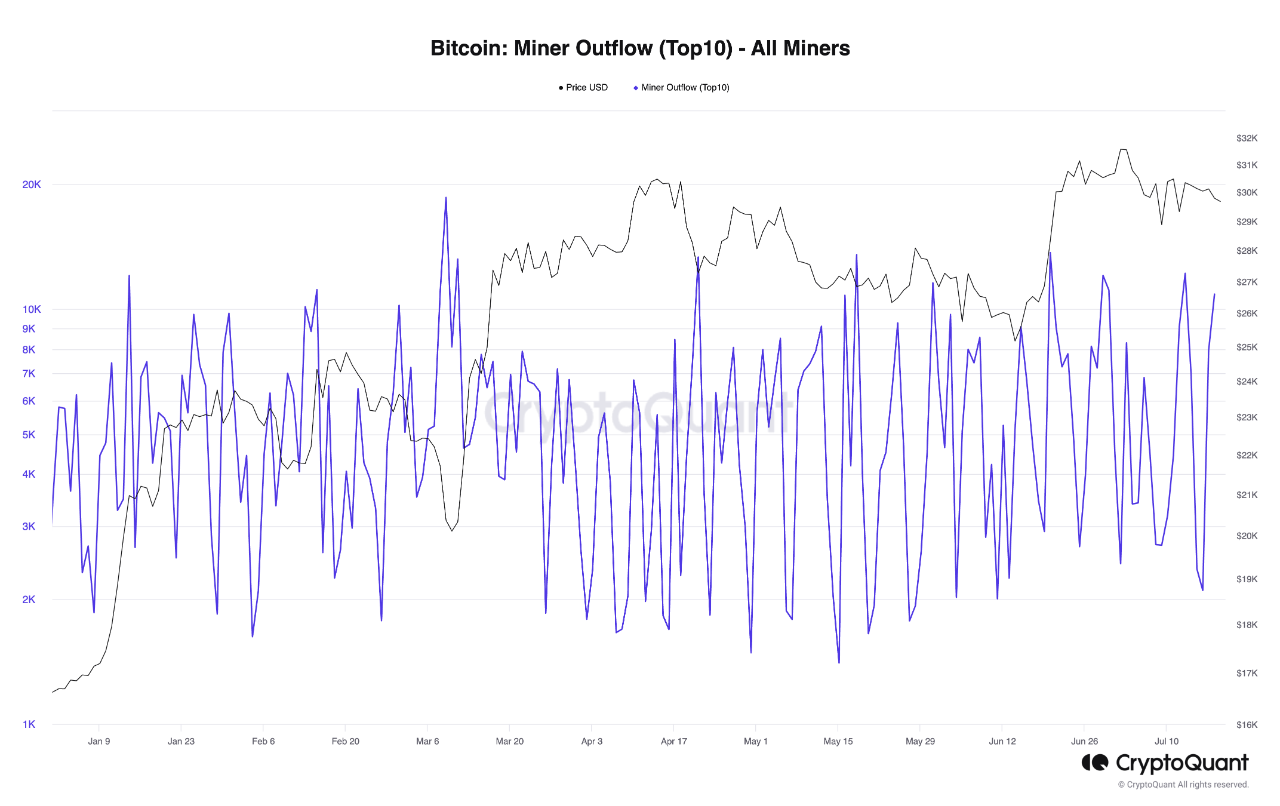
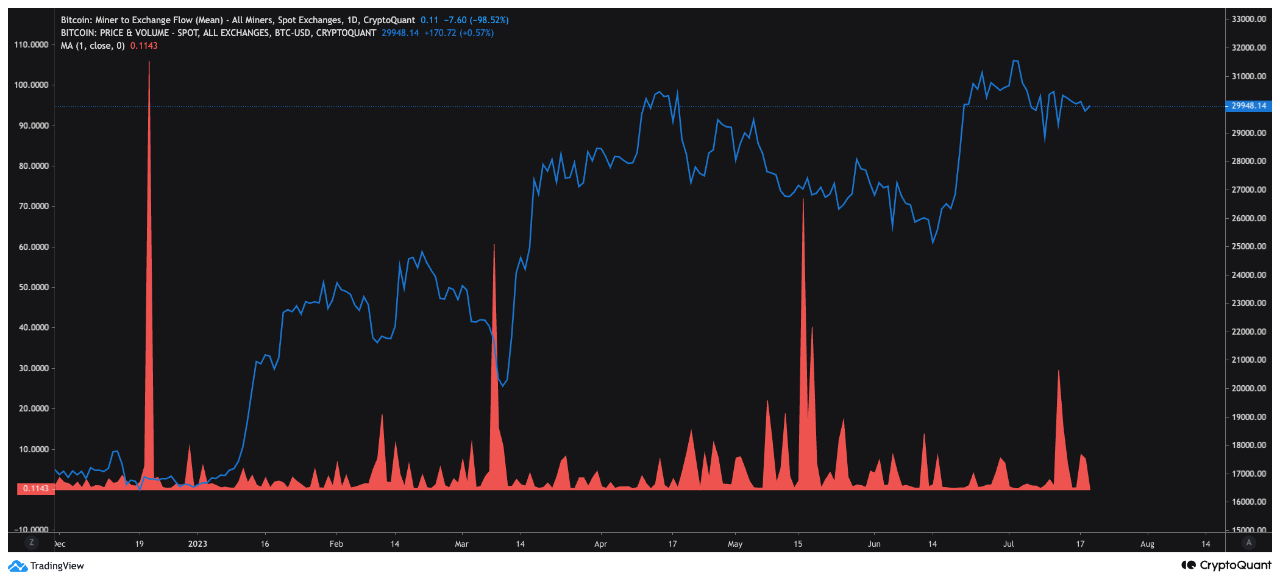
7/19/2023 I usually use 3 Metrics to understand Miners behaviours
1. Miners Position Index👉 Increasing which means Risk
2. Miner Outflow (Top10)👉 Increasing which means Risk
3. Miner to Exchange Flow Mean👉 No dramatic change yet
First 2 are riginal metrics of CryptoQuant and the thirt one is customize metric. I usually consider CQ original metrics much more than customized ones.
In conclusion short term pullback can be expected according to first 2 metrics.

View original →I uploaded an insight approx 8 hours ago👇
https://cryptoquant.com/insights/quicktake/647eef82e926de4bebd04bb3-BTC-Short-Squeeze-Loading
To be honest I am not expecting that fast😅

View original →Bullish(Nuanced)6/6/2023
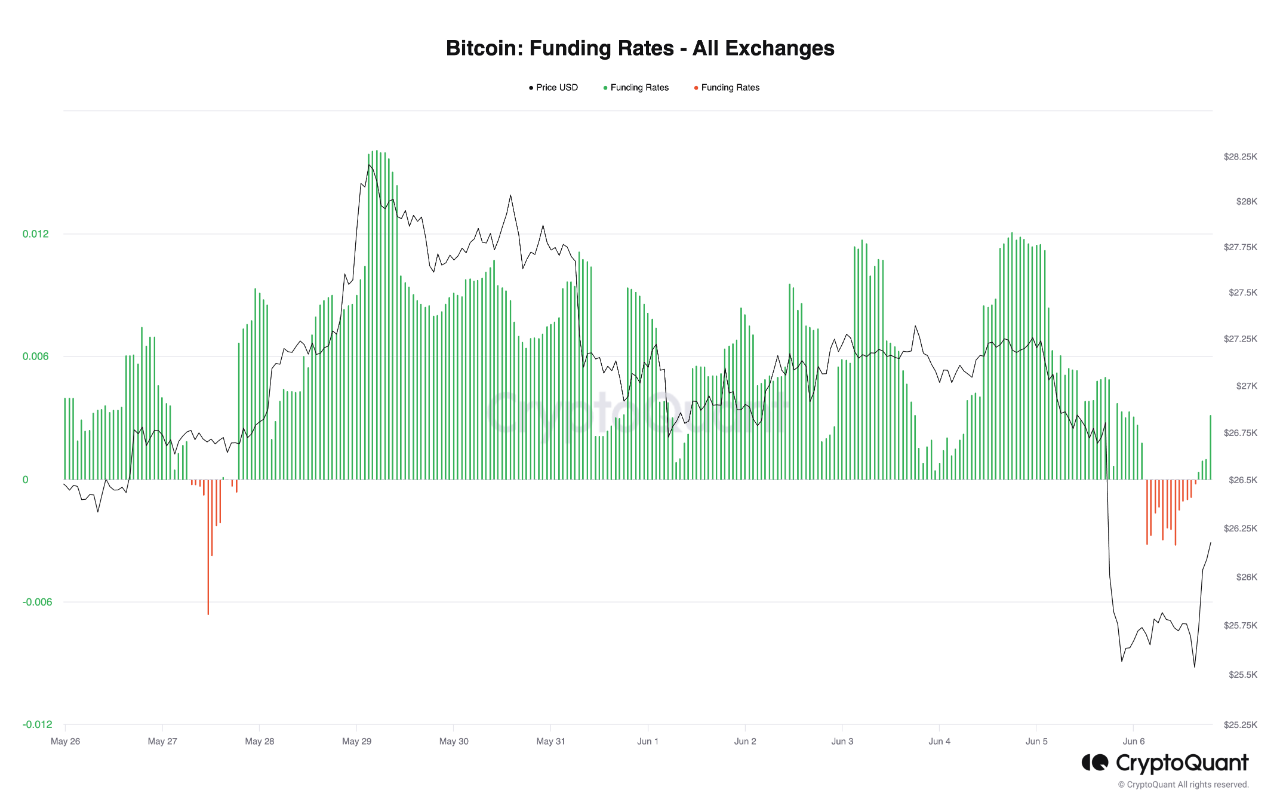
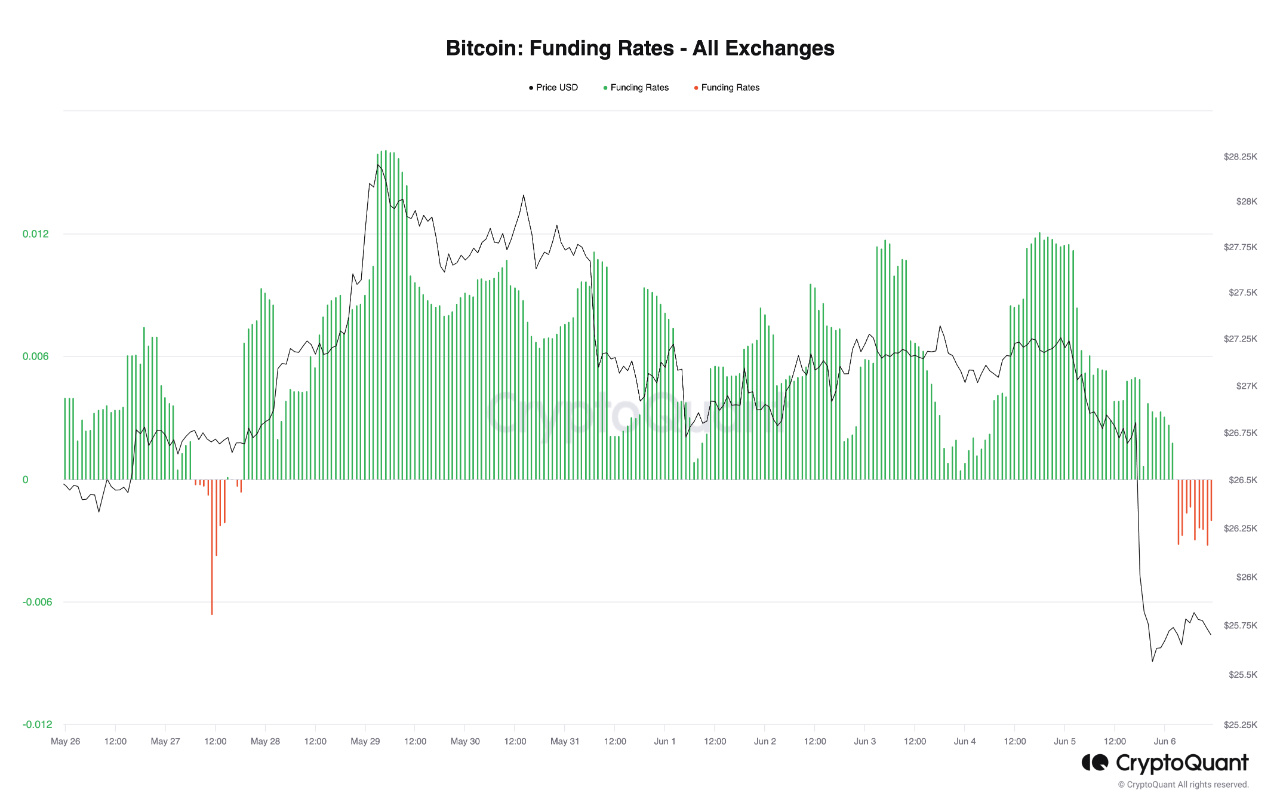
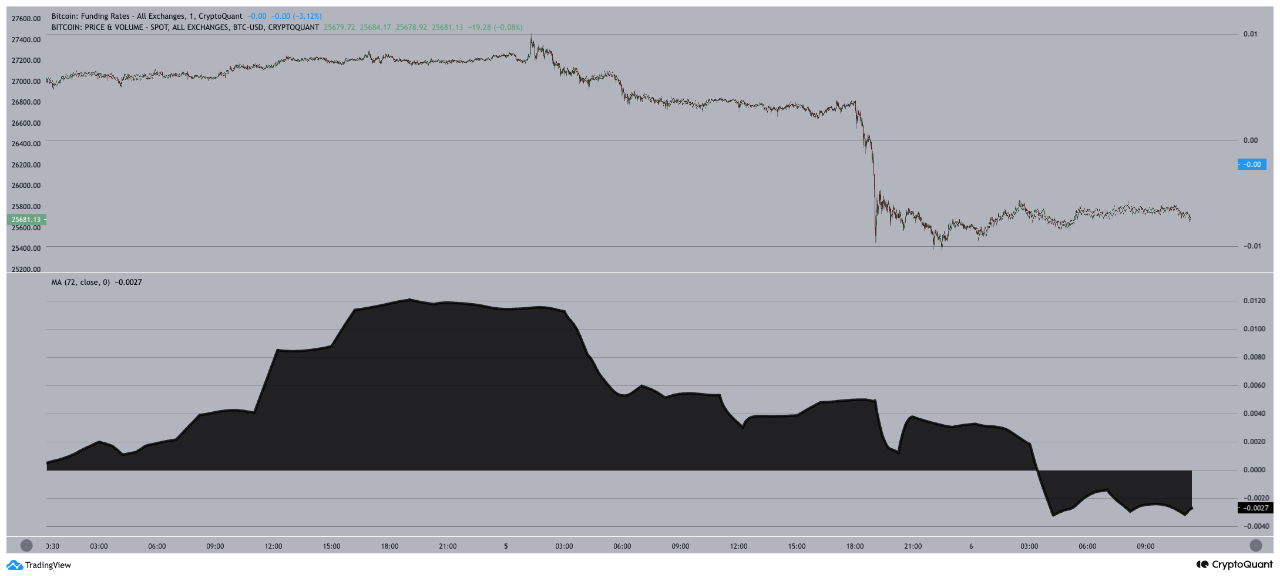
Retail Investors Short Positions have been increasing dramatically for hours as expected
It's too soon to decide but we know how this reactivity ends
25000 USD could be tried then probable bounce should be supported short squeezes
We will see 🤔

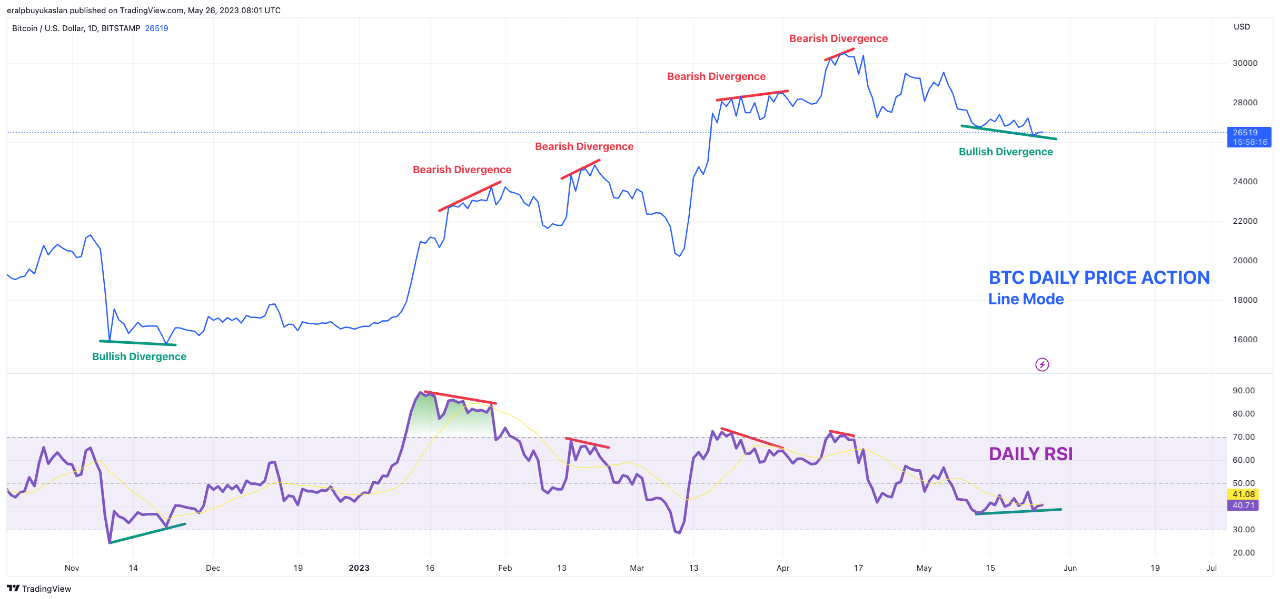
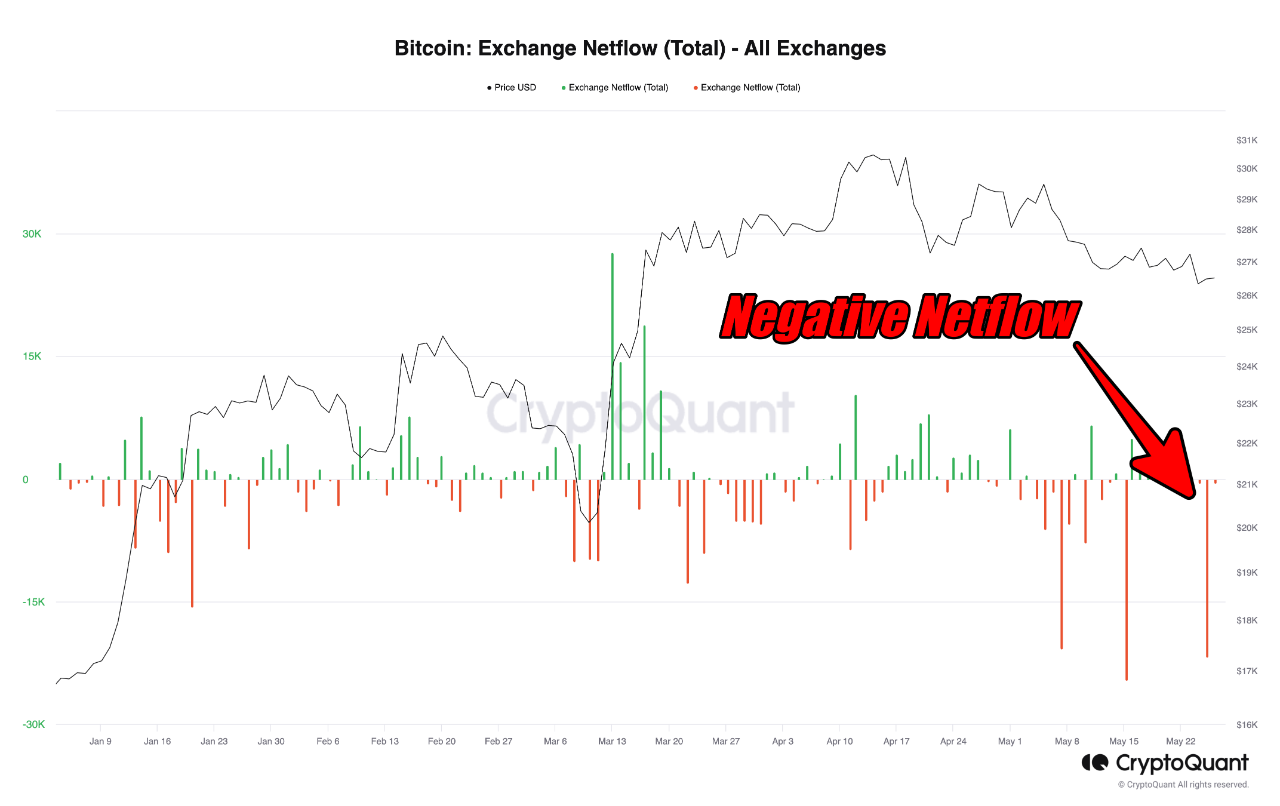
View original →There is a Bullish Divergence on BTC Daily Chart
If you checked Bearish & Bullish Divergences since Nov 2022; you can see harmony between divergences and BTC Price Action
That divergence also supported with Negative Exchange Netflow on 25th May

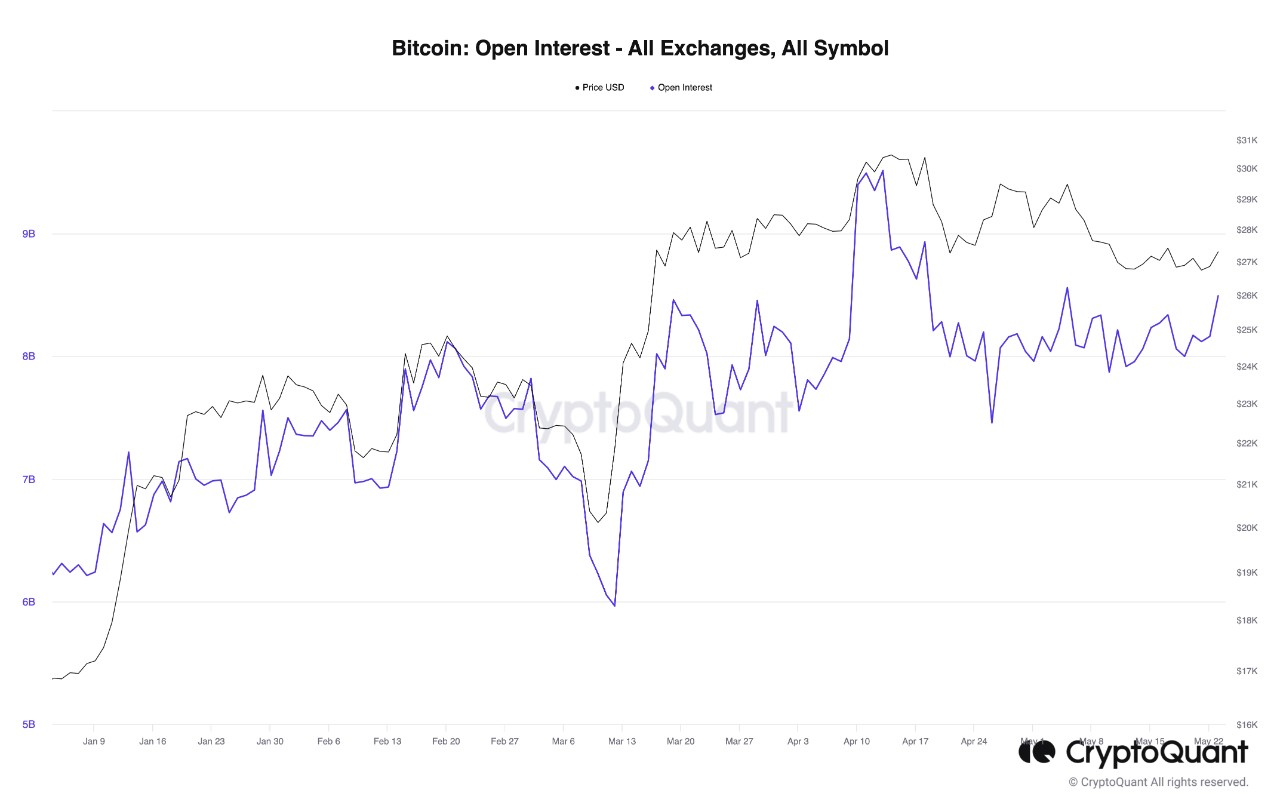
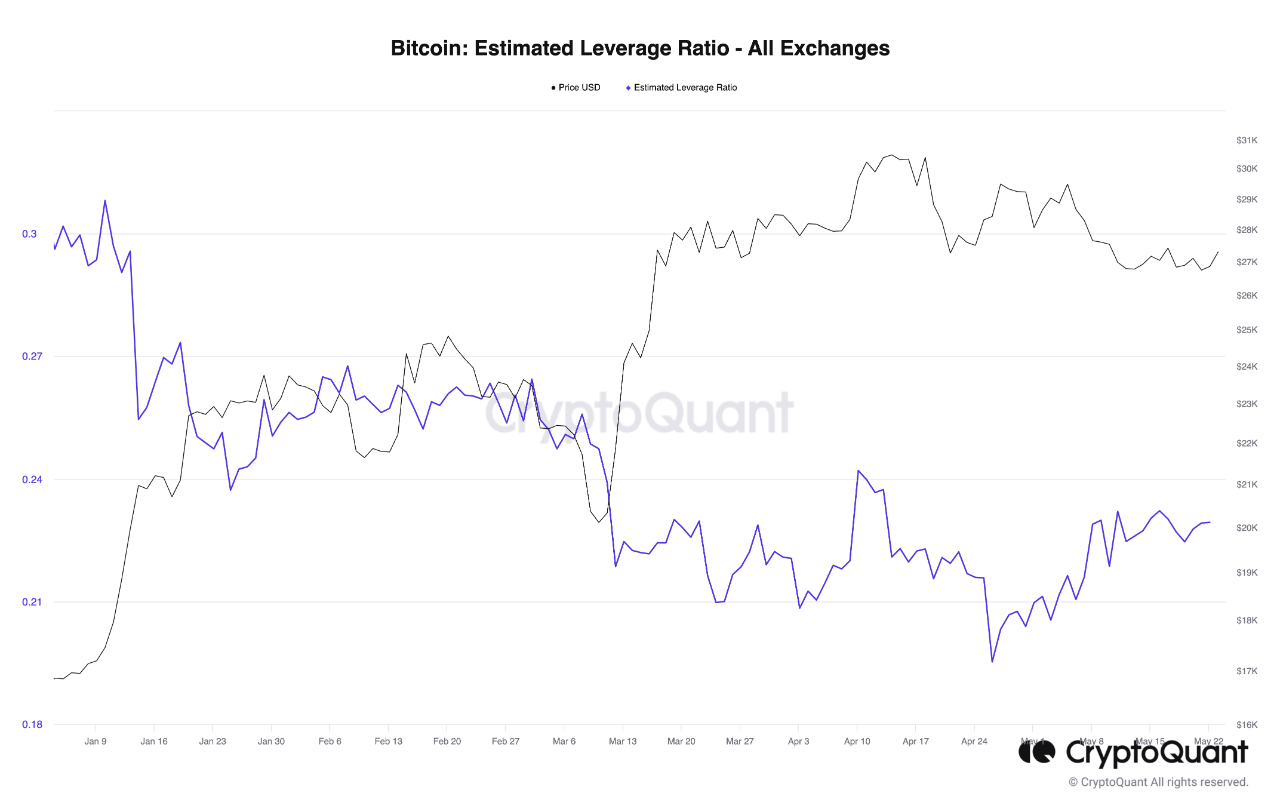
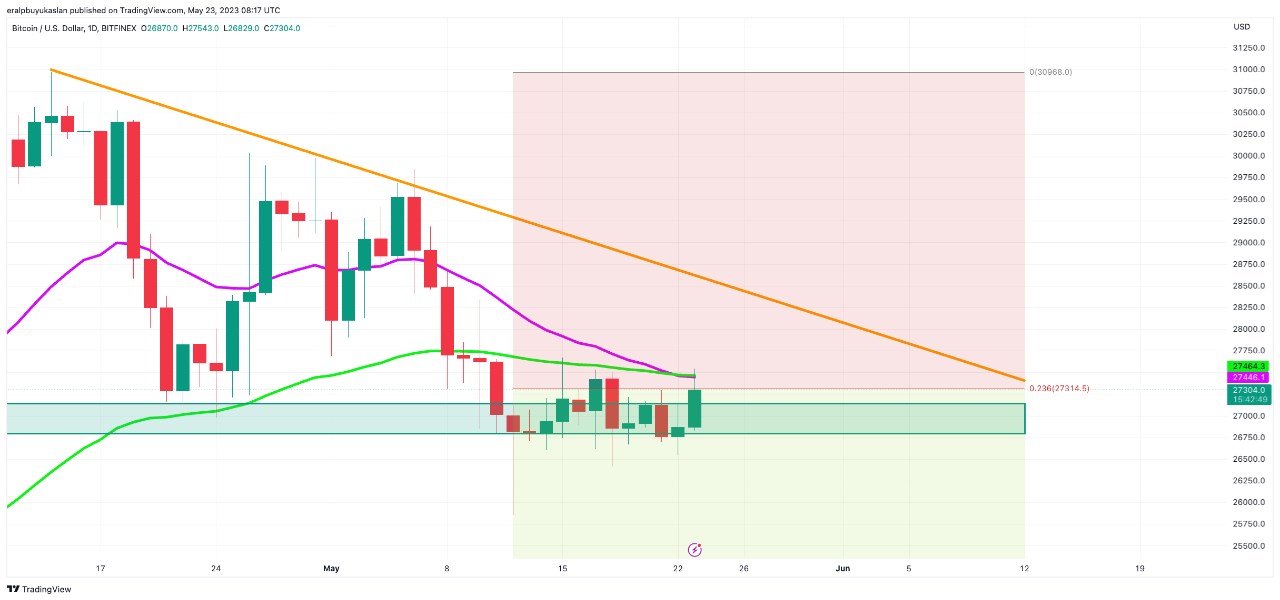
View original →✅#BTC at Daily EMA resistance
✅Open Interest High
✅Leverage Ratio High
✅Funding Rate Highly Positive
⛔️That signs warn high leverage long positions❗️So be careful If you have been holding huge leveraged longs.


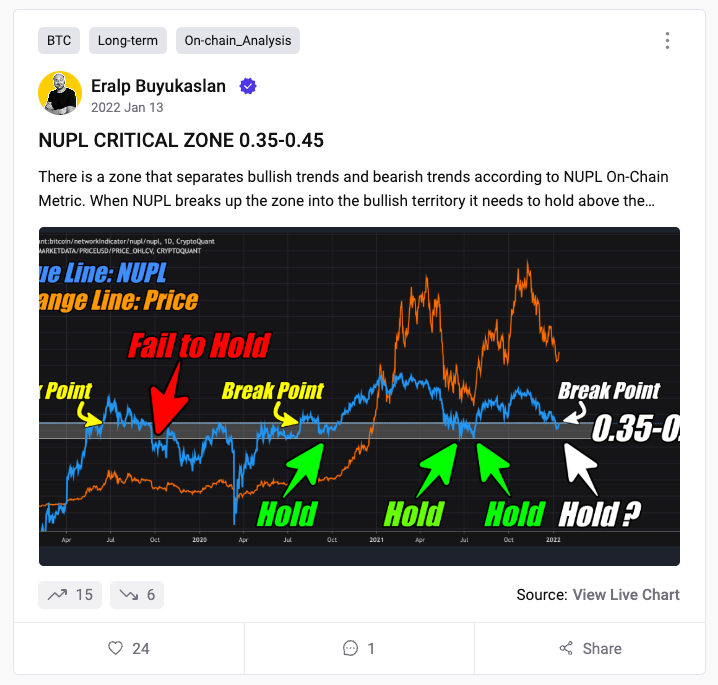
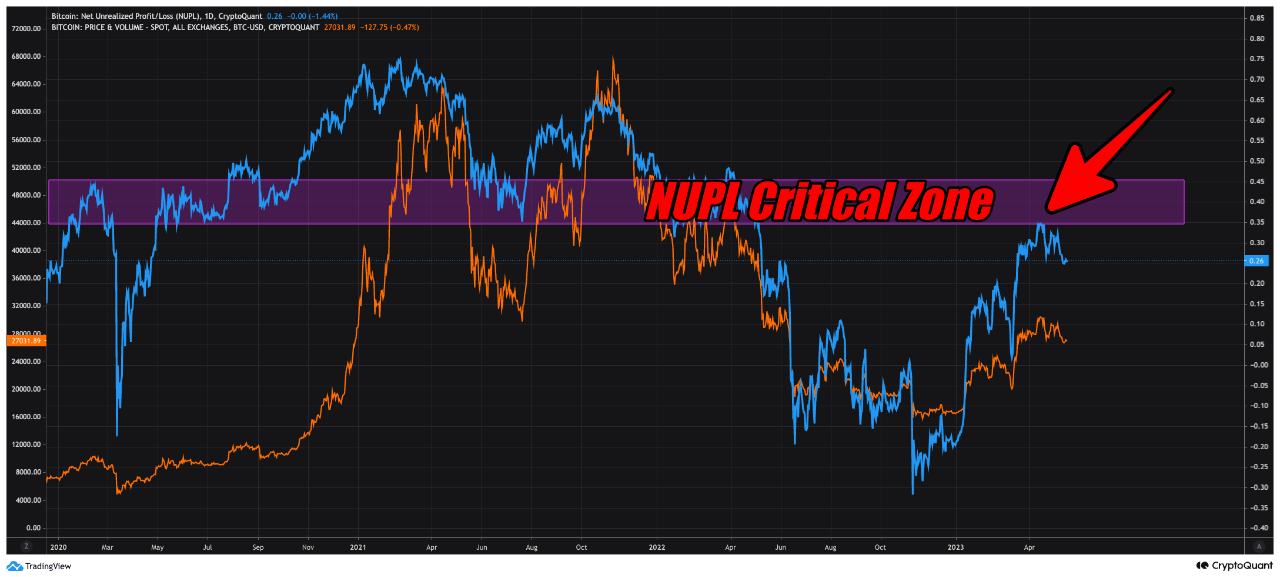
View original →I shared my Critical NUPL Zone theory on 13 Jan 2022 for the first time on Cryptoquant Insights.(Photo attached and link below)
First insight related NUPL Critical Zone👇
https://cryptoquant.com/insights/quicktake/61e0311e4d9f2163ecb8635e-NUPL-CRITICAL-ZONE-035-045
🔴You can find theory details in above mentioned link please check. I dont want to repeat myself.
That theory main purpose is understanding Bullish and Bearish trend via NUPL.
We all want to be in Bullish Market but we need pass through that critical zone first.(Off course market is not up to this specific metric. We need to see multiple signs in TA, FA, OC etc..)
⛔️Please check NUPL resistance on April 2023 at attached photo

View original →

