Bearish(Nuanced)BTC
2/17/2025 Since the last high on September 16th until the present, Bitcoin has been in the loading phase. Its dynamics tend to follow this pattern of aggressive rises and consequent lasting corrections.
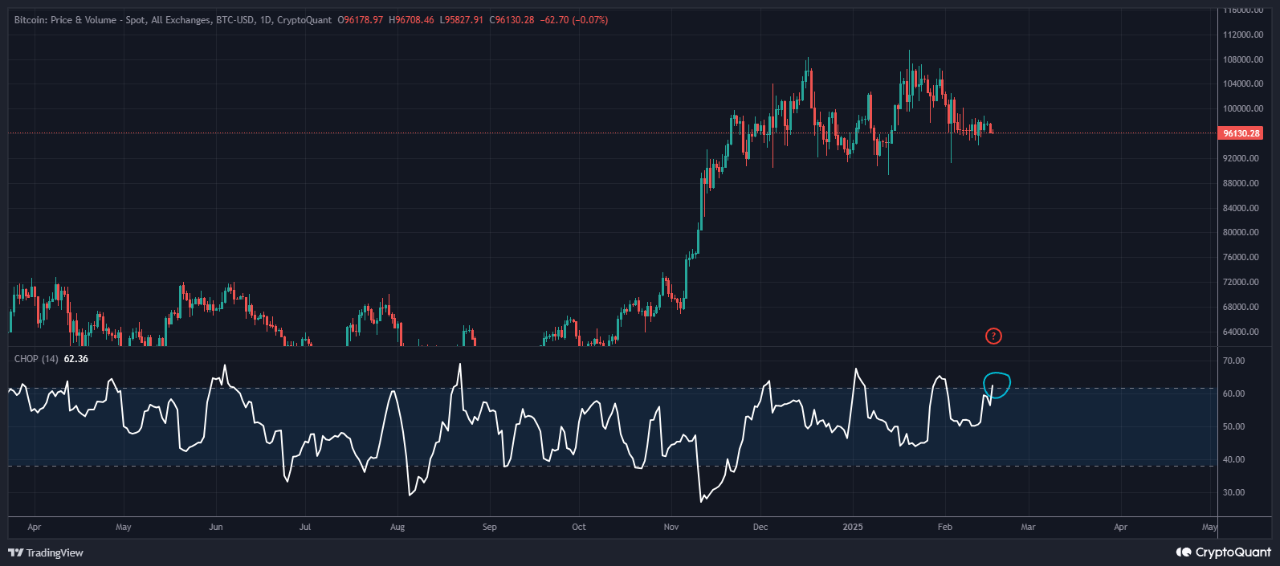
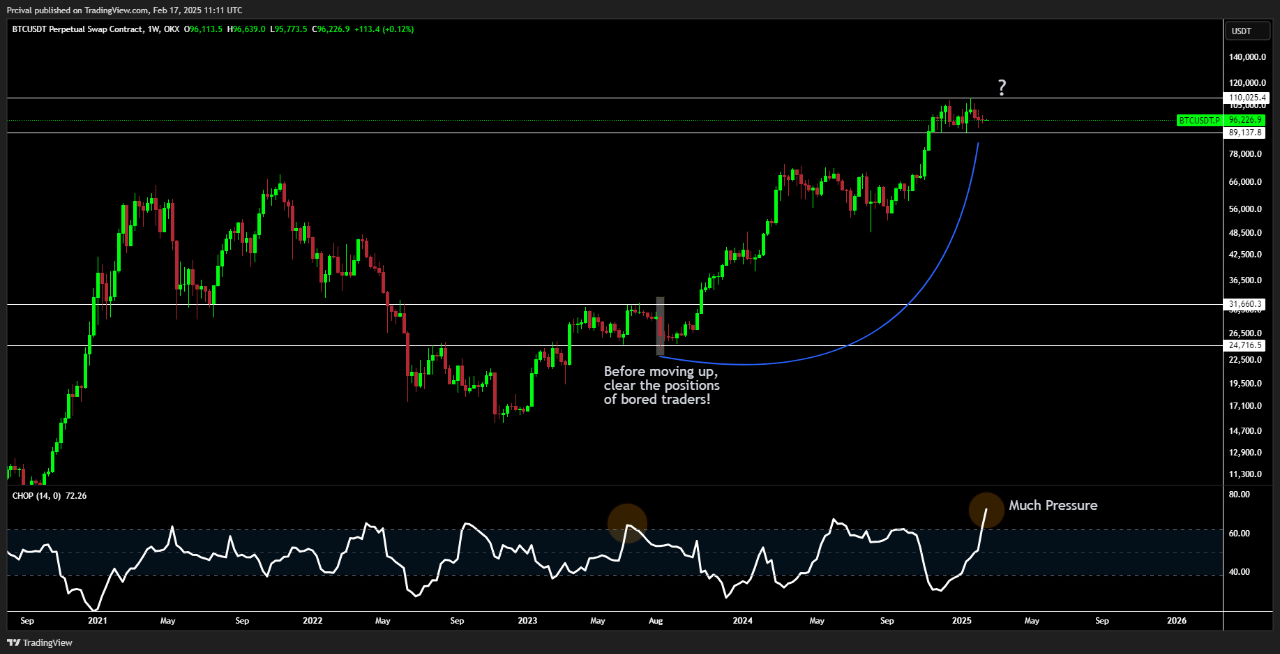
Our Choppiness Index on both the daily and weekly charts is quite unstable (62 and 72 respectively), meaning it urgently needs to enter a trend, suggesting a more aggressive movement to either side of the box. Evidence of this pressure is the 90-day range that Bitcoin has found, with fluctuations ranging around 16% from the maximum to the minimum of the lateral range.
The same case happened in August 2023, which preceded more explosive upward movements, but even before they happened, the price cleared all traders of “boring” positions in the opposite direction due to low volatility, a good way to shake up the market.
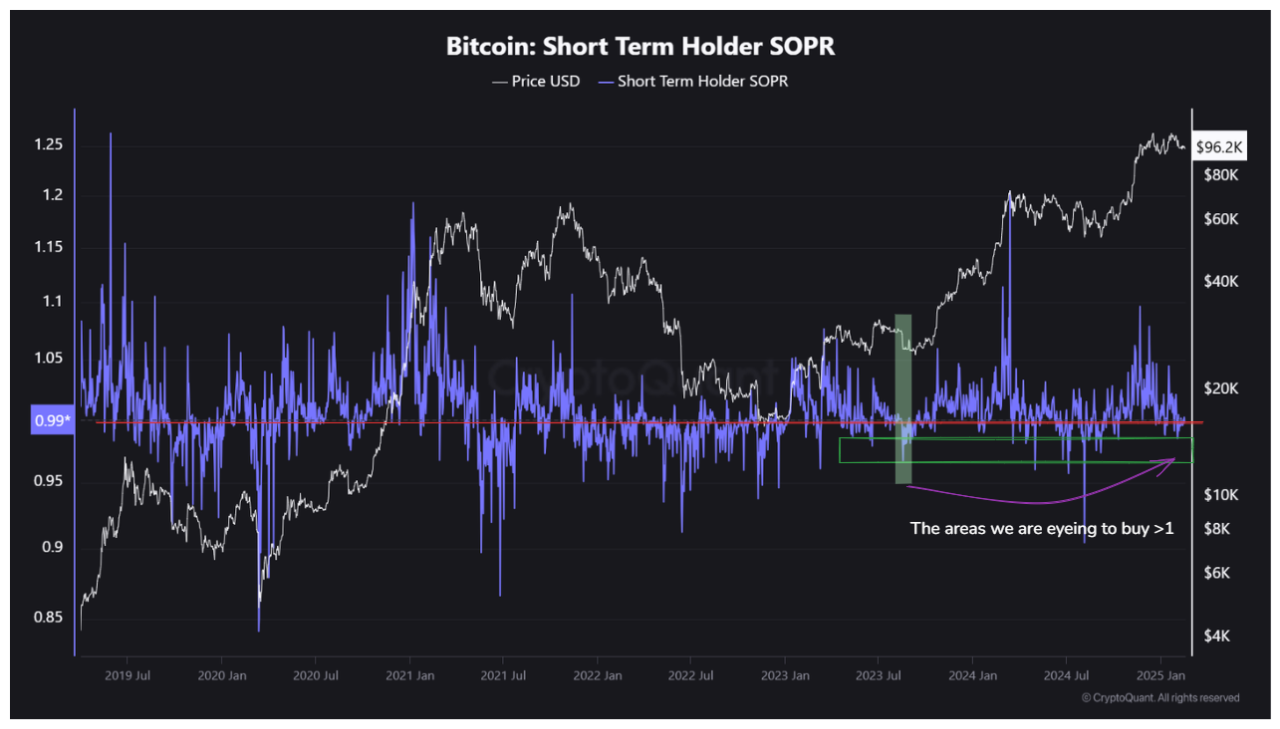
Looking at the short term, the short-term SOPR is in a balance zone below 1, but compared to August 2023 we have a test zone at 0.97, currently at 0.99 (still without fear in the air) highlighting the possibility of sudden movements up and down causing liquidations and some short-term panic.
Our first floor will be the Short Term Holders Cost Base located at $92K, if the buying force is unable to fully sustain this attack then the ground floor will be located between $80K and $89K, coinciding with the EMA 200.
The possibility of false moves before the bull run is strong, many breakout traders are positioned in these zones, and the sovereign market tends to blow up these positions and return to the expected course!

View original →So far, Bitcoin's structure has had the structural dynamics of a mature asset, with upward spikes and consequent consolidations that, for many, become "distressing." Bitcoin has a $2T Market Cap and is the sixth most potent asset among the world's fiat currencies (among the sharks, it is only worth 0.2% of all of them!)… Impressive!
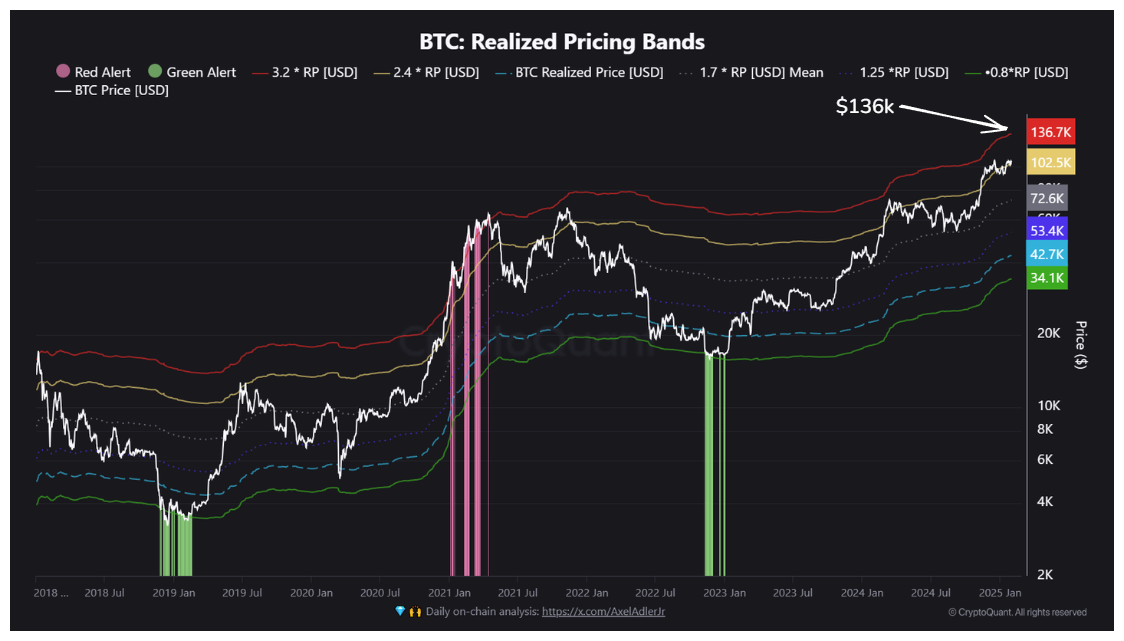
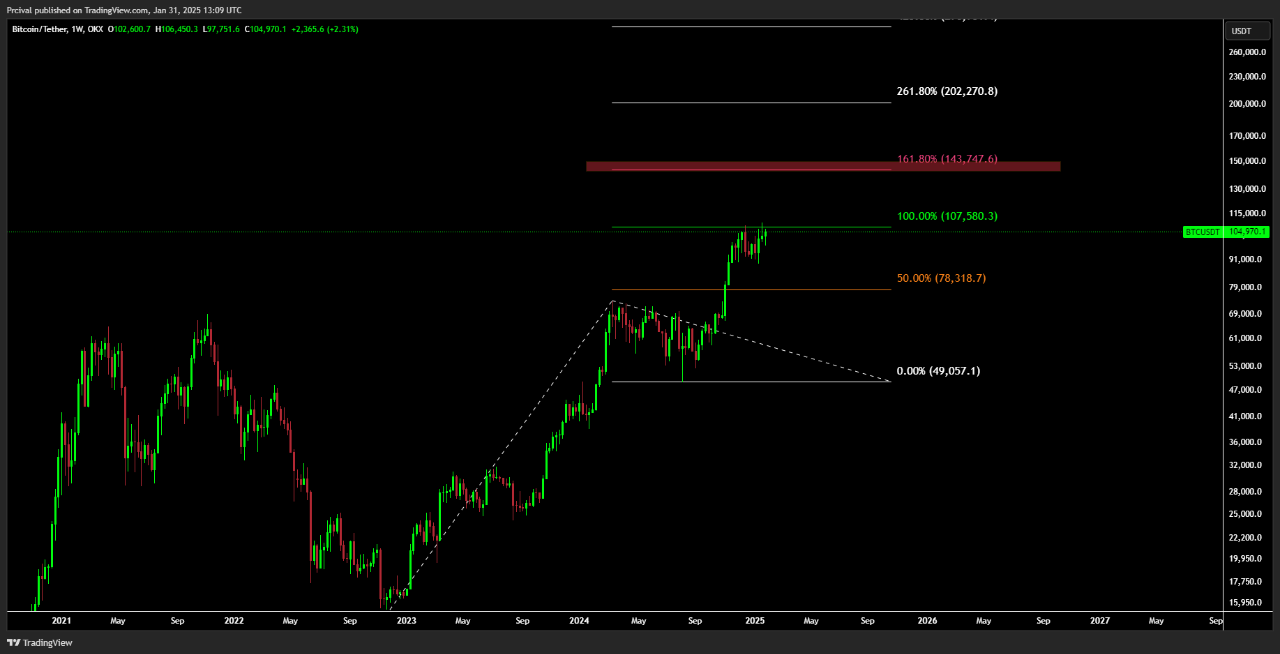
By tracing a Fibonacci Expansion from the bottom in November 2022 ($15,450K) to our consolidation in 2024 ($48,934K), we demarcate a target between $136K and $150K, converging with the Realized Price Bands metric, which shows us the same picture regarding the money that was invested in Bitcoin (ex: I have 1 BTC bought at $50K and I will sell at $100K, means a gain and net inflow of $100K in Bitcoin), it becomes a good gauge for the next resistance in Bitcoin.
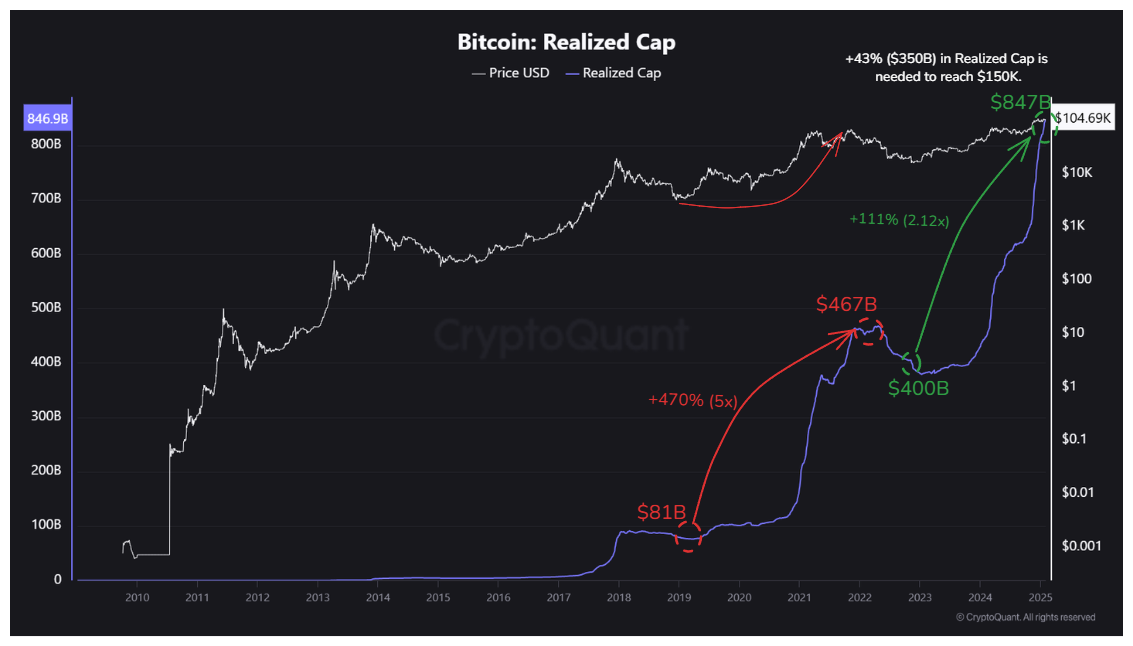
To reach these numbers, Bitcoin will have to have an MCap of around $3 trillion "($150K*$2.08T)/$104k = $3T)". In the 2021 cycle, the Realized Cap increased to the ATH 470% (5x) since the bearish cycle; in the current cycle, the Market Cap increased only 111% (2.12x), still with room to grow compared to 2021. Therefore, with a Bitcoin price at $150K, the Realized Cap would be approximately $1.21 trillion (an increase of $350B and 43%).
Possible Impulses:
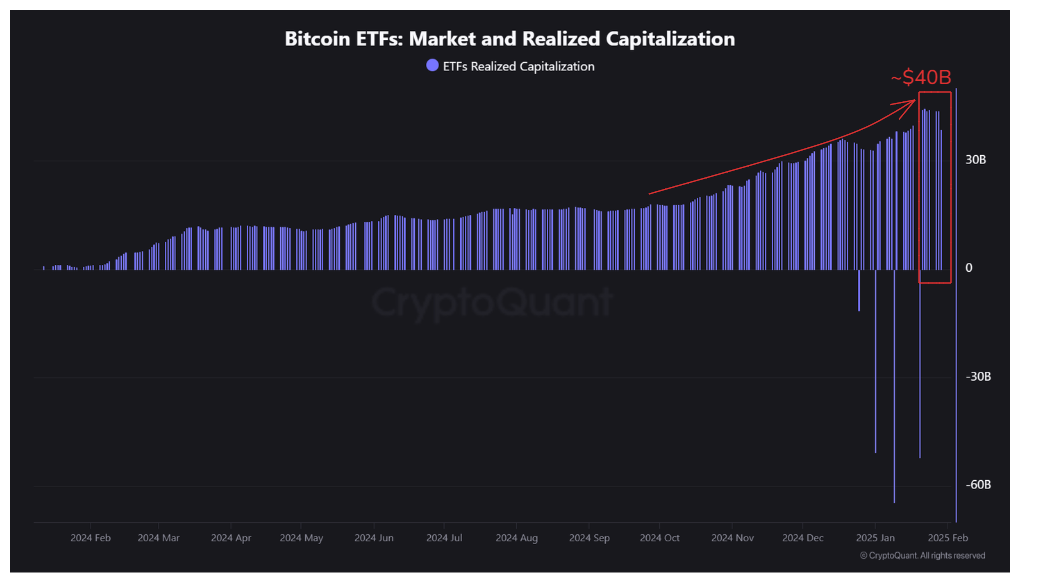
ETFs—Since launch, the Realized Cap ETFs have received ~$40B in infloch, representing only 4.7% of the Realized C. To get something close to $35,0B, they would have to enter more than 7x the current number. That's a lot of liquid capital!
- The Bitcoin Futures market has an aggregate value of $95B, representing 11.45% of the Realized Cap. That is, to reach $350B, they would have to do 3.7x. With the FOMC and the market overheating, no, it is impossible.

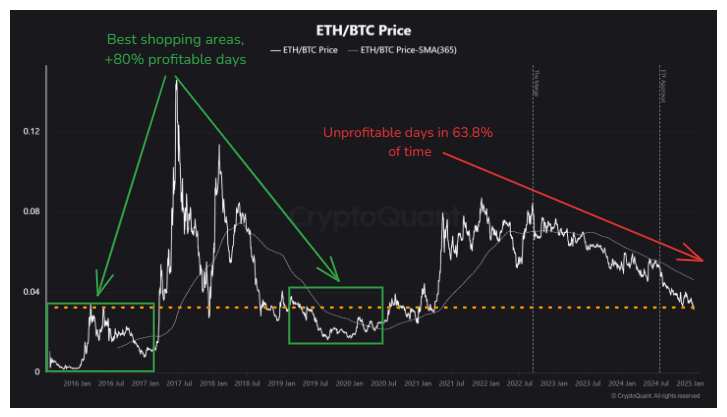
View original →With the new Trump administration, the clarity of friendly regulation seems more present than ever. Bitcoin follows its course separately from altcoins, a differentiated economy. On the other hand, Ethereum has been going through several internal problems in the EF. All these obstacles have made the ETH/BTC relationship become a “horror.” Today, Ethereum has returned to 2016 levels, where 63.8% of all Ethereum trading days are Unprofitable Days.
In other words, anyone who bought Ethereum in 2016 and at the bottom of 2020 can now have profitable days compared to Bitcoin. Ultimately, Ethereum needs to “bottom”; otherwise, sentiment and speculation will go crazy.
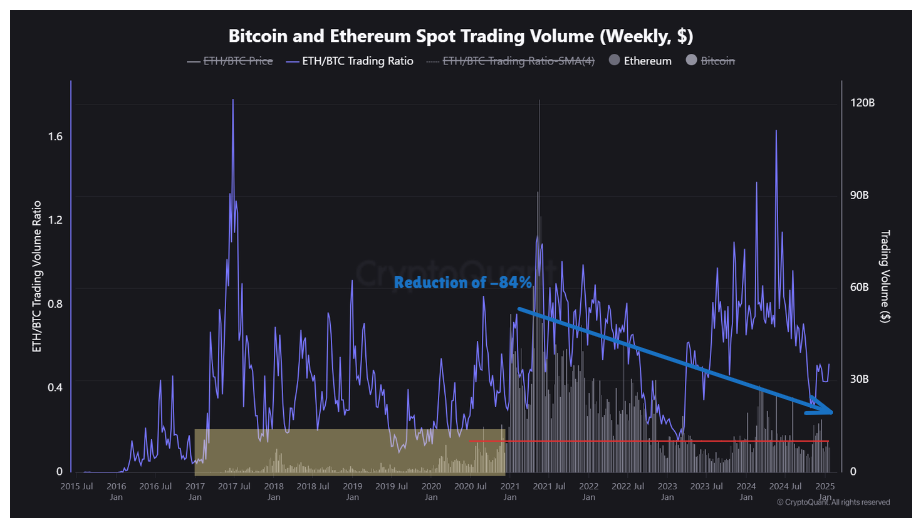
When we look at spot market transactions, we see a sharp decrease since the 2021 cycle. They are currently at just $8B compared to $52B in January 2021, midway through the bull market. This means that the demand for Ethereum in this bull market is considerably lower, with a reduction of around -84%.
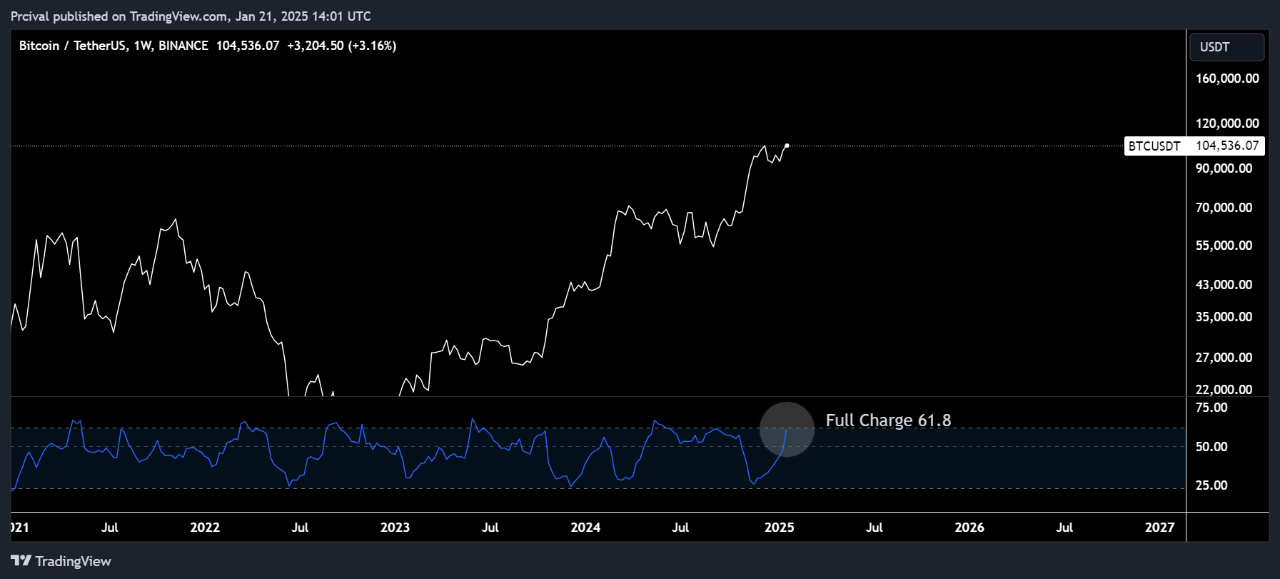
With macroeconomic events, Bitcoin could react positively, but looking at the majestic Choppiness Index, we finally see the fuel tank almost at its maximum strength to continue the trend. With a value of 62, the market says the trend needs to start urgently. At the end of the year, in the article (https://cryptoquant.com/insights/quicktake/675313ee1b7d5223665eeadc-After-the-wave-of-100K-liquidations-the-structure-remained-the-same-the-next-zon) I predicted weeks of consolidation needed for loading… there was this movement!
The current market structure allows us to say that Bitcoin wants to continue its upward trend in the coming days.

View original →Bullish(Nuanced)BTC
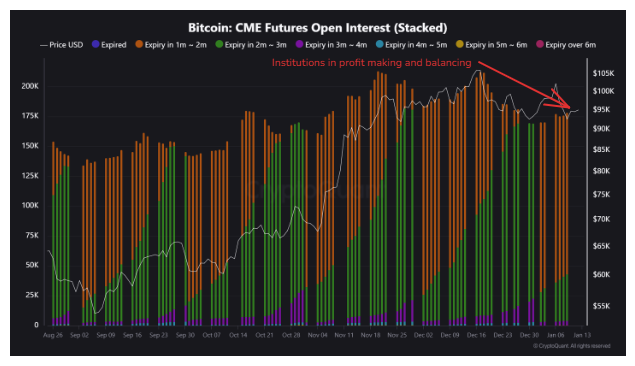
1/12/2025 All investors in previous cycles know that Bitcoin's seasonality is a fact in the last months of the year. Eventually, increased pressure on the sell side extends into the first month of the following year. They see Open Interest decline by 13%, with a large majority coming from CME (profit-taking institutions).
Likewise, Bitcoin ETFs will see a net reduction from $14 billion/month to $6.6 billion/month, thus continuing in good shape and with significant inflows, which helps to sustain Bitcoin at the $90,000 support. Until the spot market, the selling pressure in December was enormous, with $-200M/day. On the other hand, in January, we returned to the neutral line… a topic demonstrating the strength of Bitcoin in not wanting to fall any deeper!
Which direction is most likely?
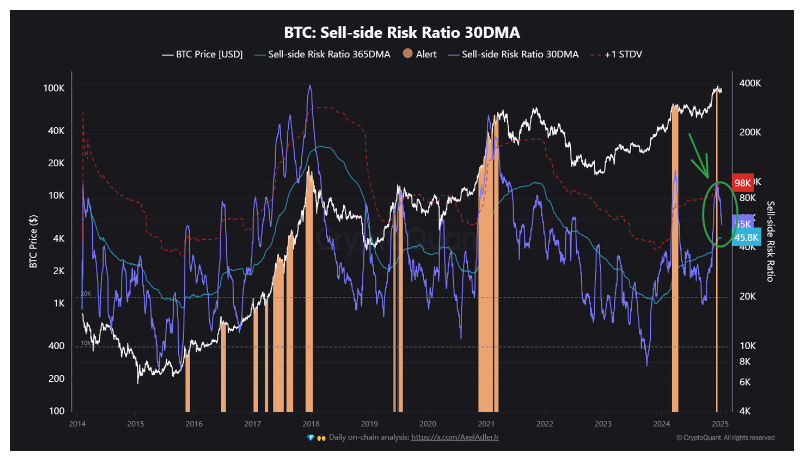
Looking at the demand side, a slight slowdown in on-chain volume is noticeable, but it remains at a healthy $12B in most exchange inflows and outflows. Looking at the risk on the sell side, you are already in a more balanced area of 0.0012; that is, the selling pressure is falling at generous steps (since Nov with 0.006), zooming out short-term investors see the risk on the selling side, completely in balance, a great sign that STH do not see realized losses that bother them (the level of loss today is bearable).
The odds favor the $90K floor, but beware! There is a gap in the STH MVRV between 1.08 and the average at 1 (STH cost base $88), and this difference can become the “breathing space” for an eventual external scenario, zeroing the possibility of going deeper!


View original →Bearish(Nuanced)BTC
12/28/2024 In the final stretch of 2024, Bitcoin is within a consolidation range at $94K. In addition to still strong selling pressure from Long-Term Holders gifting other people their Bitcoins, the buying pressure to levitate in this channel for a few more days is impressive.
Looking at the Sell-Side Risk Ratio, a metric that shows the balance in high-value zones when currencies are trading with huge profits compared to when they were first purchased, in this case, it is heated with high selling pressure, but not to the extreme.
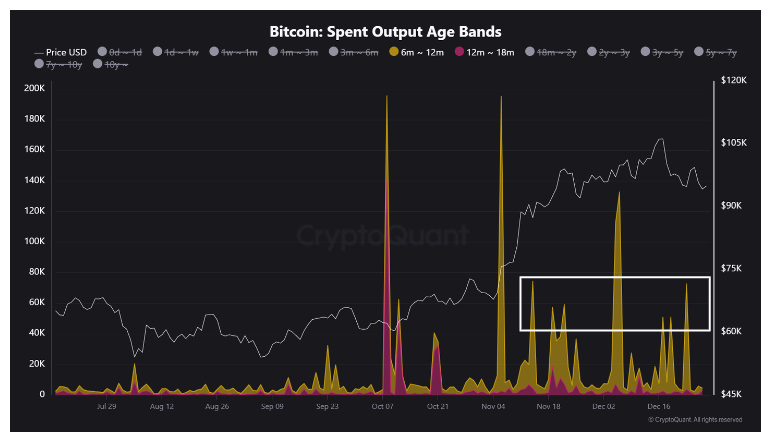
To better understand the selling pressure, it is necessary to look at the short term as coins older than 6 months are the ones that move the most, on average between ~50K and 58K BTC/day, values that have remained stable since November. The STH supply is 5.4M BTC, today there are around 2M coins held in loss, percentage-wise I would say that only 16% are in unrealized loss, a calm number for a bull market with corrections along the way. (I don't think this is our market top, objectively I needed to see a dominant number to think about a bear market).
Is it still possible to fall lower?
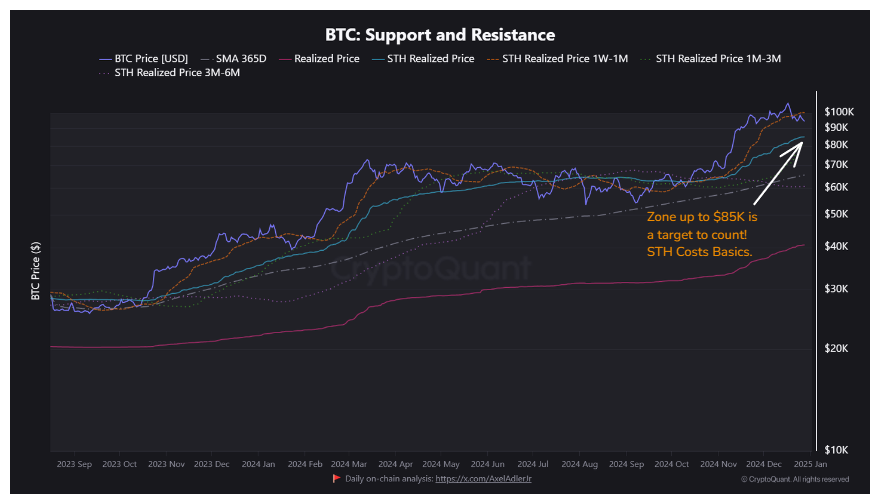
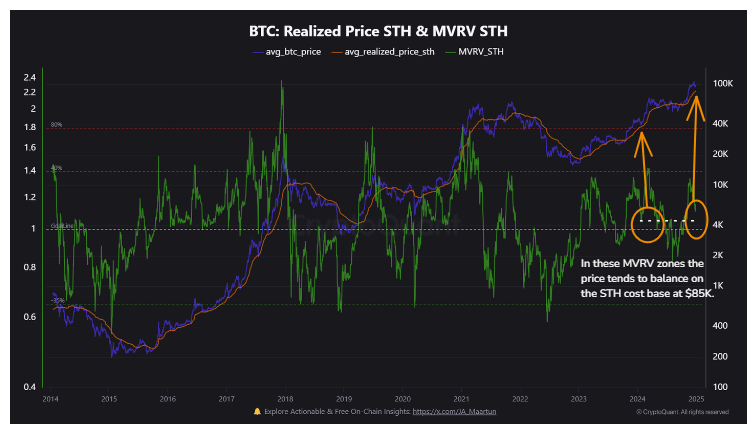
Eventually yes! If you analyze the losing coins, they are close to the STH cost base well situated at $85K, which shows this to be a target to be beaten. The MVRV still converges with the cost base, as it is still in a heated zone (1.10) of “caution” for the short term and has room to go down a little further where we can “happily buy sats at a lower price”. The selling pressure continues and at this time of year with adjustments in institutions, it may be necessary to sell and start 2025 on the right foot!

View original →Bullish(Nuanced)BTC
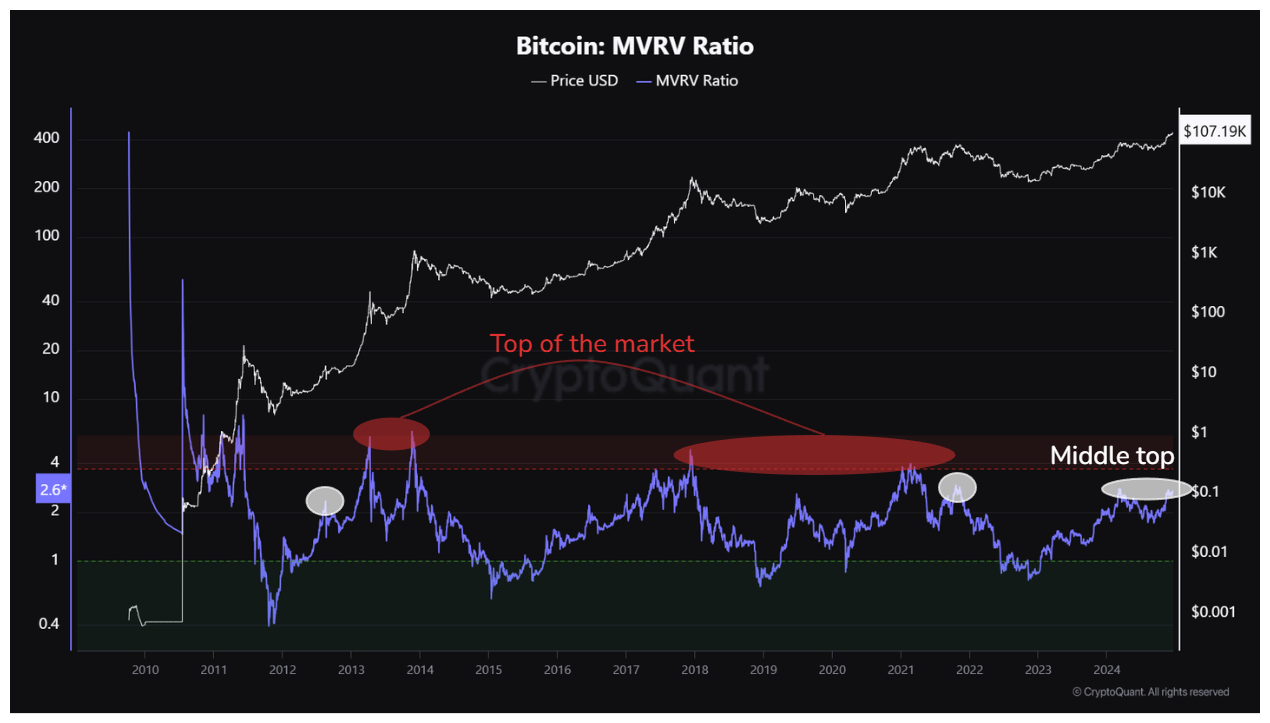
12/17/2024 Zooming out on Bitcoin through the MVRV, measuring the magnitude of profits, it is notable that it stabilized in an “intermediate top” zone at 1.27, showing slight warming but still with much room to reach the top where we will find extreme euphoria.
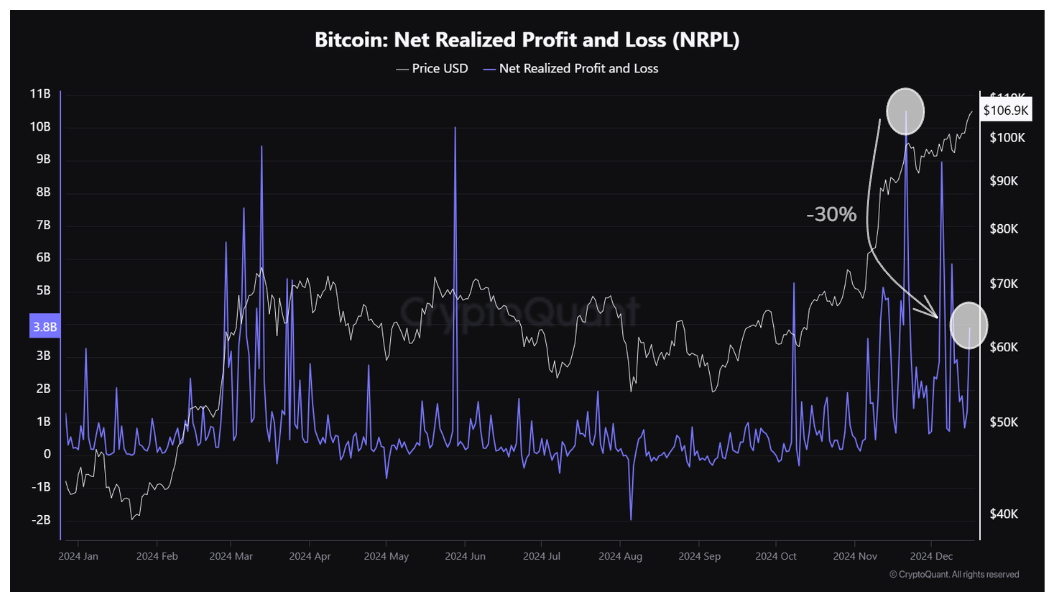
Through Net Realized Profit, a derivative of Realized Cap that also measures the magnitude of profits, there is a slight cooling from $10B to $3B, a drop of 30% compared to November, the reduction suggests a positive sign for the market reducing supply and selling pressure. This means that LTH has realized most of its profits at this stage and is ready to see further increases.
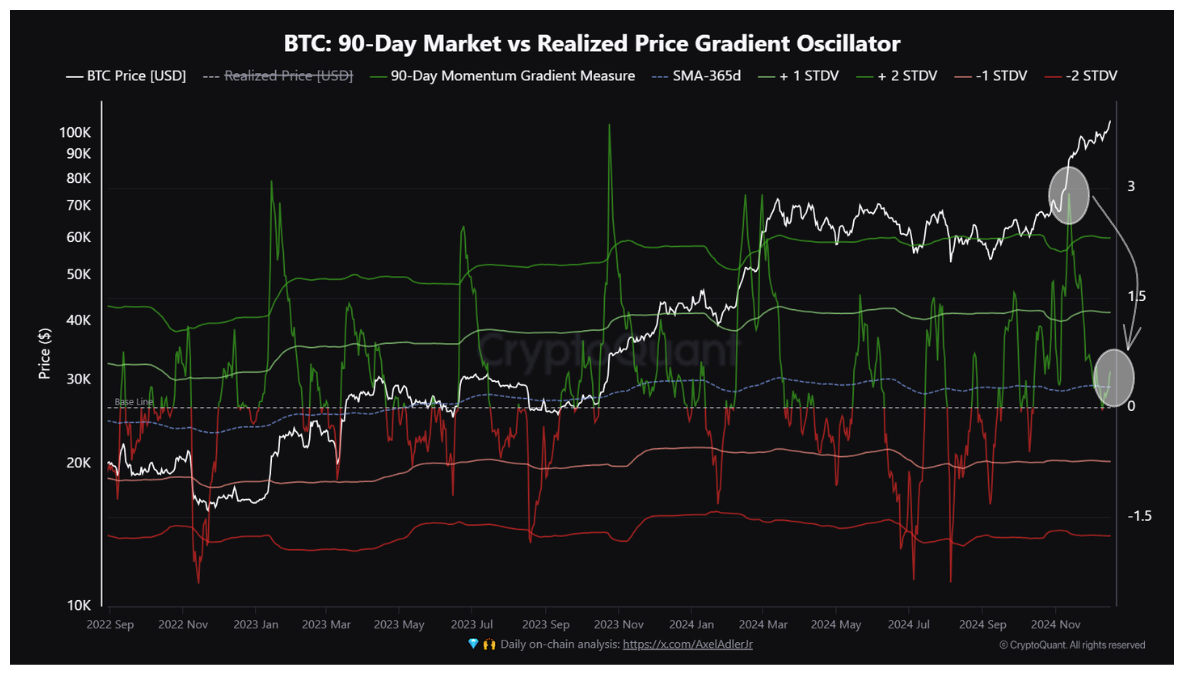
Through the 90-Day Markevs. vs. Realized Price Gradient Oscillat, we can see the difference between the market price and the realized price for 90 days. It is in an equilibrium zone of 0.5, demonstrating a strong balance between underbought and undersold. It suggests that we could see the price in its upward phase, demonstrating an optimistic market in the short term.
The high supply that was increasing supply by $73B/month received a prompt response on the demand side with ETF inflows reaching $38B/month and aggressive MicroStrategy purchases of around $15.7B/month, around 440K Bitcoins in the wallet. Another factor for the optimistic sentiment is the US Bitcoin reserve, the Fed meeting on December 18th, and the purchase of Bitcoin by some of the mining companies such as MARA acquiring 11.78K Bitcoins worth $1.1B.
The end of the year tends to be quiet and calm but positive, our fuel tank still needs energy and therefore we cannot neglect a correction to support the rest of the climb with metrics even more balanced towards growth. Healthy market at this point!

View original →Bearish(Nuanced)BTC
12/6/2024 $100K was the target of many traders who put themselves in this trench to surf $200K, but the market was extremely hot. Financing rates reached a momentary peak of 70% and were later reduced to the current 15% (0.0067).
The liquidity positioned on sell as resistance was aggressively high and once reached we saw longs positioning themselves with high liquidity to start the bull rally, it turns out that again the price suddenly fell below the $93K floor triggering long liquidations in the house of $277M.
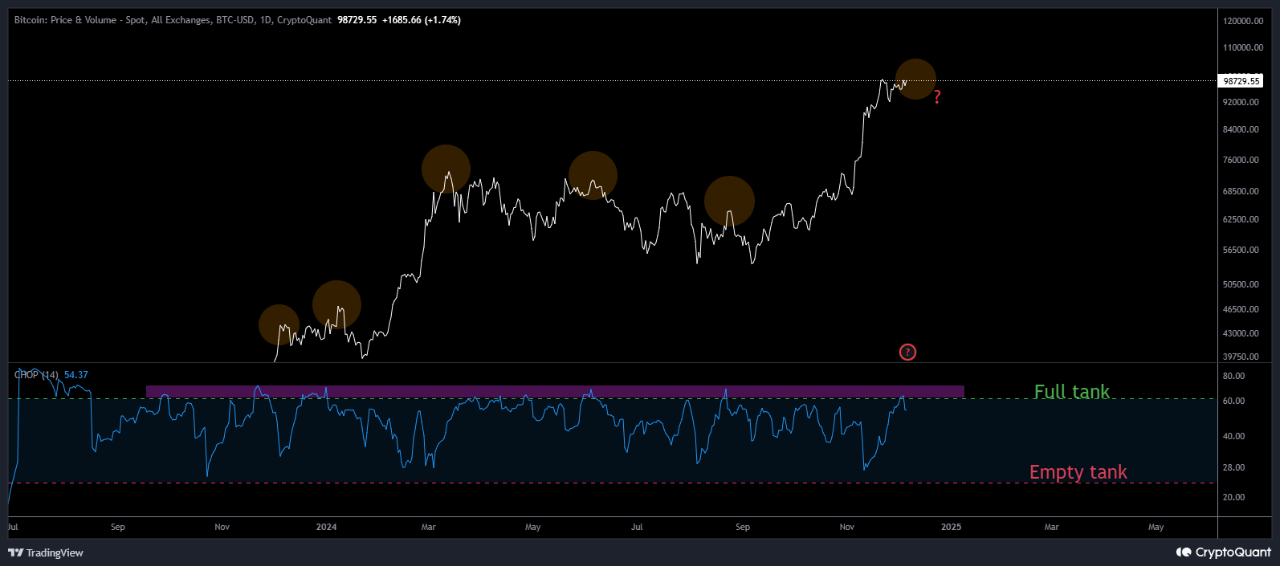
Separating this noise from imbalance, it is visible that Bitcoin's weekly strength is still worn out (index=28). Therefore, consolidating over time becomes the most acceptable option. Monthly, on the long-term scale, it is at a good energy point to continue this bullish rally.
- The 14-day Choppiness Index is in an early zone showing corrective moves during consolidation. With the joint analysis of **weekly+14D**, it is notable to consolidate in the short term so that the power of the weekly gain for the next wave of growth. One thing to take into account is the time factor of consolidation, in the 2020/2021 cycles there were 20 days of downtime and in the consolidation since March the average decline was ~20 days.
“The greater the consolidation, the greater the rise”
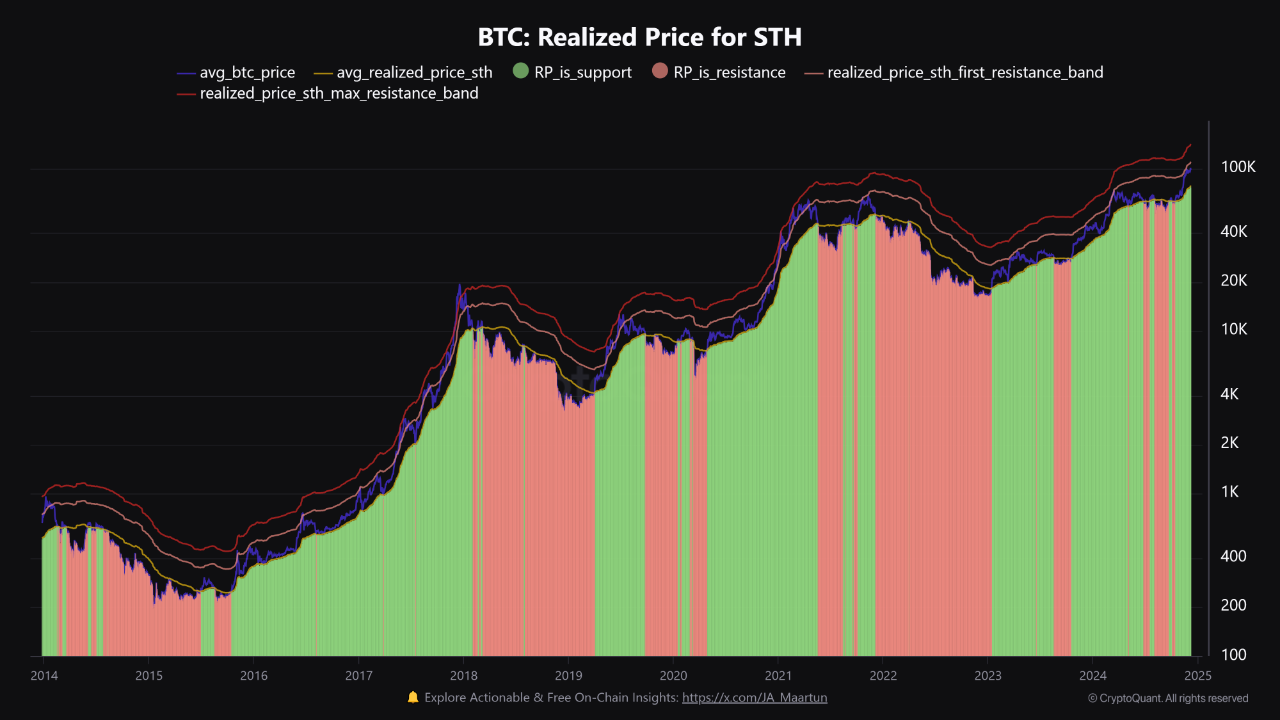
Looking at the Realized Price of STH we can market possible levels of strong resistance that we will encounter, the first level will be $110K (+1.5sd), a considerable profit zone for STH. As traders connect to psychological numbers, $120K has a very impactful psychological and emotional charge, and being a value within +2sd makes this floor a deeper consolidation camp.

View original →Bearish(Nuanced)BTC
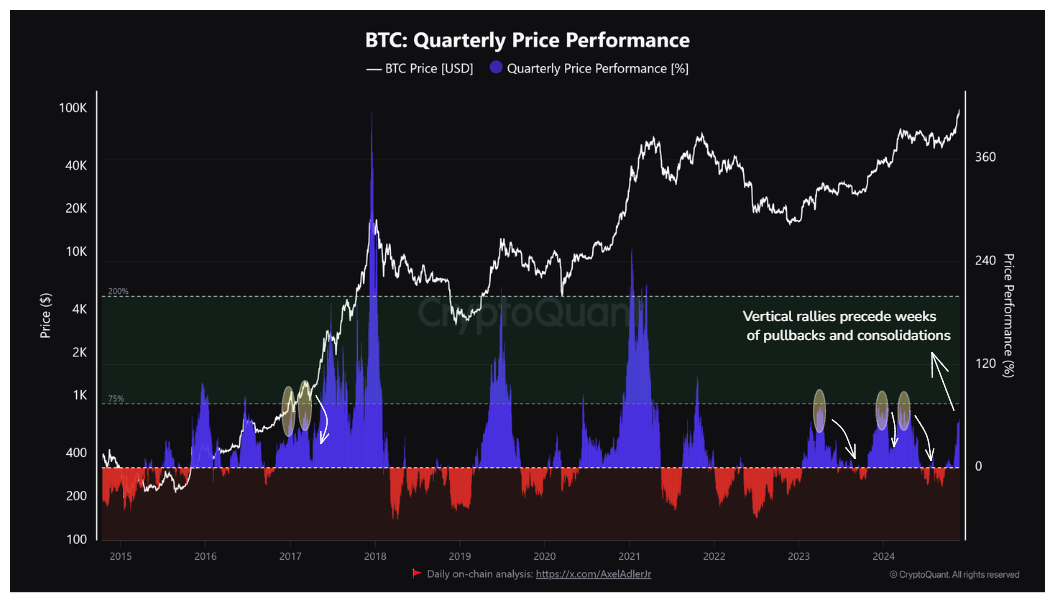
11/25/2024 As incredible as it may seem, Bitcoin was on the cusp of $100K, but we all know that traders choose numbers close to round numbers to exit positions in relative safety. From $73K to $99,800K, Bitcoin saw a positive performance of 57%, one of the 6 biggest exit rallies from consolidation zones.
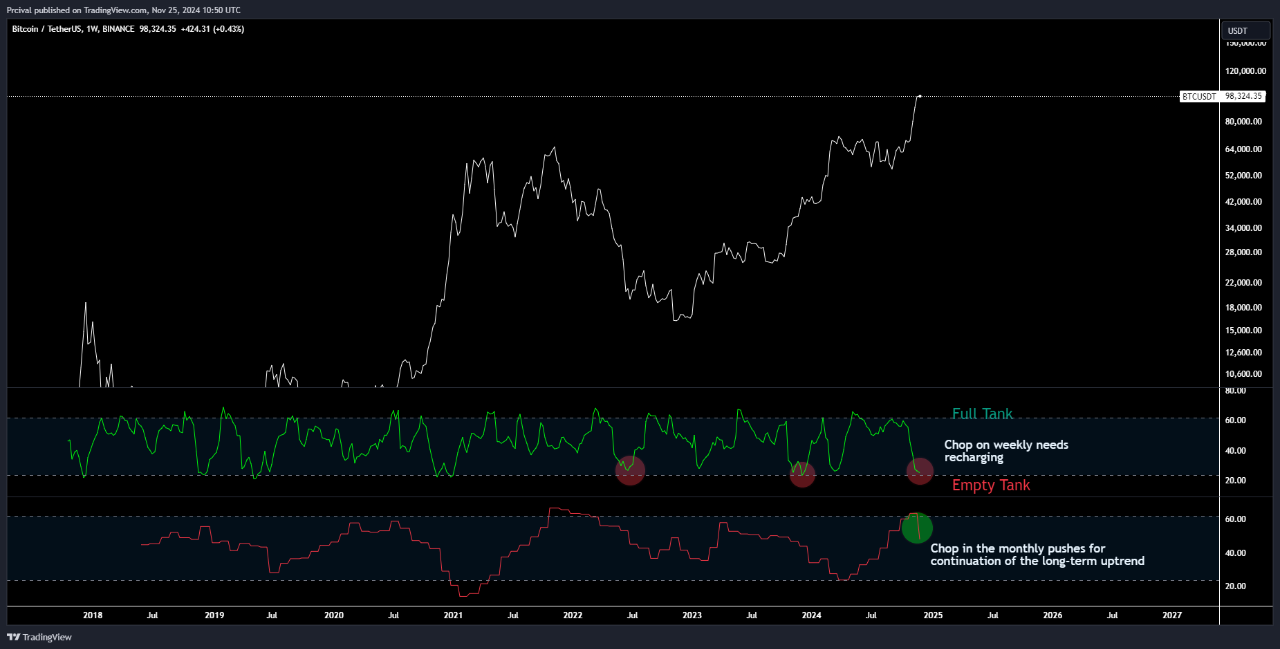
The Choppiness Index, an important metric to measure Bitcoin's strength, is already worn out on a weekly basis, which gives us indications that this $100K stage is looking for a few weeks of consolidation.
But how many weeks? Where do we prepare?
Taking into account the 2020 cycle after the exit from consolidation, Bitcoin saw its first wear on November 21st and started another rally on December 15th (3 weeks and 2 days with an 18% correction), in these scenarios we would see the next rally in the second half of December. Monthly attendance has an important role in mitigating correction.
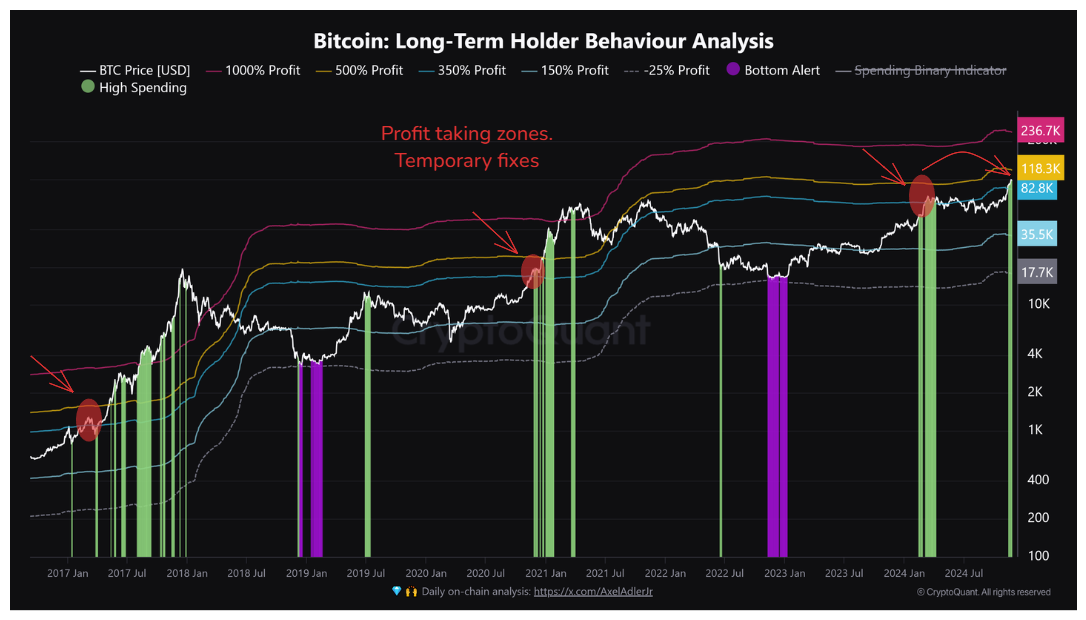
As a confluence of this stage through LTH Behavior Analysis we verified the current zone as an LTH supply distribution zone with around 350% in profit with around 575K Bitcoins ($58B) returned to the market. Still, demand has been significant through inflows into ETFs and from actors like MicroStrategy to hold all these outflows.
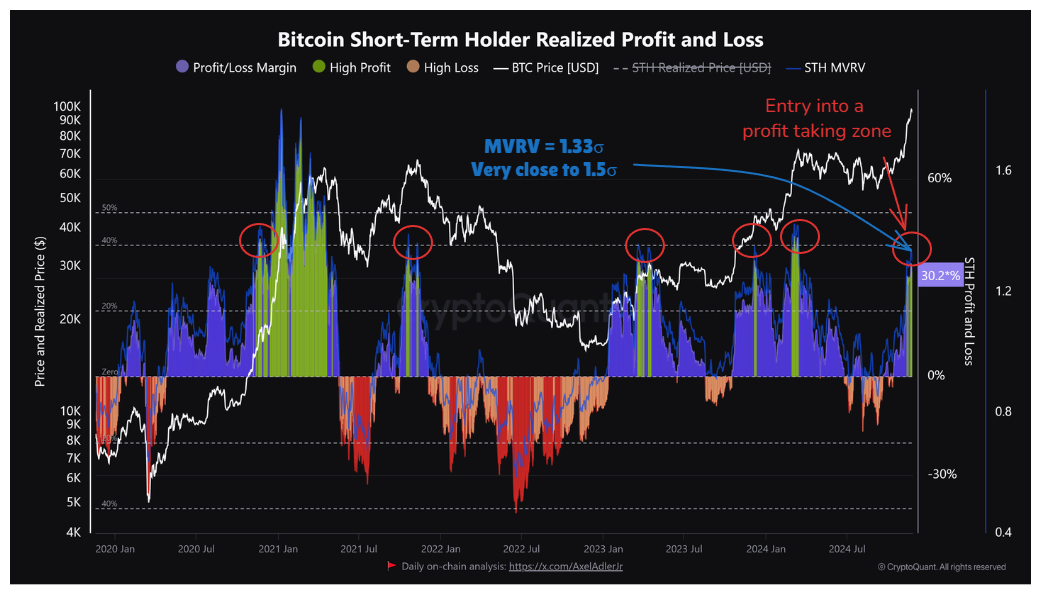
In the short term, short-term holders, using the Short-Term Holder Realized Profit and Loss metric, have the same configuration and are responsible for 30.2% of the profits obtained. Another important note is seeing the MVRV above 1.33σ indicates that the average currency is on the trail of 1.4σ (40% profit), a zone of large unrealized profits (the same zone we found in the first correction of the first vertical rally at the end of 2020).

View original →Bullish(Nuanced)BTC
11/16/2024 LTHs today do not see $90K as an enemy; there is profit-taking. Some of these investors have been here for many years, and for them, this first target would be a profit-taking zone.
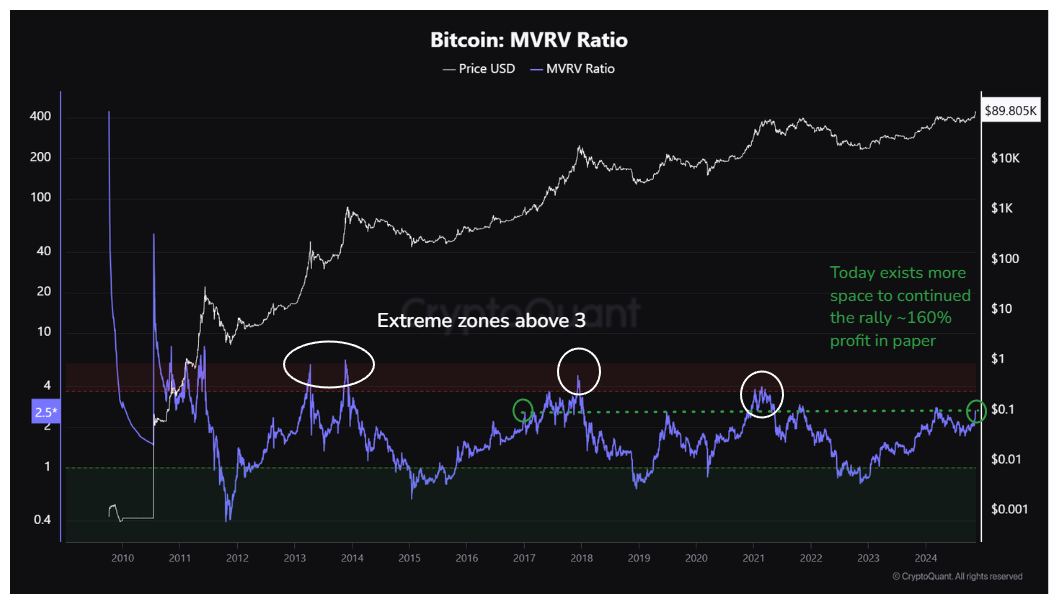
The MVRV Ratio represents the average profit multiple of each Bitcoin, at the moment it is trading at 2.5 which means on a percentage basis around 150% in profit on paper, comparing the extreme levels of 3 and 4 (~200%) considered like market tops, it is still in the balance and ready to continue up to $100K.
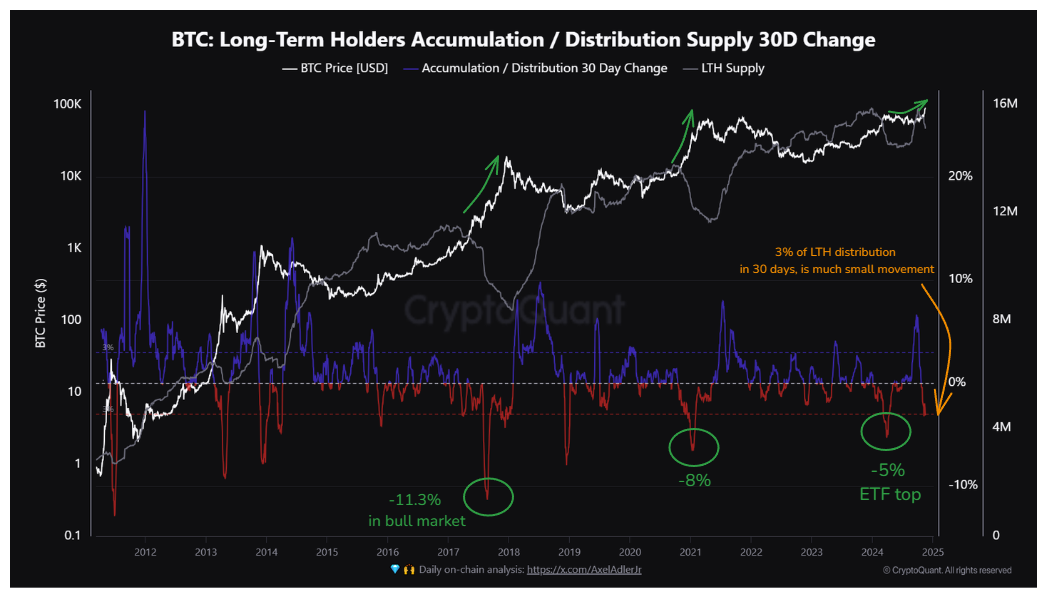
The Long-Term Holder sell-side wave since the ETF's rally has increased. Through LTH Accumulation/Distribution Supply 30D-Change, this wave of superficial sell-side of supply in profit is notorious, representing a decrease in your balances of 3%/month which becomes easily recovered in an overheated market such as Spot. And ETFs with trading volumes of US$7.5 billion/day. This influx of ETFs is absorbing all the coins that are being sold.
Looking at LTH we can separate it into two main categories to understand the psychology and direction of these investors:
1- LTH with purchases from 6 months to 1 year, these are mainly recent traders and investors, these are also those who sell in panic and capitulate in bear markets.
2- LTH is treated as smart money. They are investors with high convictions regarding the future, and they sell near market tops.
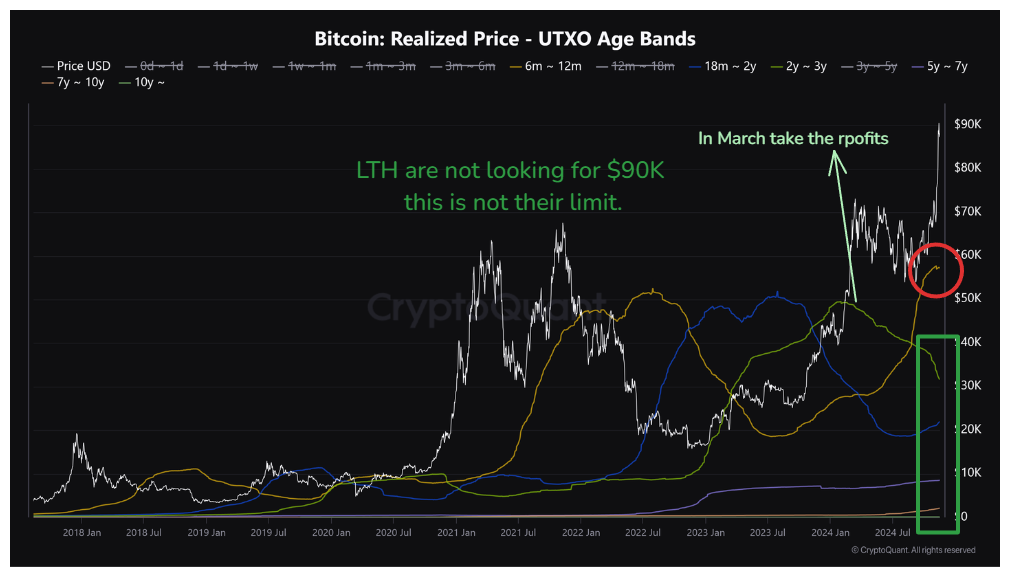
Through Realized Price UTXO Bands we see that long-term holders are not looking at $90K, Bitcoin has to reach higher levels and prices to realize profits of more than 10x. LTH 2 which is more than a year old readjusted its positions in March and therefore this area is not critical.
The movements have been coming from LTH 1 who have made recent purchases and for them, $90K will be the best exit door.

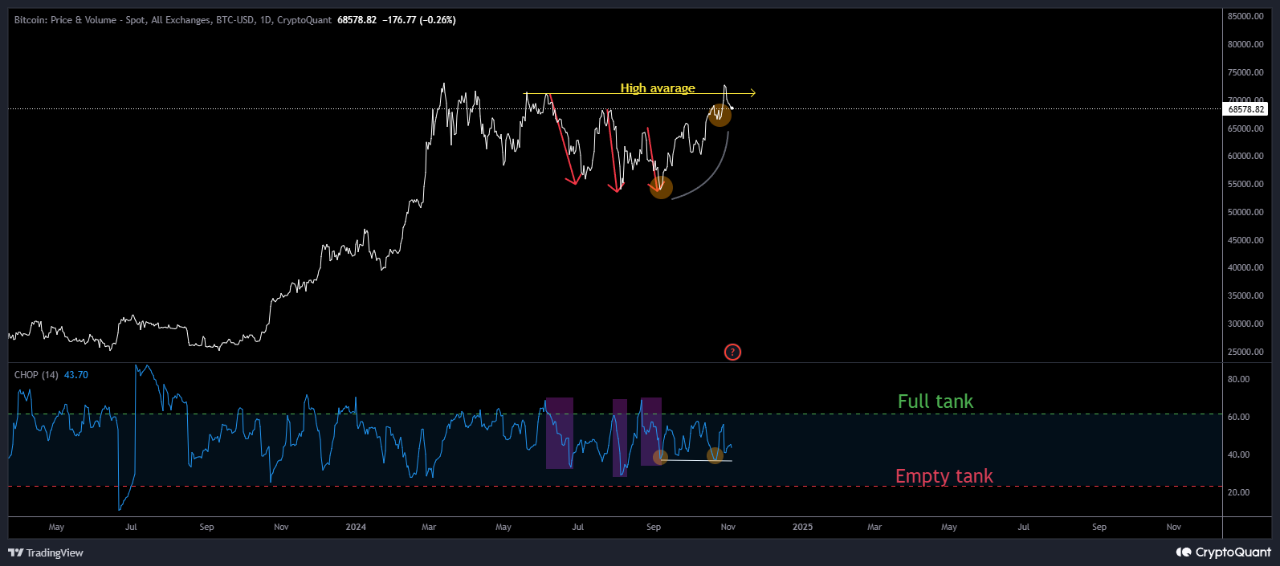
View original →The Chopsolidations metric aims to determine whether the market trend is exhausted or ready to move. It is not a directional bias metric.
Looking at the short-term structure, Bitcoin shows points of strength at the start of the trend exactly where speculation and leverage were excessive, leading to the possibility of Bitcoin reloading (corrections/consolidation).
The current scenario is one of uncertainty regarding the next direction, there are two sides, one that believes that the current deposit is enough to surpass the ATH and the other group believes that the deposit is not enough to surpass the ATH strongly.
Compared to September and October, there were two areas (orange) where the price found charging support. At 37, this opens the door for us to identify possible support against a possible fall in Bitcoin. In the short term, there may be enough strength to push the price upwards.
Reading the weekly and monthly Chopsolidation Macro, both are ready for a relevant and strong trend!

View original →

