Bullish(Nuanced)BTC
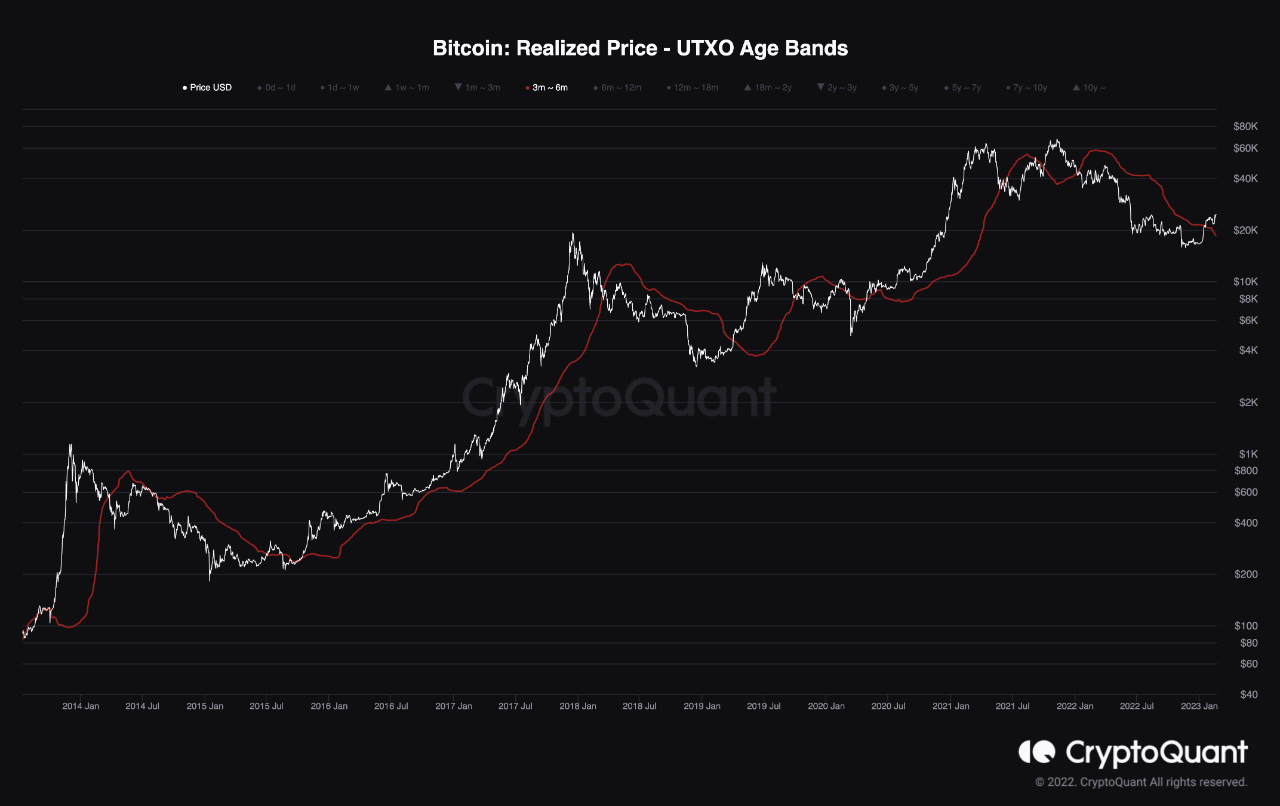
2/19/2023 > This indicator shows the realised price, sorted by age. This way, an average of the assumed price for coins 3-6 months old can be visualised in the chart below (similar to a moving average, but on-chain adjusted).
> The fact that in the two previous cycles, price going above this band has led to considerable uptrends can be seen, especially after the bear market already had hit the markets.
> Even if price goes below said band (like in 2019), there's a certain likelihood that BTC formed a bottom in November. However, since no other points of view are being considered for this conclusion, confluence between perspectives is important.

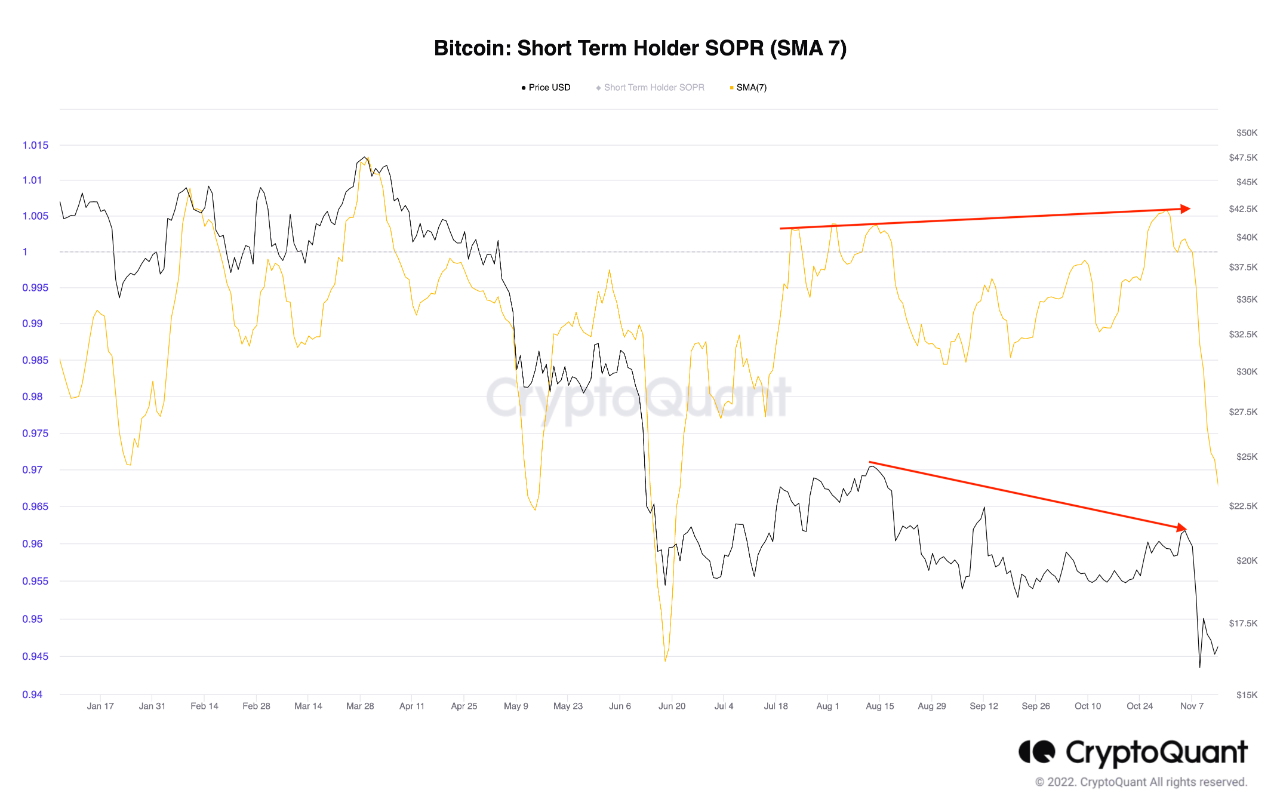
View original →> During the recent rally from 16k to 23k, a lot of momentum was implied. This means that buyers were aggressive and that they are well in profit, as that's what SOPR indicates. In short, we're seeing a sustained rally
> What's next? Bitcoin is also close to breaking its next high timeframe resistance near $25k. If this is successful, short term holders will increase momentum even more, making price reach $27-28k
> As long as $25k is not broken, BTC is likely to slightly retrace —see the divergence between SOPR and price, in which the former is trending down while the latter is stable.
Ultimately, it's an indicator that some of these short term holders are getting trapped into buying now while other forces (exchange market makers, which do not move funds on-chain usually) are driving price down
TLDR: BTC is likely to pullback at these levels based on the Short Term Holder SOPR, but if it does break 25k soon, targets would be around 27-28k


View original →Bearish(Nuanced)BTC
12/29/2022 Introduction: Spent Output Profit Ratio (SOPR) tracks whether coins are sold at more or less profit. Short-term only accounts the coins moved in the last 180 days
> Until FTX collapse, short-term holders have been benefiting more and more from the moves BTC was making (creating a bearish divergence). It's clear as well that FTX was a fundamental event and conclusions are not based on this fact.
> Comparing the current value to June's low, the SOPR is still quite high, yet price is lower. It's also true that drawdowns in June are larger than the ones in November.
> Also note that during this range short-term holders are still selling at a loss. Until this loss flattens out or starts to decrease, BTC probably won't see more moves up. > Altogether, this leaves room for downside in early 2023, or alternatively, for low volatility periods.

View original →Bearish(Nuanced)BTC
12/29/2022 Introduction: Spent Output Profit Ratio (SOPR) tracks whether coins are sold at more or less profit. Short-term only accounts the coins moved in the last 180 days
> Until FTX collapse, short-term holders have been benefiting more and more from the moves BTC was making (creating a bearish divergence). It's clear as well that FTX was a fundamental event and conclusions are not based on this fact.
> Comparing the current value to June's low, the SOPR is still quite high, yet price is lower. It's also true that drawdowns in June are larger than the ones in November.
> Also note that during this range short-term holders are still selling at a loss. Until this loss flattens out or starts to decrease, BTC probably won't see more moves up. > Altogether, this leaves room for downside in early 2023, or alternatively, for low volatility periods.


View original →To start, these ‘on-chain moving averages’ mentioned in the title are nothing more that realised price sorted by age UTXOs.
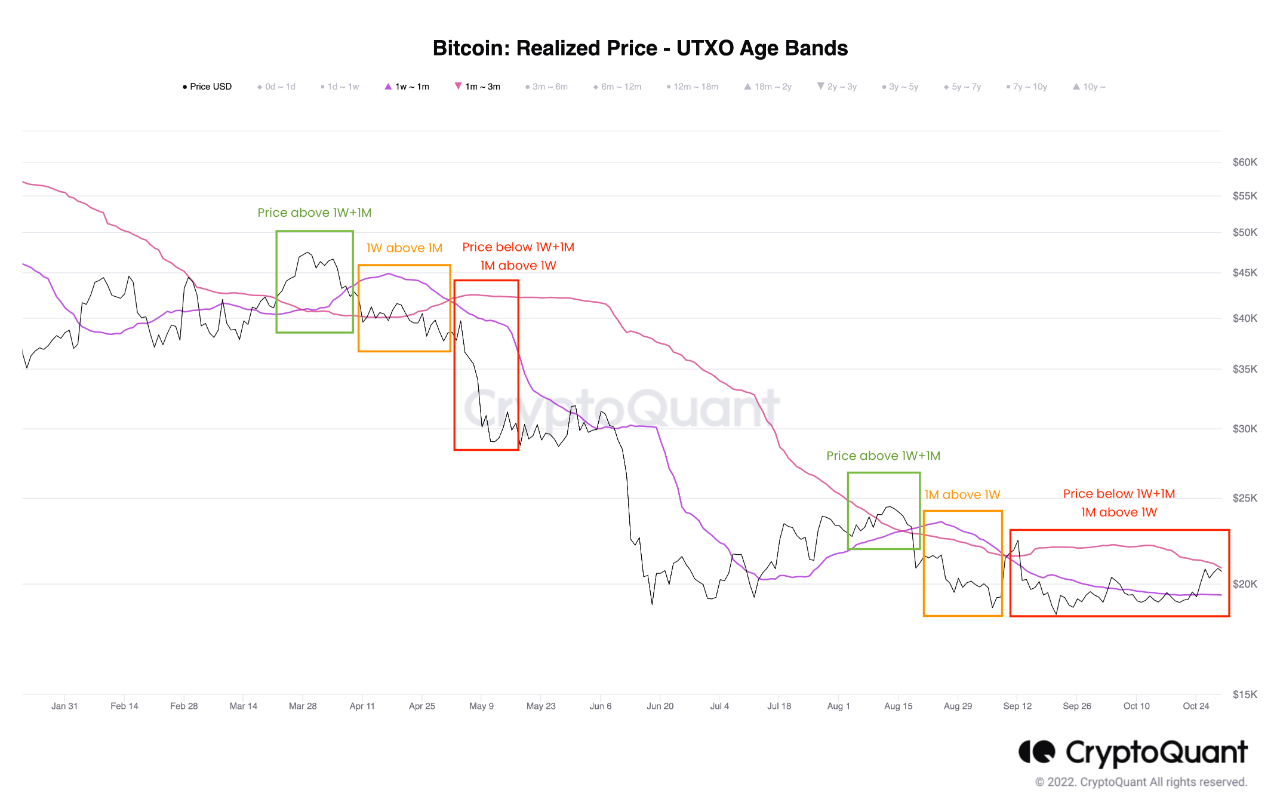
Realised price consists the result of weighing each coin at the rate it was last transferred (it represents an idea of the value that the market assumes) and UTXOs are what compose the age categories. Here’s how BTC has been reacting to the 1W and 1M bands throughout the last two cycles (this applies to bull and bear, although I’m exemplifying the latter):
Drop: in this first/last phase, bitcoin just maintains below both of the bands and crashes (quite) violently. 1M is above 1W due to the bearish momentum
First consolidation: BTC goes above the 1W and the initial low isn’t broken. If the low does break (like in May) then the consolidation is invalid and structure goes back to phase 1.
Range peak/reversal: the 1M band is broken, and this is the moment to decide whether the range tops out or there’s a continued reversal.
[CONTINUATION IN COMMENTS]

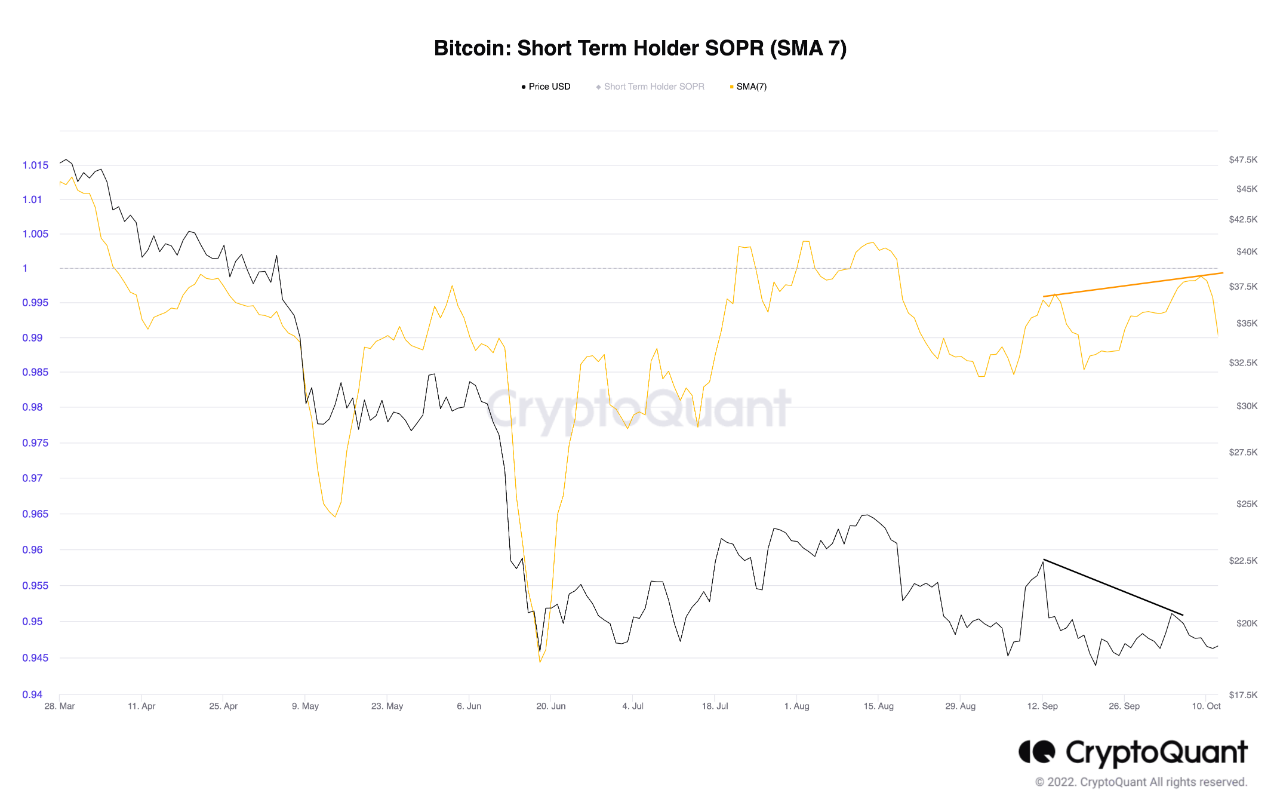
View original →Not much price action has happened over the last few weeks, even months. Short-term holders have stayed strong since June, so it’s long term holders who have been bringing price down (as mentioned in the previous article about spent output profit ratio).
There are two main bearish arguments that can be extracted from the chart above. The first one is the marked bearish divergence: price is lower, but short-term traders are making gaining more. The latter goes around the fact that SOPR above 1 indicates there are more profits than losses, and that seems to be a resistance since April.
As opposed to May-June’s price-based capitulation, some could say bitcoin is currently going through a time-based capitulation, somewhat similar to 2018 (before its drop from $6k to $3k). And to add a final medium-term bearish confluence, the miner position index (MPI) is slightly higher than in June, which just shows they are not convinced enough to keep adding to their portfolios.

View original →I wanted to come up with another analysis on Spent Output Profit Ratios (SOPR), and I noticed something quite interesting. But first, it’s worth it mentioning that BTC dropped further below $20k and took out the equal lows at $20.7k.
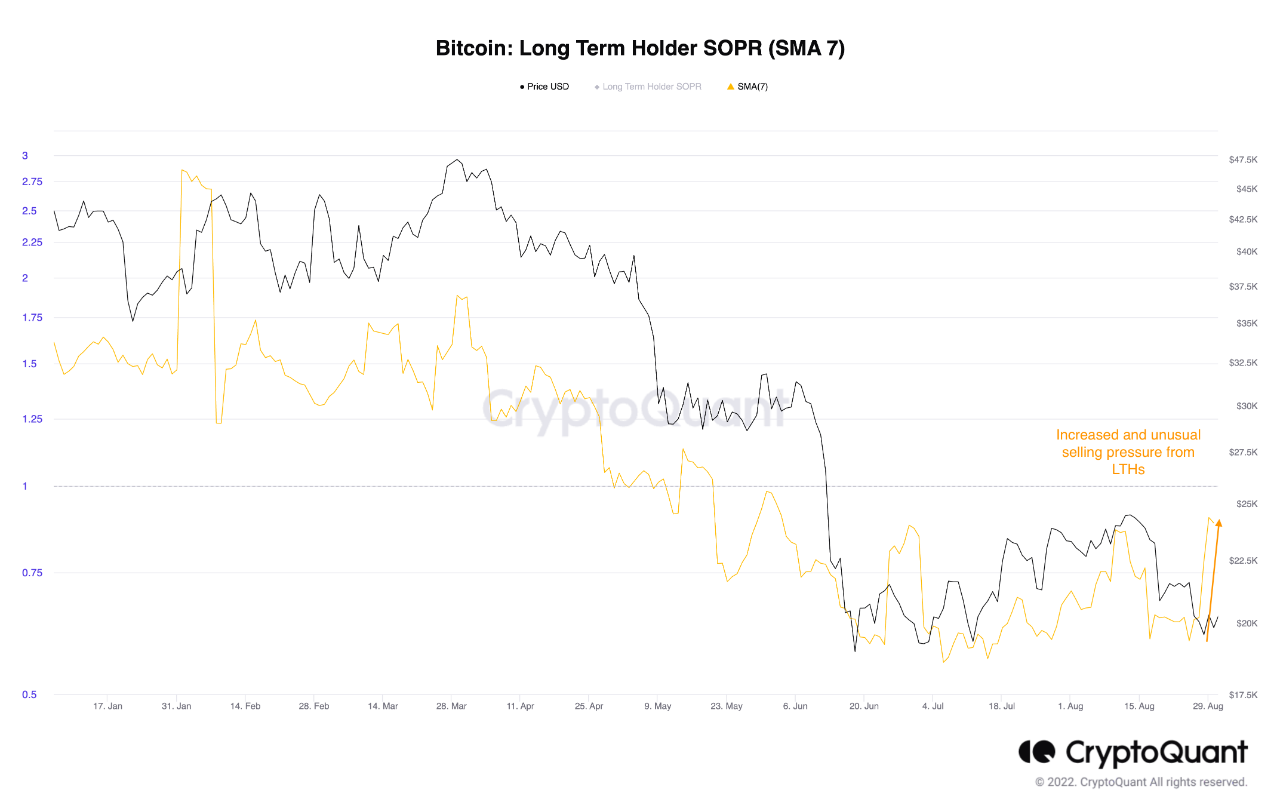
Long and short term holders’ SOPR have behaved quite differently during this move down (see charts). The former look more interesting, though. LTH SOPR spiked to where it was at the $25k high, meaning that they profited the same at both points. This is due to older coins getting sold, as they’re the ones at a lesser loss.
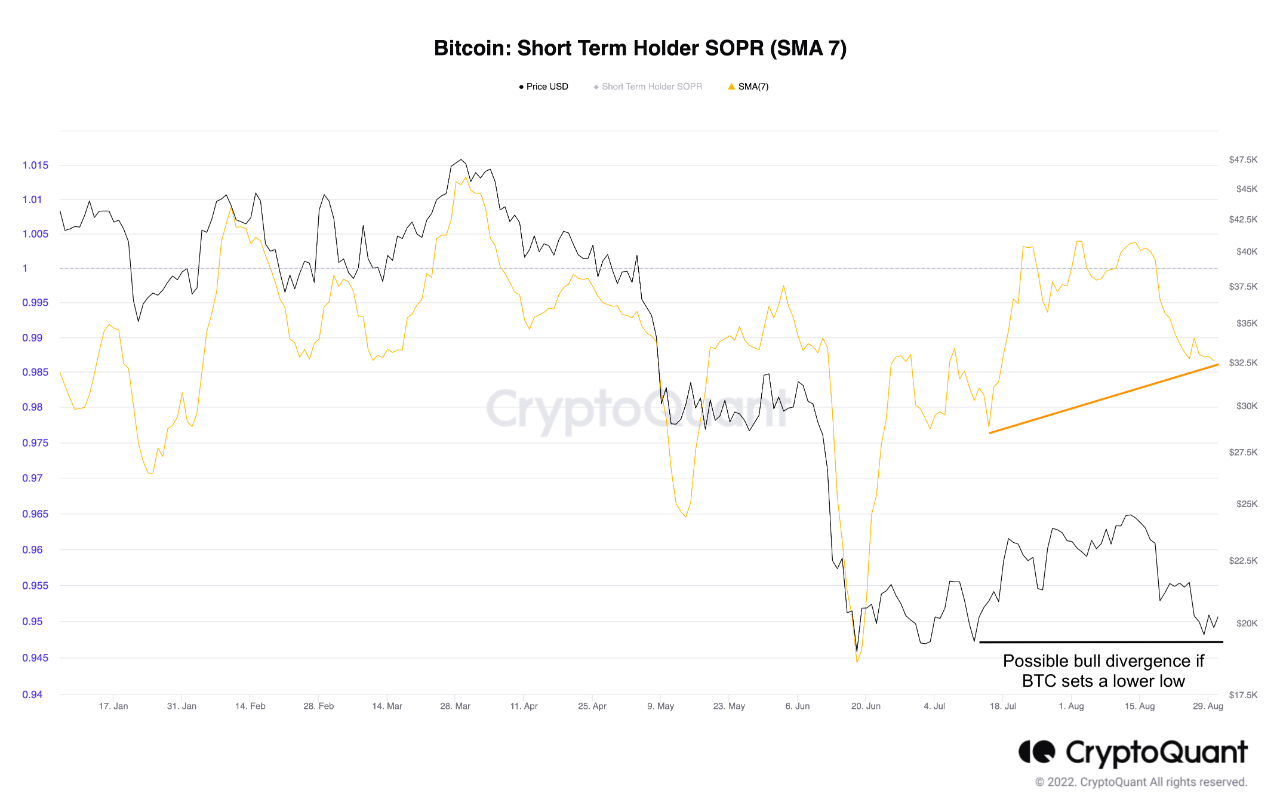
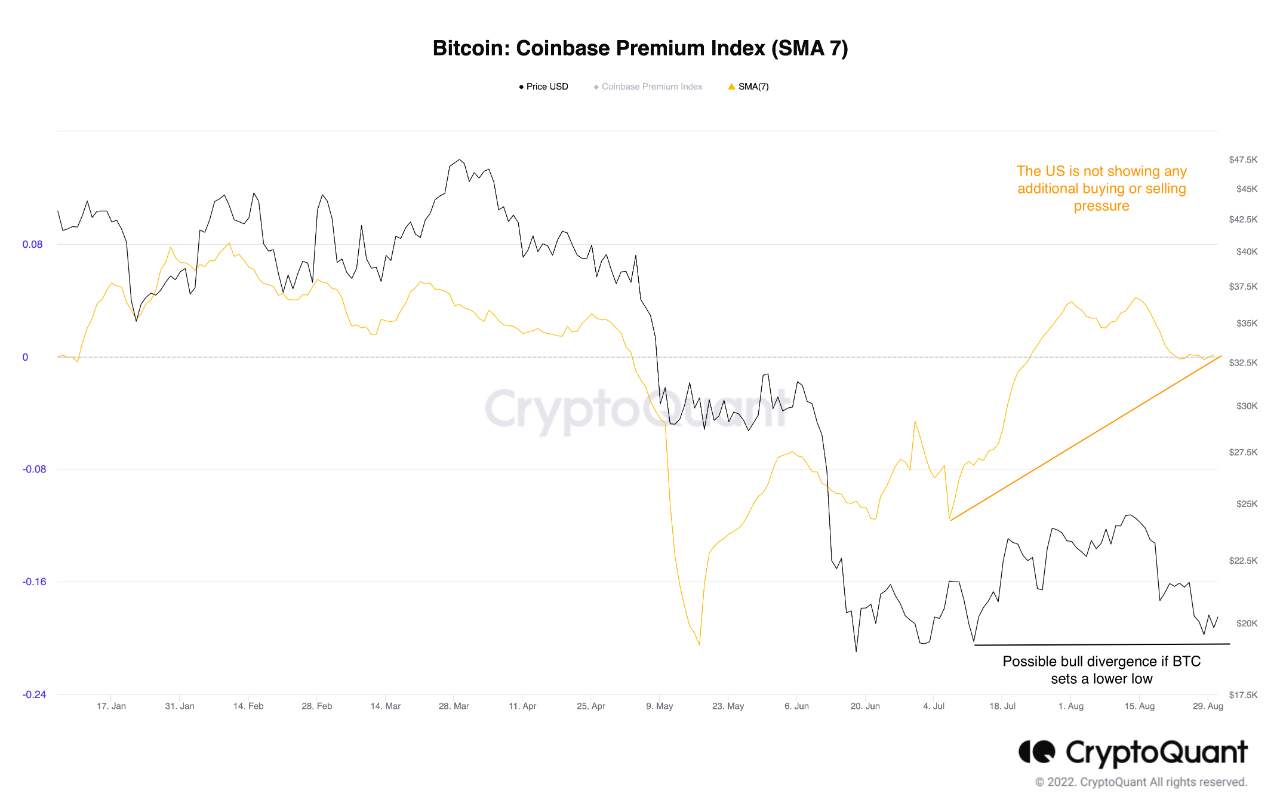
Short term holders, together with US investors specifically, have shown less selling pressure than at the start of June. As I wrote on the charts, making a lower low would officially set some bullish divergences.
In conclusion, macroeconomic conditions still have to prove getting better, but until we see future releases, we can deduce selling pressure is mainly created by LTHs and STHs put together less momentum.

View original →Bearish(Nuanced)BTC
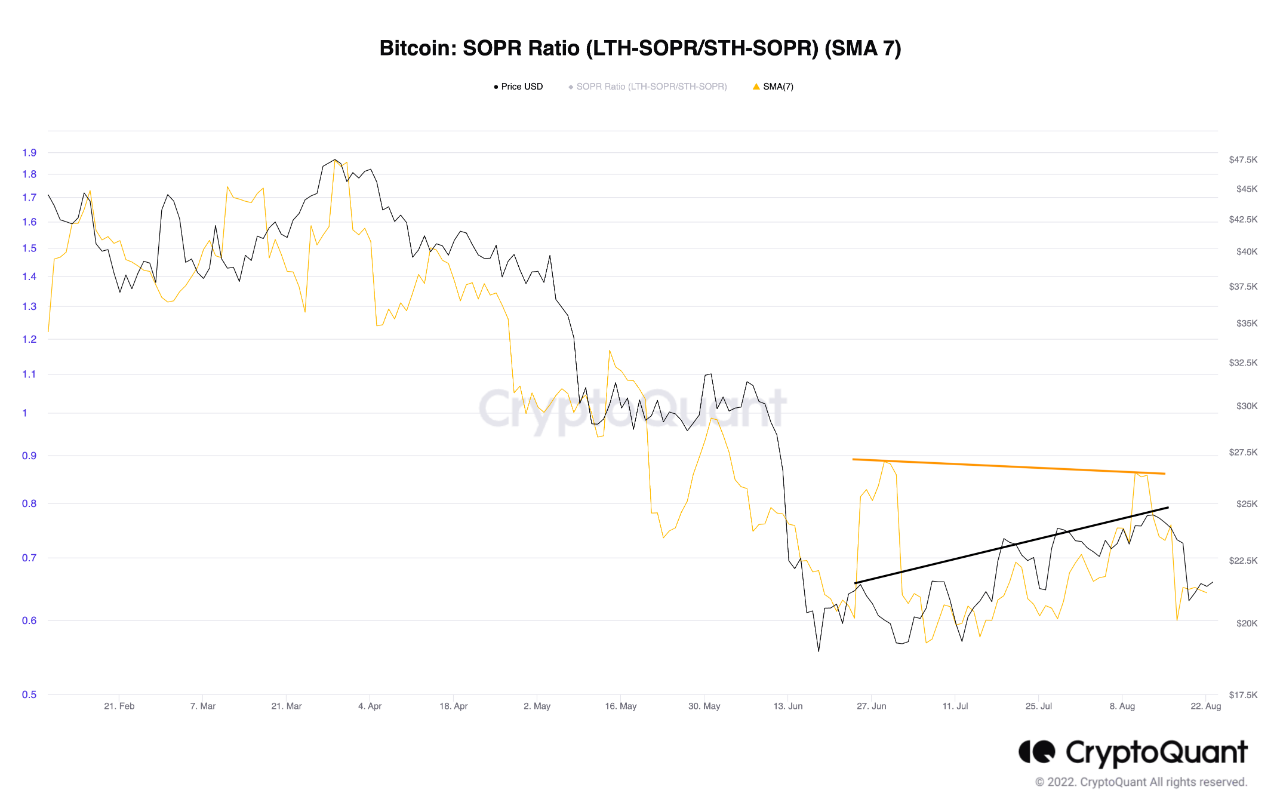
8/26/2022 You may have read the title: long term holders (those who have been holding for more than six months) are profiting less from this rally compared to short term holders. This is shown by the divergence on the chart, in which the fact that LTHs profited more after the initial relief rally in June than at the current $25.3k top.
What does this imply? Mainly that these longer term holders have been slowly selling their coins while the rallies were getting fuel from traders/STHs. This is translated to the idea that we could see a breakout both downwards and upwards as there is selling pressure, although this pressure brings us closer to capitulation (thus a market bottom).
My medium term targets remain the same, $28-32k, but now that price broke structure, there is a chance (not a big one) that we sweep June lows. On a shorter term, BTC could retest $23k, but this could happen after getting another rejection from the $19k’s. In conclusion, I'm quite neutral the time being...

View original →Bearish(Nuanced)BTC
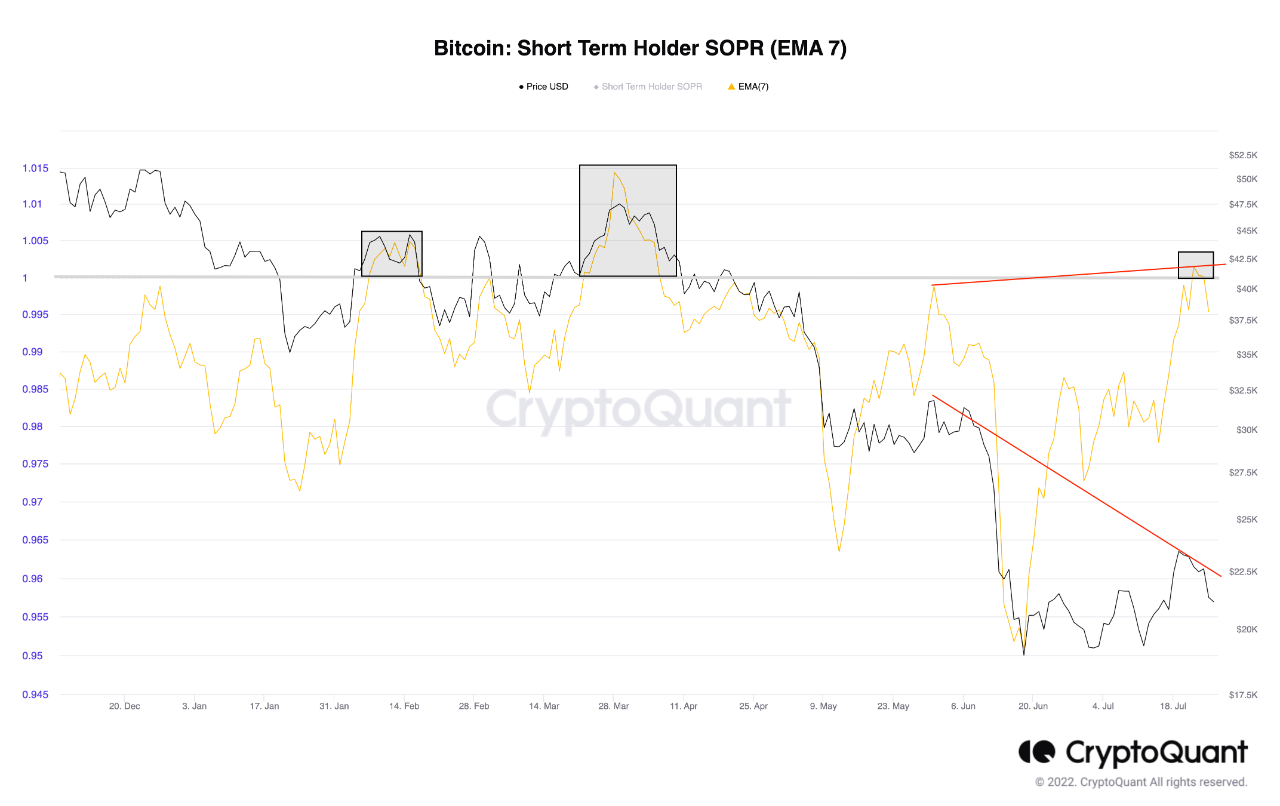
7/26/2022 The Short Term Holder (STH) SOPR indicates whether ‘new’ coins are sold at a profit or not. As we see thorough this year, values above or even close to 1 have been proved to be local top signals.
A few days ago, it went above 1 briefly and returned back below (for now, at least) and we can mark a bearish divergence comparing the last local top ($24k) to the $32k high in May.
As price returned to the $22k, the range BTC had been holding in June, there are probabilities to say this was just a deviation/sweep, although a continuation of the bearish move would be confirmed below $19k — a break of the previous low.
In conclusion, it seems that in the coming week(s) — take into account that we have earnings season and the FOMC coming up — could be slightly painful, especially if BTC goes below $19k, as I just said…

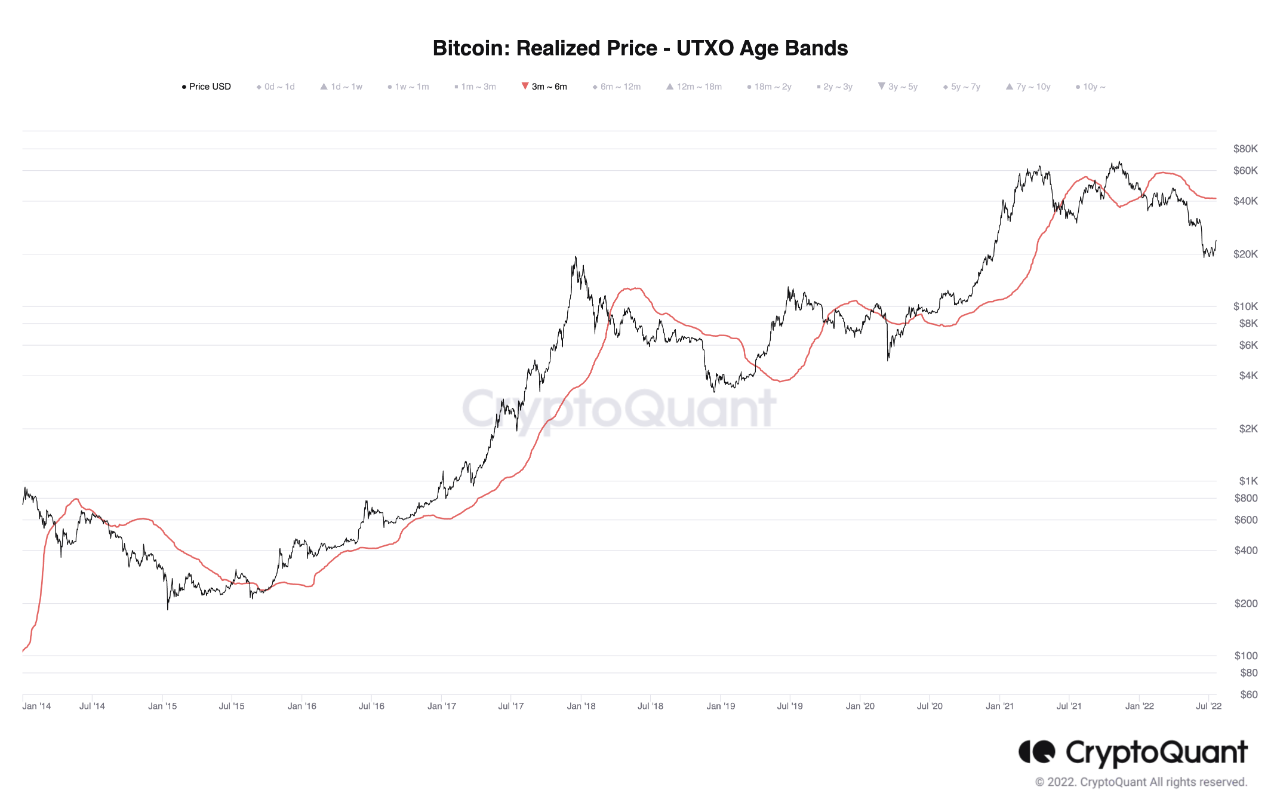
View original →The realised cap weighs each coin at the last price it was moved, so old coins are mostly discounted. That divided by the supply gives us the realised price (which I wrote about a few weeks ago). Lastly, a set of realised prices is combined with UTXO age bands.
At a first glance, the corresponding metric for 3-6 months has worked pretty much like a moving average: price crossing below or above has led to a continuation, as we see, usually marking cycle tops and bottoms (since 2018’s bear market bottom, 2 crosses have been needed).
Looking at the current conditions, this realised price sits at roughly $40k, and it hasn’t moved since the end of May. If we look closely, price mostly crossed while it was trending, so the option that Bitcoin reaches $40k is not that likely.
So, if this was really the bottom (I don’t consider it), we would need to consolidate for another 3-6 months until we see these holders dragging their realised price down, and then trend up above it.

View original →

