Bearish(Nuanced)BTC
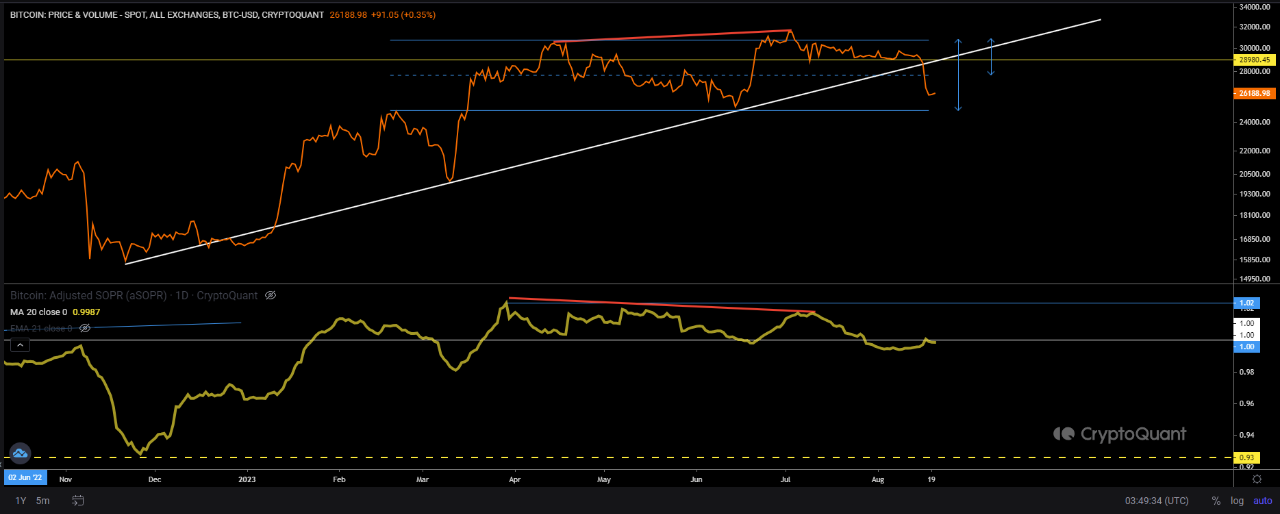
8/21/2023 I've been tracking this development for a little over 6 weeks now and apparently, we're closer to being done (pic 1, the aSOPR div itself), which I see as the perfect opportunity forming, one I've described in my SSR QuickTake from Jul 17th (short term expectation to sweep the entire 25k - 30k range)
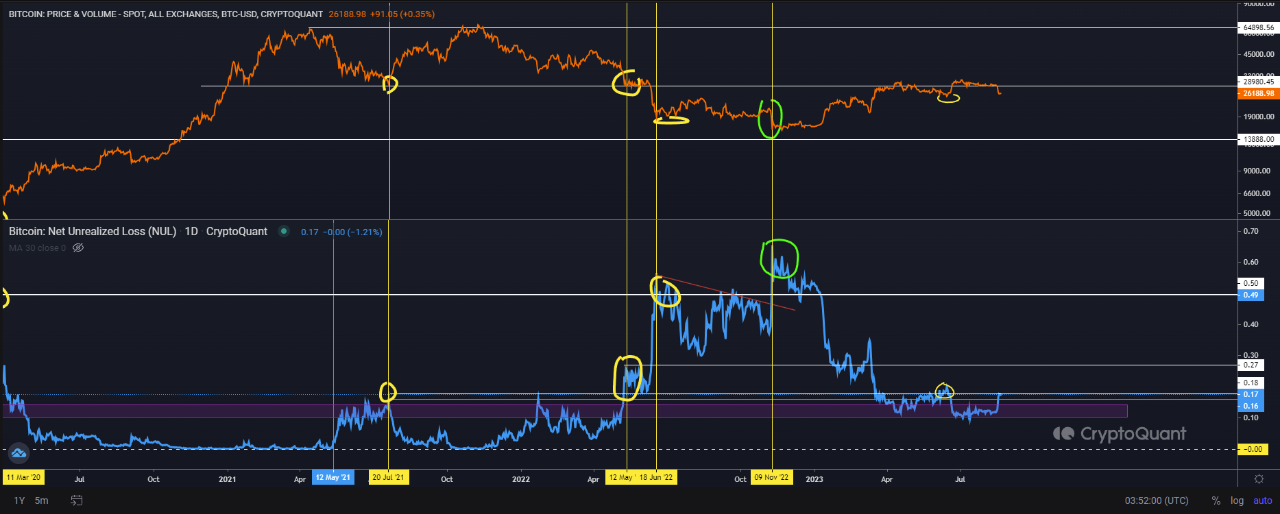
NUL, contrary to my original expectations from 22nd June are right around levels where they were back then (pic 2, the NUL TA structure) - naturally, since Bitcoin didn't break out to the upside, but took the PA range to the downside - I view this as a perfect opportunity presenting itself
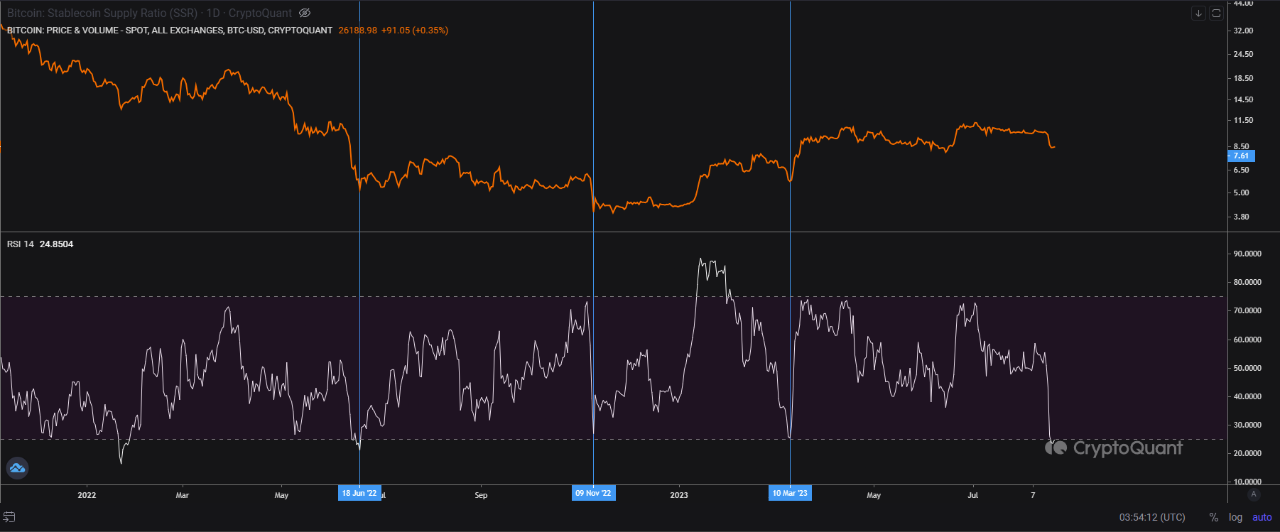
The SSR RSI (IT Tech taught me this one - credit where due, pic 3) has hit levels not seen since last year's june, exceeding both FTX dump's as well as this year's march's banking crisis extremes - this to me is yet another confirmation that the time to load up the proverbial leverage truck is likely closer than you may think.
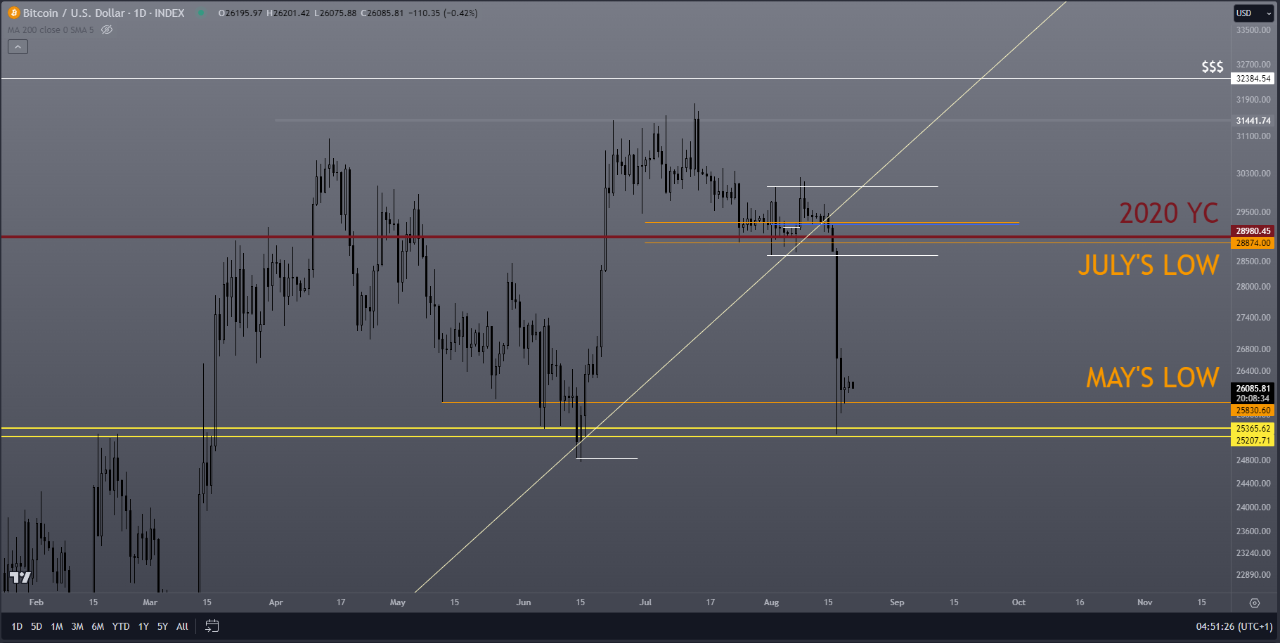
Finally, PA (as well as various analysts correctly point out - the OI & leverage developments of late last week) suggest yet another factor of confluence with regards to turning bullish ALSO in the shorter term, apart from the cyclical bullish view - purely PA speaking - chances are the last week's lows are swept either now still in august or in september, then a reversal should be in order (unless, of course, the current local lows are in already, let's not forget that Gary's hammer made the market that much more illiquid).
3-month aSOPR bear div quick sum:
13th jul 2023 - spotted
24th jul 2023 - playing out
today: much closer to done (SSR RSI, NUL, PA)
The last update on this metric from my end: https://cryptoquant.com/insights/quicktake/64beb0a38f218e1612b86acf-3-month-aSOPR-bear-divergence-update-Its-playing-out
P.S.: Interesting note: AntPool's activity I've outlined in my last QuickTake ceased, HOWEVER, miners overall haven't stopped increasing their reserves and also exchange depositing transactions new lows not seen since mid-feb '17...

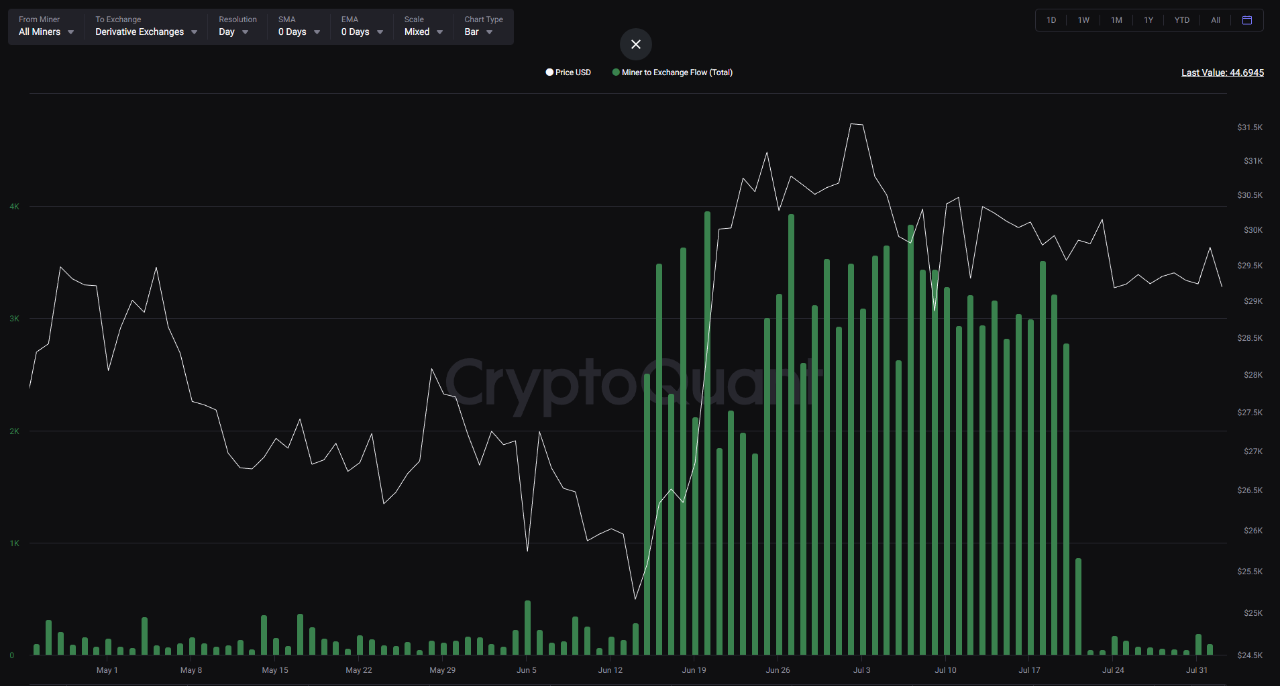
View original →Contrary to some on-chain analysts' opinions, the miners have not been selling, likely not even "hedging", the "Miner to derivatives exchanges flows" chart was skewed by AntPool's efforts to trick us into thinking there's "selling pressure" from Miners. Let's have a look at the charts:
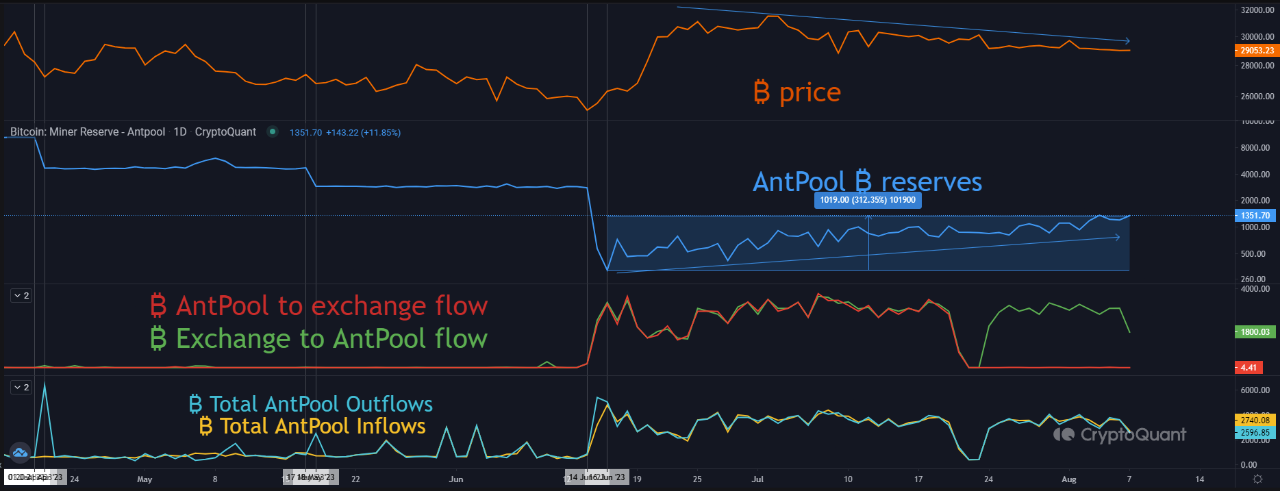
1/ First, the chart this QuickTake is linked to "by default" ("Go to live chart now") button (screenshot #1):
Mid-June to 22nd-23rd Jul AntPool has been sending ₿ back & forth to Binance & back to themselves, which some interpreted as "hedging" (myself, got played, too) or even "selling"/"speculative" directional bets.
From 23rd Jul onwards, only the flows from exchanges to AntPool has remained active
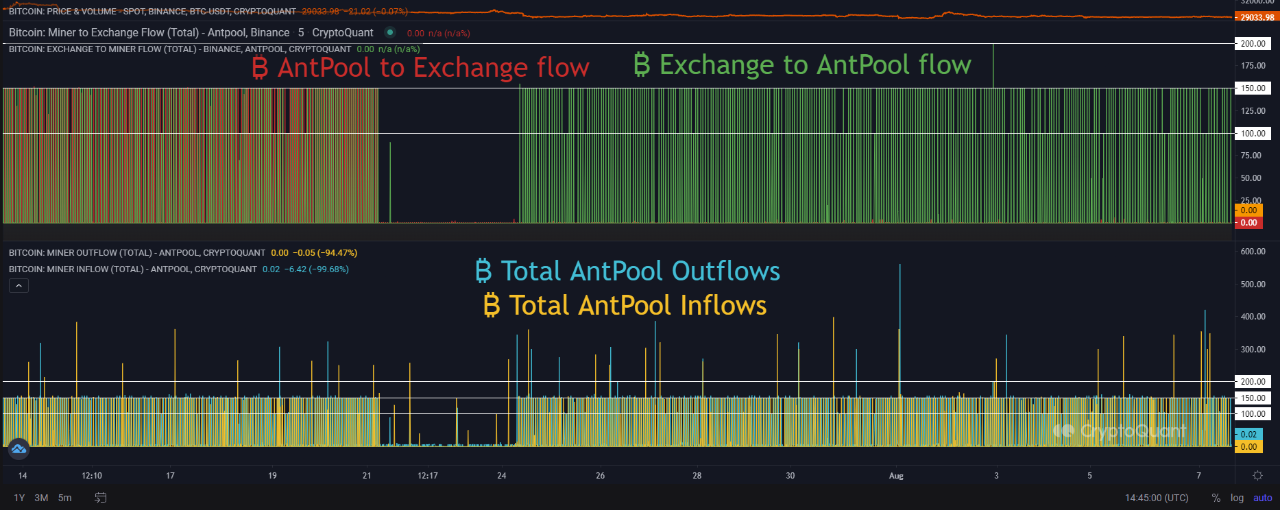
2/ Secondly, a closer look at the Block resolution (screenshot #2) clearly says that it's been an algorithmic activity, clips of ₿100 - ₿150 had been being sent back & forth as per the date & time delineated above (1st 4 - 5 days it was actually clips of ₿200), then between 22nd-23rd Jul, the AntPool to exchanges flows cease, however, their total inflows & outflows remained intact, as did their inflows from Binance.
In other words, they chose to avoid triggering the "miner to exchange flow" metric by using an intermediate address, we've seen this before (See IT Tech's Quick Take from May 18th).
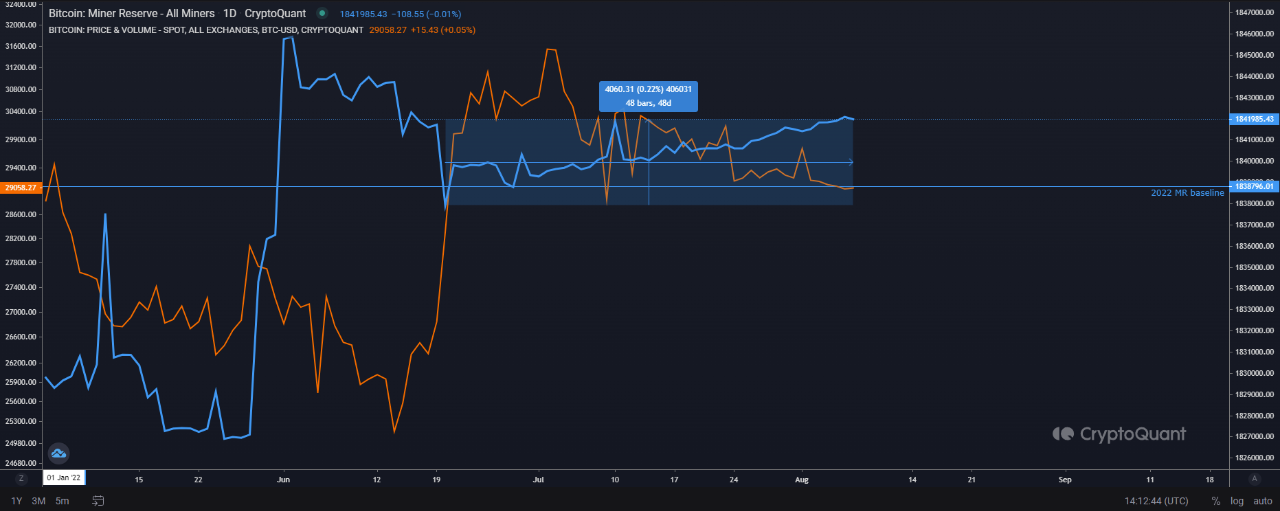
3/ Overall, All miners have been accumulating since 20th Jun (they probably followed AntPool's activity, screenshot #3)
4/ Miner to xchg flows chart for reference (screenshot #4)
Summary:
Overall, Miners have accumulated ~₿4060 / past 48 days
AntPool accumulated ~₿1020 / past 52 days
Conclusions:
1. "what do the miners (AntPool in particular) know that we don't" is a valid question
2. In the Big Picture the amounts of ₿ we're talking about here may not be "staggering", but is a telltale sign of current miners' sentiment nonetheless
Charts References:
Screenshot #2 - https://cryptoquant.com/prochart/sw1VLRpl7Yf98
Screenshot #3 - https://cryptoquant.com/prochart/mhxRssHUyI9YJrk

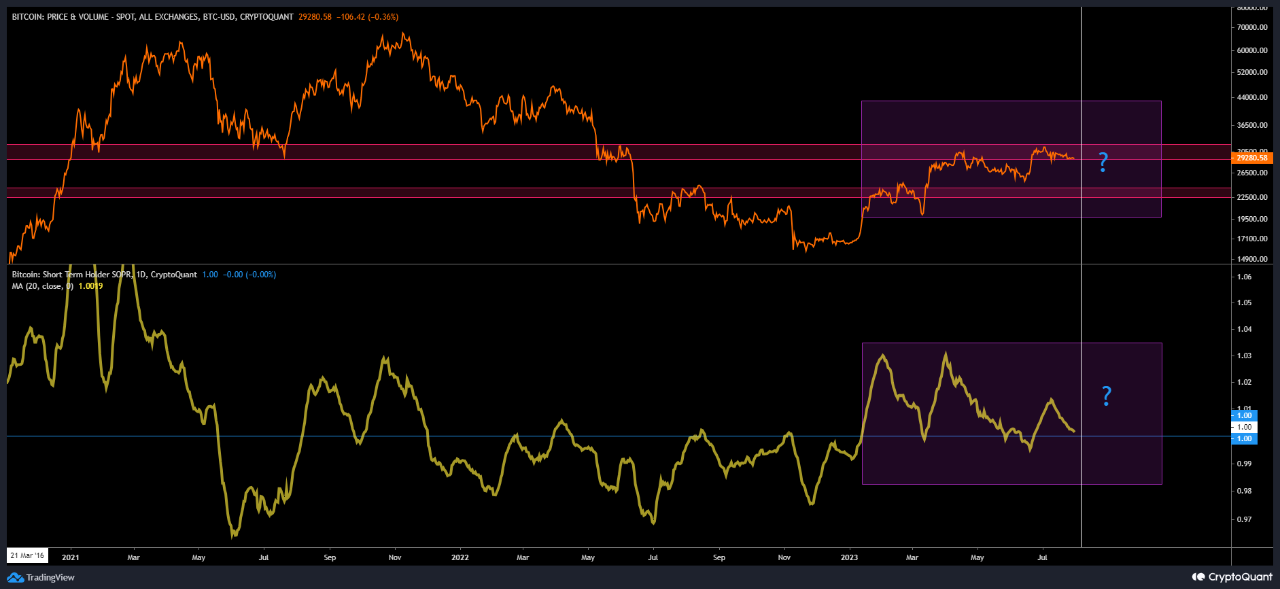
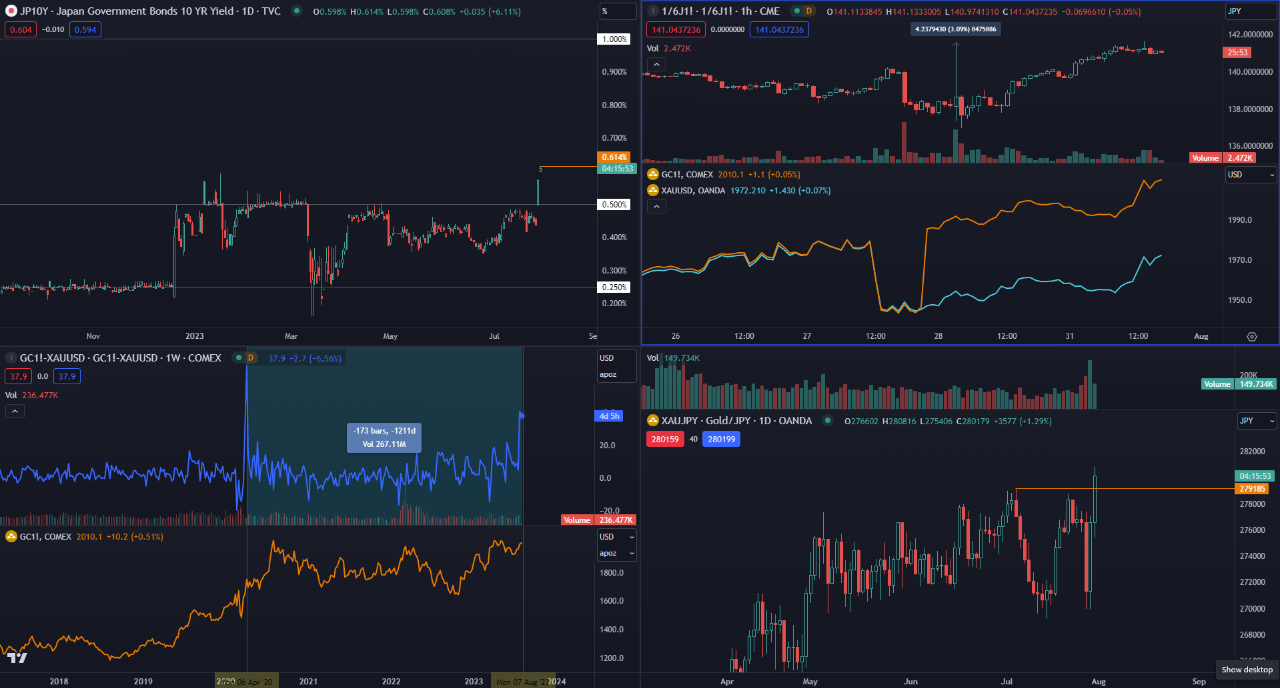
View original →Bitcoin STH SOPR approaches the critical "1" equilibrium line as BoJ reverses their "YCC tweak" policy well before it reaches their announced new "line in the sand" of 100bps.
Immediatelly after BoJ decides to move the goal post, the spread on gold between Oanda & COMEX flies to highest since mid june '21 on the daily, and highest since march '20 on the weekly, only for gold to breach new ATH in terms of yen like about a weekend after BoJ makes their "YCC tweak" announcement on friday last week.
USDJPY wipes out both sides of the market after clearing a major higher low in its uptrend only to continue marching higher right after BoJ is forced to make an U-turn as JP10Y reaches slightly above 60bps.
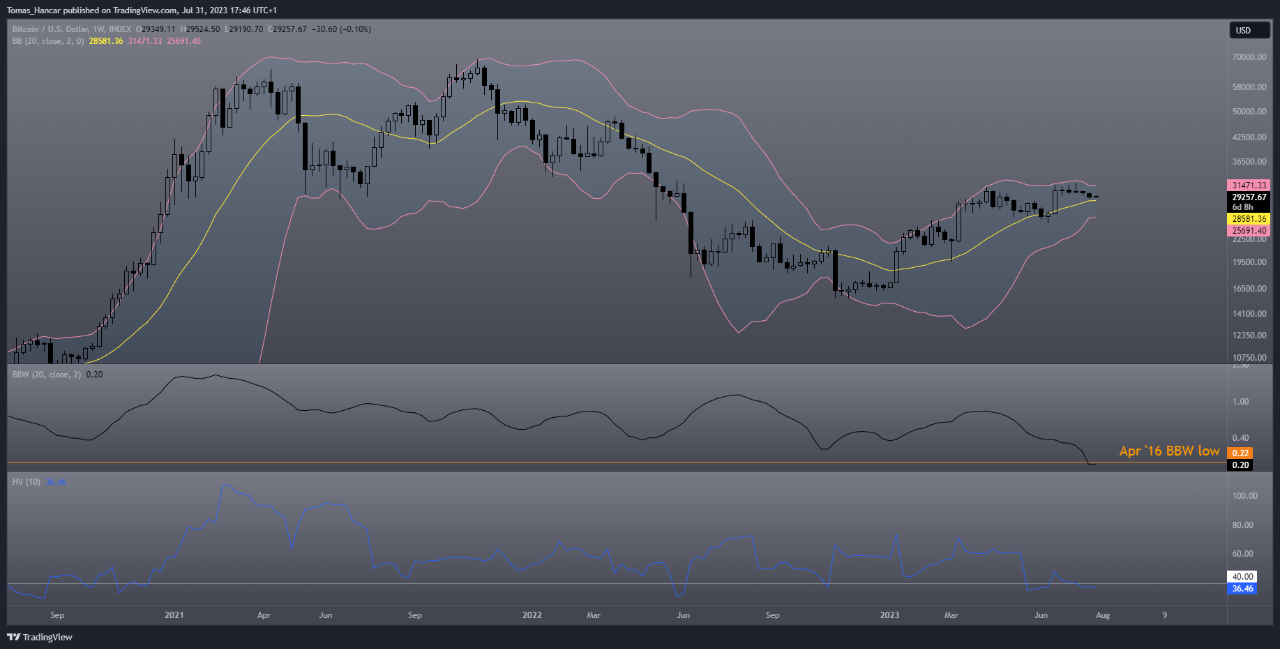
Meanwhile Bitcoin keeps on sitting tight in its range, with STH SOPR approaching the "1" level, BBW continuing to look for new lows and volatility being surpressed still...
In my humble opinion - if Gold sniffed it out, Bitcoin will follow suit soon enough. It is no coincidence that Binance is heading to Japan, too among the beginning of what I perceive as the beginning of govt bonds confidence major blow.
This is the perfect storm environment for Bitcoin, make no mistake about it - the governments & central banks have historically always saved the bond market & used the currency as the release valve.
This is now unfolding right in front of our very eyes with the Japanese Yen. Gold sniffed it out, there's a flight towards it already. To be honest with you, not really sure what Bitcoin is waiting for.
Given the above described macro picture (feel free to review my last year's june BoJ YCC "blow up" call, back then still at 25bps here on CQ QT) I see only two possible scenarios ahead:
- A "quiet" re-accumulation continatuion before the inevitable lift off
- the lift off
As always - should you decide to play this with leverage rather than spot - please be sure to manage your risk - leverage flush out prior to a take off can't be ruled out :)


View original →Bearish(Nuanced)BTC
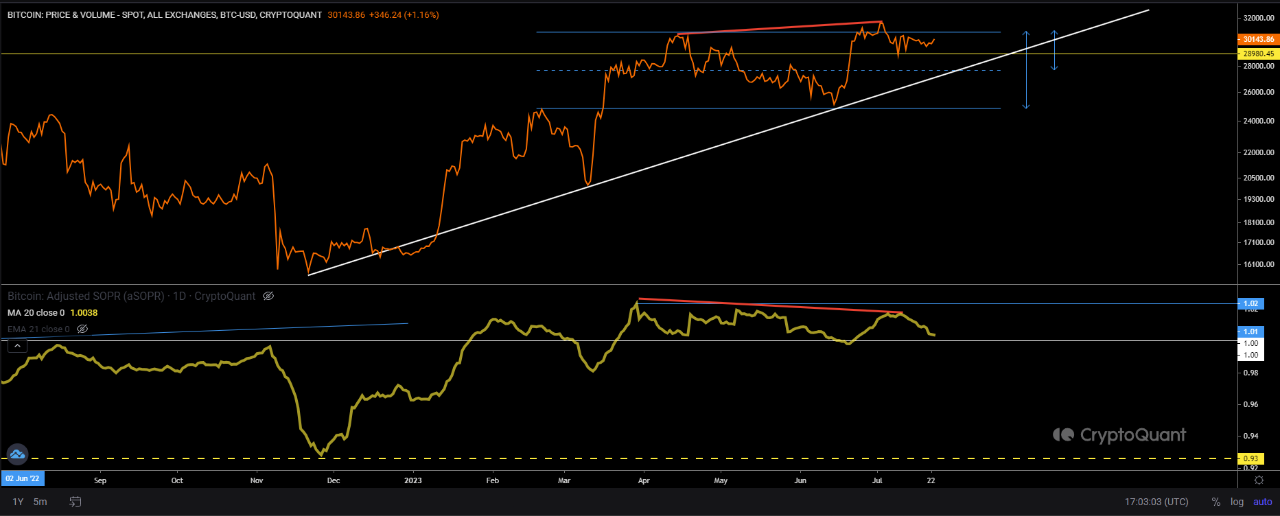
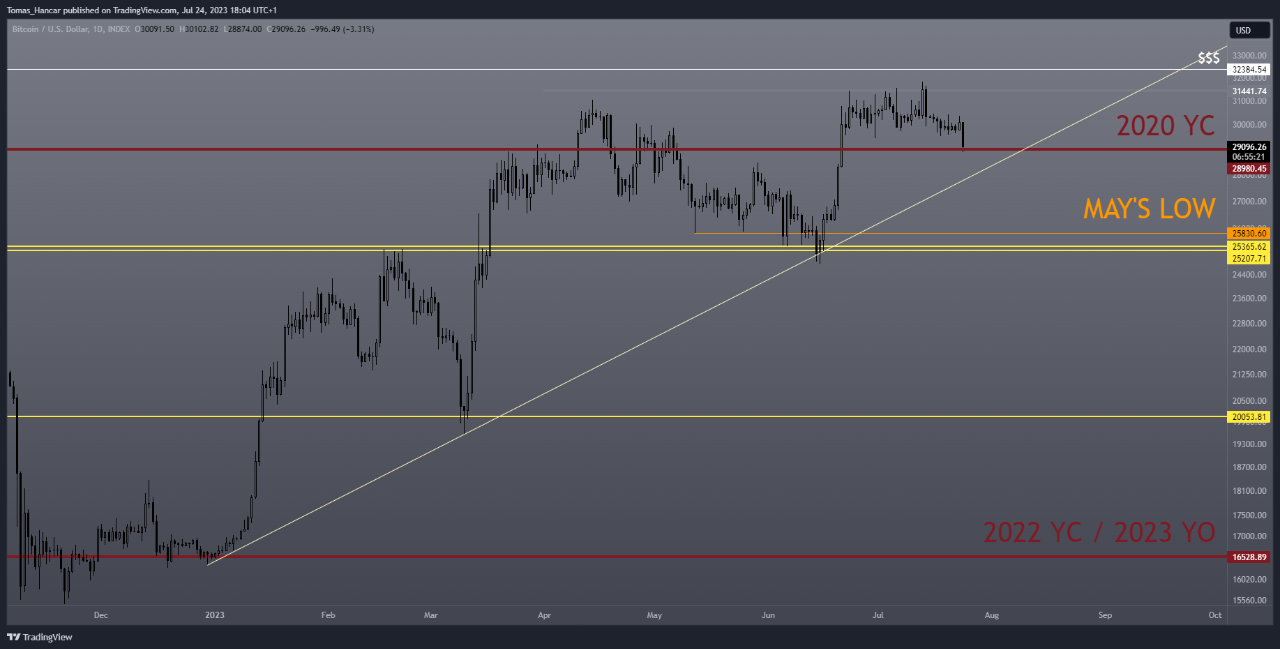
7/24/2023 Looks like the 3-month bear divergence on aSOPR I've outlined on Jul 13 is playing out.
That said, the metric itself is fast approaching the "1" equilibrium line, which means that we may see a bounce as soon as a convenient technical structure is reached.
Should we close this week below the key 2020 yearly close of 28 980, I'd be looking for 27 700-ish as the next best line of support, should that get breached, 25k-ish is the next logical technical structure to be looking at.
As far as current uptrend in Bitcoin since the beginning of this year is concerned, please note a potential confluence of its supporting trendline with the 27,7k mid-range area.
That said, I usually don't pay that much attention to trendlines (I prefer horizontal levels instead) and would like to note that a weekly close below 28 980 warrants both 27,7k & 25k as potential technical targets.
Should we close this week back above 28 980, either further sideways chop or a continuation of the current uptrend is easily warranted in such a case.
aSOPR holding support at "1" or, better yet, "bouncing" off of it warrants anything at least to the 32 384 liquidity pocket area, and possibly beyond, especially if aSOPR's current high of 1,0235 is breached as a lagging confirmation...
The "original" Jul 13th QuickTake URL for reference: https://cryptoquant.com/insights/quicktake/64b0053dd3b747540365ebb0-aSOPR-3-month-bearish-divergence-warrants-caution-patience

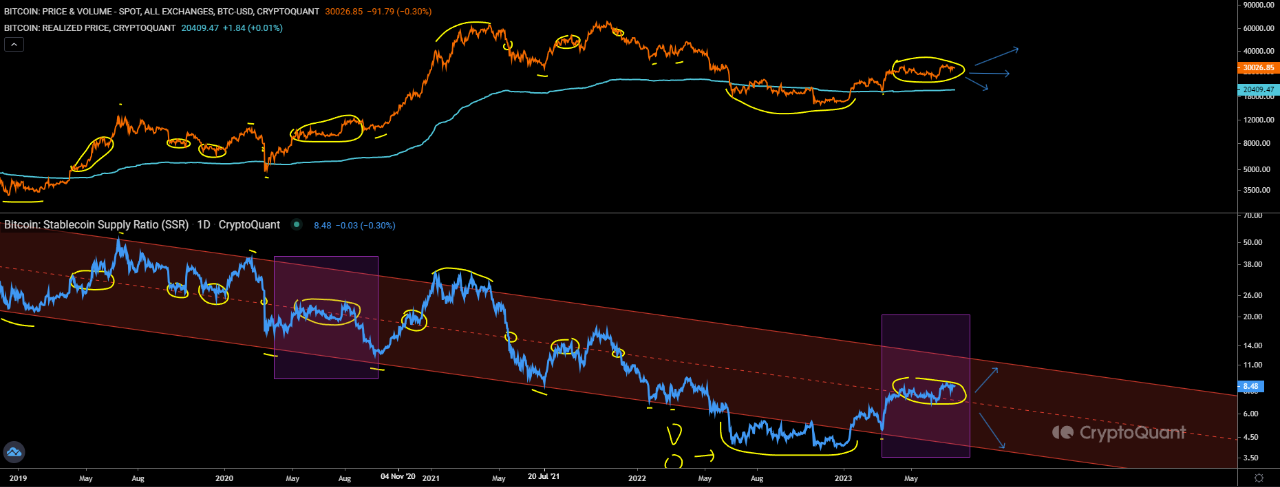
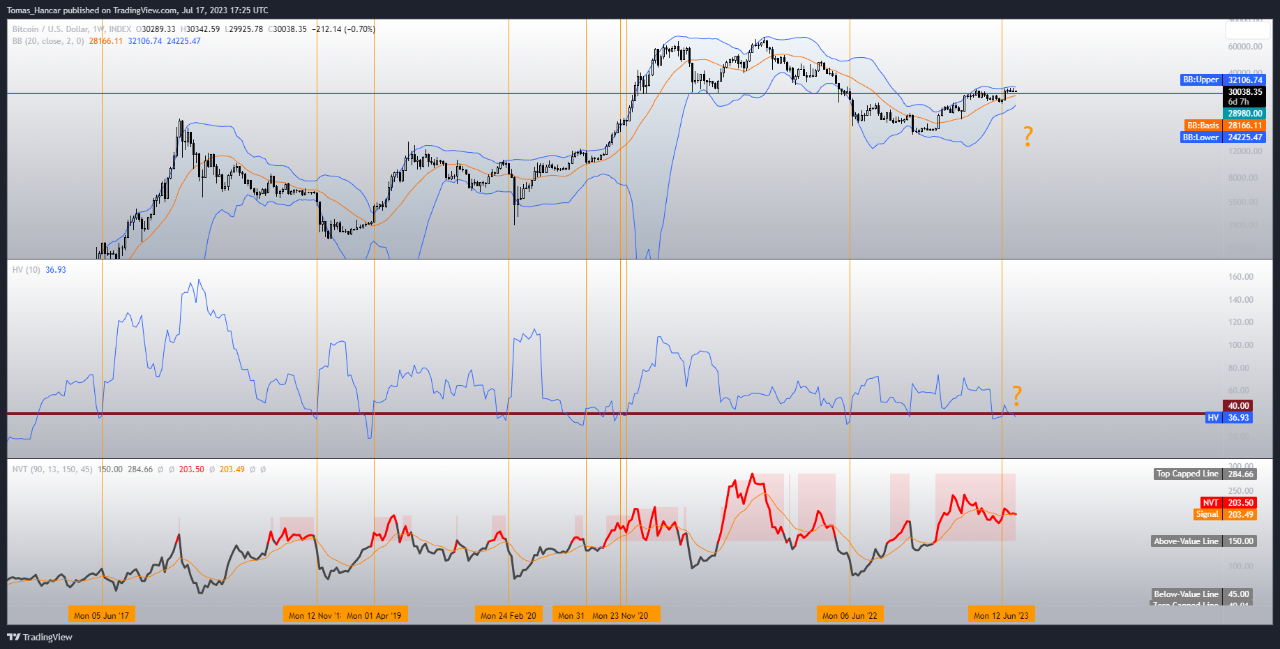
View original →Three main scenarios for the Bitcoin price going forward (tightening Bollinger bands & surpressed volatility suggest a larger move coming in the next few weeks to months) - the evaluation of "set ups" = assuming one of the expected scenarios play out:
1. SSR to lower channel band x PA sideways or slightly lower (e.g. not breaching 25k significantly to the downside) = a very bullish set up once the move down is done (short term I am expecting the current range to potentially be cleared to the downside as per my last QuickTake with regards to the 3-month aSOPR bear div)
2. SSR to lower channel band x PA all the way back to Realized price or potentially lower (e.g. breaching 25k significantly to the downside) = an EXTREMELY bullish set up
3. SSR to higher channel band x PA exceeding the 32 384 liquidity area with strength = probably a good break out, but without a FIAT world black swan/meltdown (bonds imploding badly for instance), the subsequent top (my best "guesstimate" would be the '22 YO around 46 200-ish as a potential target) may actually present a good tactical intra-cycle short opportunity.
In terms of Risk:Reward, the bullish break out into the 40's offers the best potential "R", however, as per my last QuickTake, it MAY be a good idea to wait & see whether an opportunity to get in our mid-longer term leveraged plays in lower parts of the current range doesn't by any chance present itself, first...
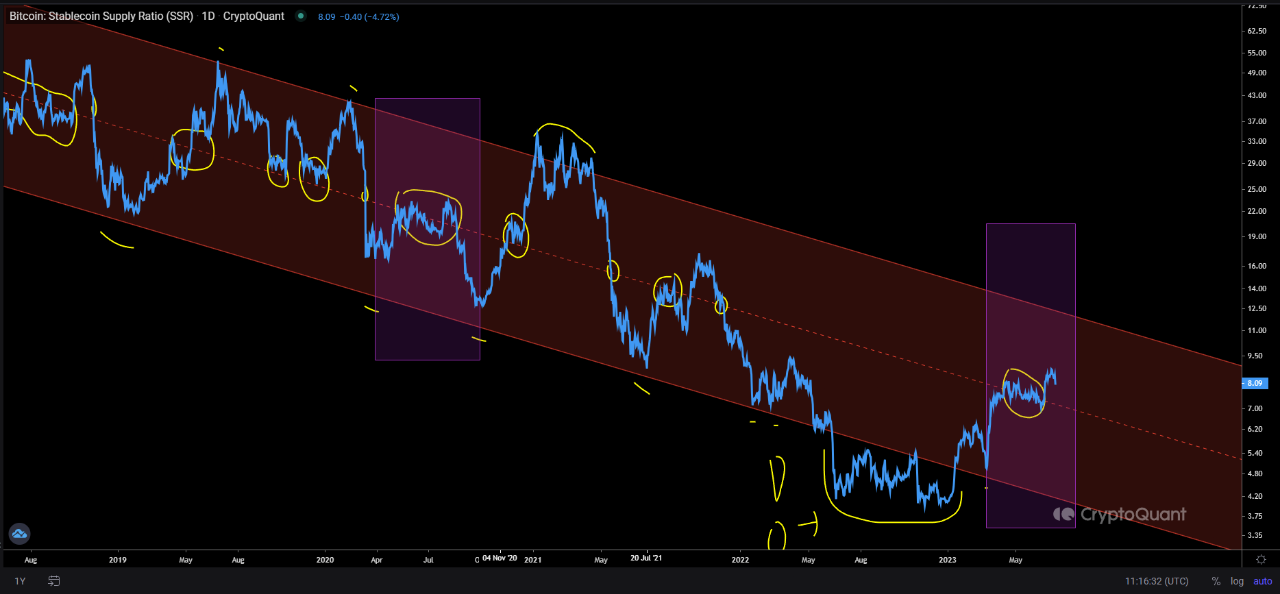
The purple box is there to make one think about whether halving is priced in or not and if so by how much (similarity with pre-2020 halving) in terms of SSR - halving still ~270 or so days ahead, yet the SSR looks similar to around may 2020.
Certainly something to think about.

View original →Bearish(Nuanced)7/13/2023
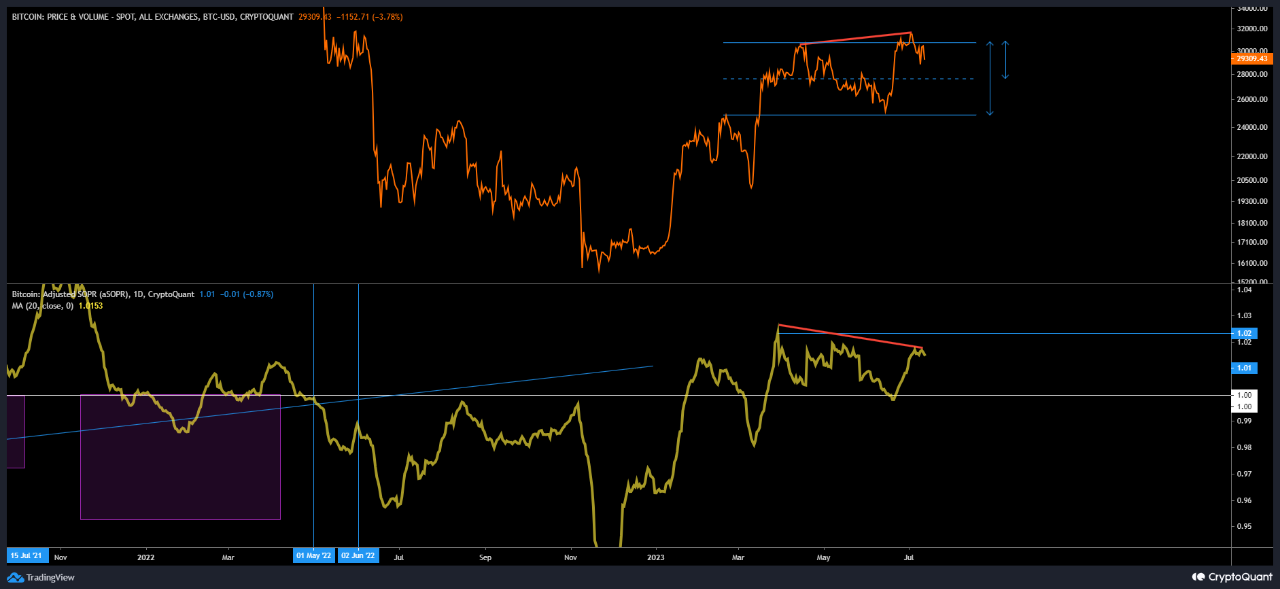
Further follow up on my yesterday's QuickTake - long term view hasn't changed, it's just that the aSOPR bearish divergence has been developing for the past 3 months or so - so patience with regards to finally clearing the 25k - 30k range is advised, short term we may indeed see a sweep down to anywhere between 27,7k - 24,8k, provided, of course, that any entity with enough selling "firepower" doesn't decide to blow right through the spot exchanges orderbooks to the downside by creating imbalances extreme enough that we'd go lower (I still assign any scenario below 25k pretty much low probability)
To conclude this short update of mine:
- high probability we spend some more time within 25k-30k range
- potential headfakes above 32 384 to clear liquidity there possible
- potential deviations below the current range's median as per the screenshot/"ProChart" exhibit also possible
- DCA as if your life depended on it, in terms of spot exposure
- manage your risk if you're margin trading this as if your life depended on it - any "high conviction" plays should be left for after we've left the range either way, I still am adamant that long-term it's going to get broken to the upside, but let's not get ahead of ourselves, shall we?
That's why I remain short-term / mid-term neutral, currently SHORT-TERM leaning slightly bearish due to aSOPR bearish divergence potentially at play.
aSOPR above 1,0235 = your potential lagging confirmation of "we're out of the range" provided that PA concurs.

View original →This is an update of my QuickTake from 14th Jun '23
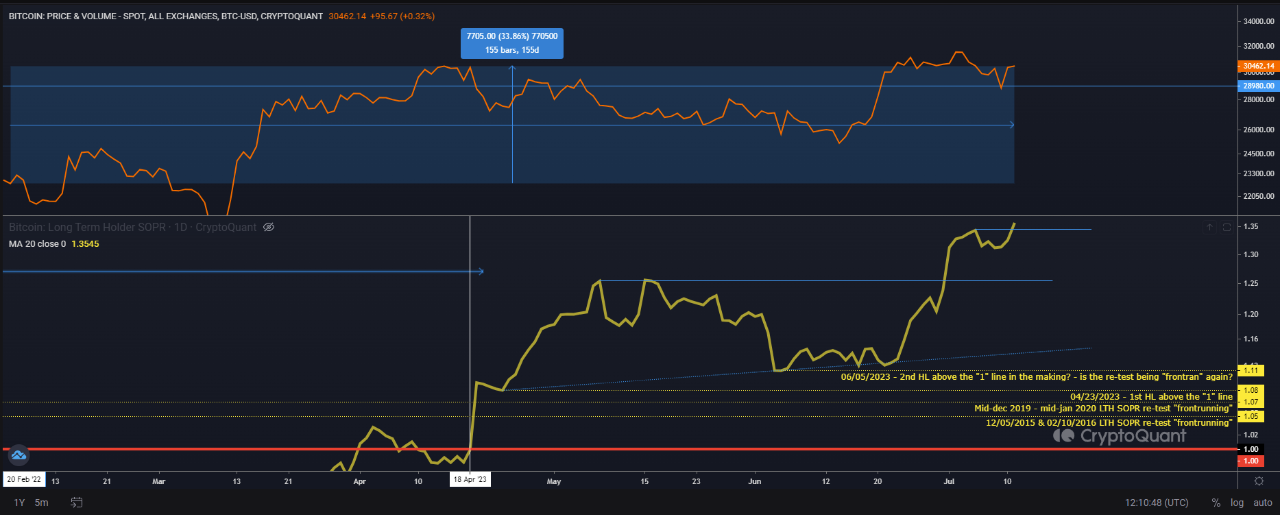
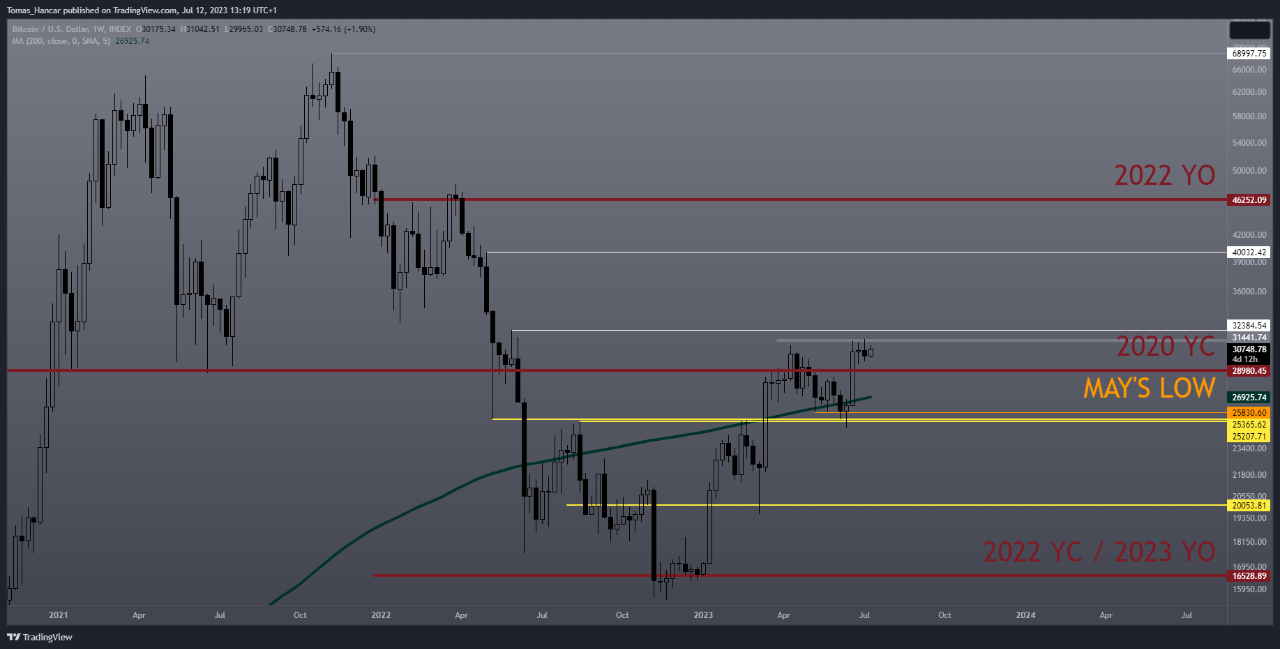
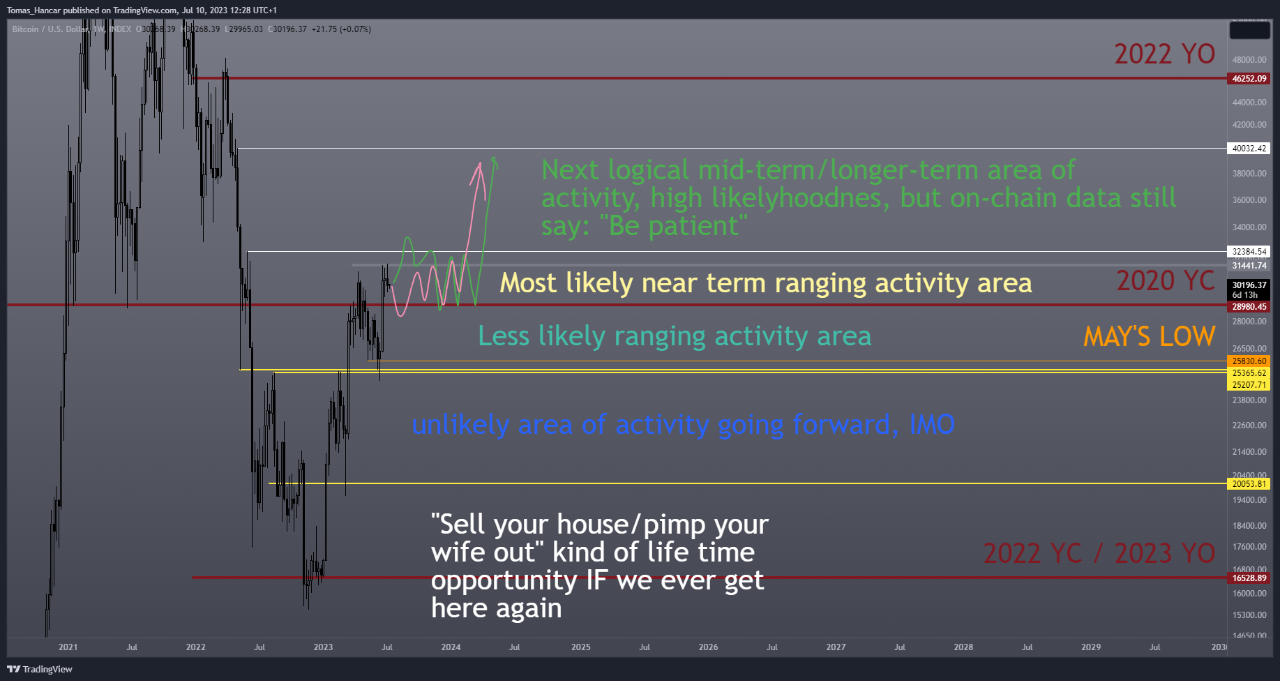
First of all, I'd like to emphasize that short-term to mid-term (few weeks to few months) I'm still leaning neutral pretty much - I don't expect much fireworks beyond the very likely clearling of liquidity above the obviously standing out 32 384 level (whether we then return back to 25k-30k or whether 30k - say 33k then becomes the new range remains to be seen) - as per my QuickTake from monday 10th Jul '23.
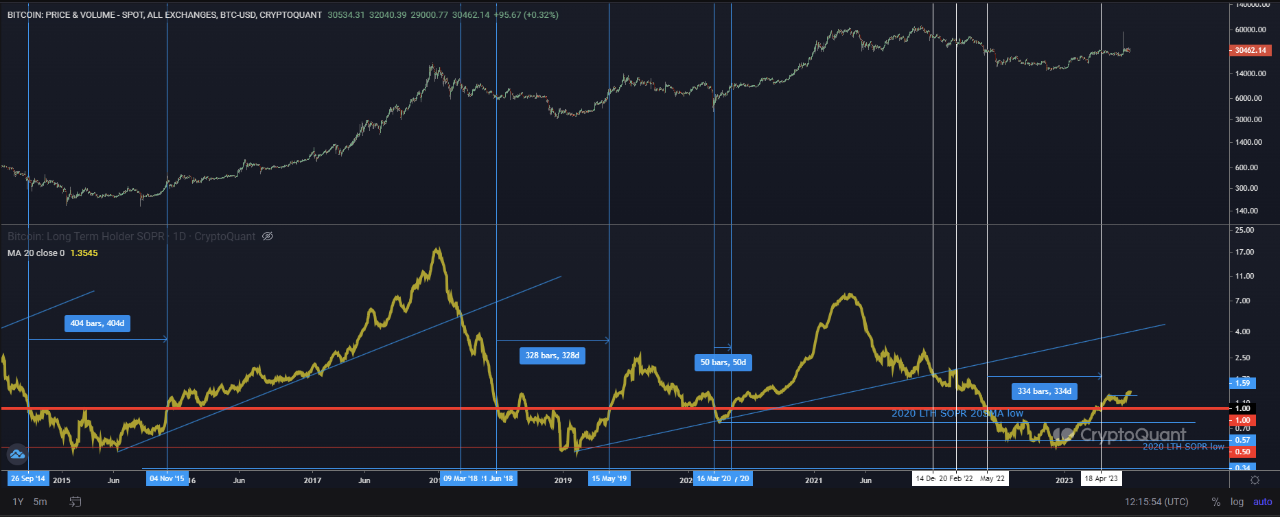
Secondly, I'd like to address the fact that LTH-SOPR keeps on marching higher although price action has been stuck in the 25k-30k range for quite awhile now - the reasons are mainly two fold and are quite simple:
1. LTH-SOPR metric is tracking UTxO's older than 155 days, meaning the newest "freshmen" in terms of contributing to the metric's value have purchased their coins at slightly under 23k, hence this metric is now heavily influenced by anyone who kept on accumulating between say last year's june all the way to the very bottom or potentially this year's january's break out - so all of the move 15,5k - 30k has recently been "kicking in" as far as LTH-SOPR is concerned.
That is, of course, taking into account all of the previous cycle's HODLers who, for whatever reason, may be wanting to realize at least tiny bits & pieces of partial profits, too.
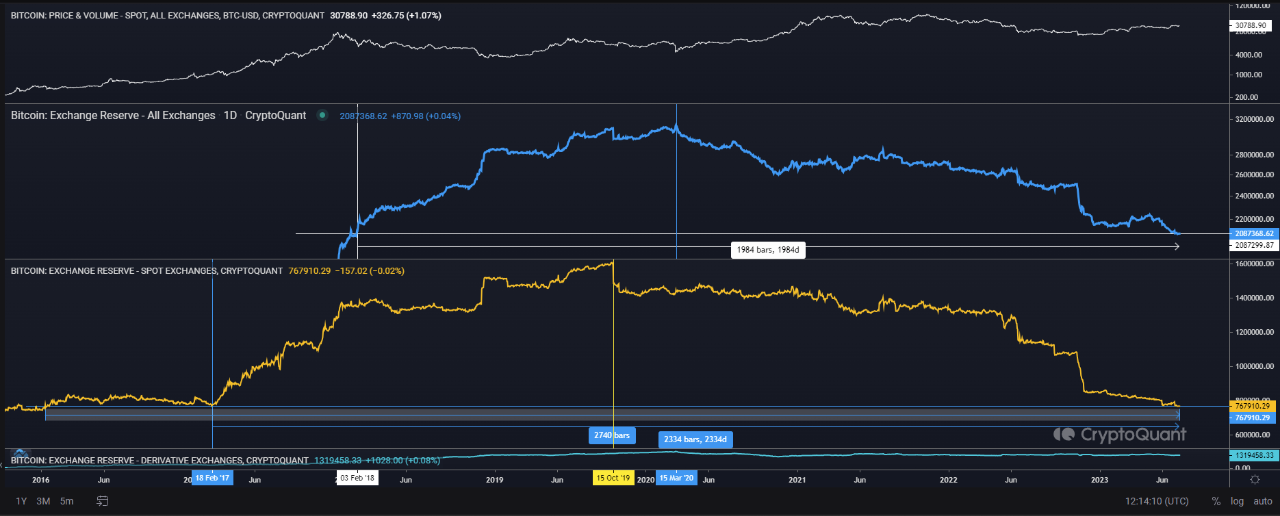
2. The first part of the reason is HEAVILY supported by the fact that close to 70% of Bitcoin haven't moved for at least a year as well as the fact that exchange reserves have kept on diminishing pretty much ever since the 2019's re-accumulation phase:
All exchanges reserves topped out with the mar '20 bloodbath (currently approaching 5,5yr lows), spot exchanges reserves topped out mid oct '19 (currently @ 6,4yr lows, approaching 7,5yr lows)
Combo of MM's having left after SEC crackdown (less liquidity = easier to move/hold PA) + strong resistance around 30k = the reasons we're not A LOT higher just yet.
Patience is in order, as I wrote in my previous QT's

View original →Bullish(Nuanced)BTC
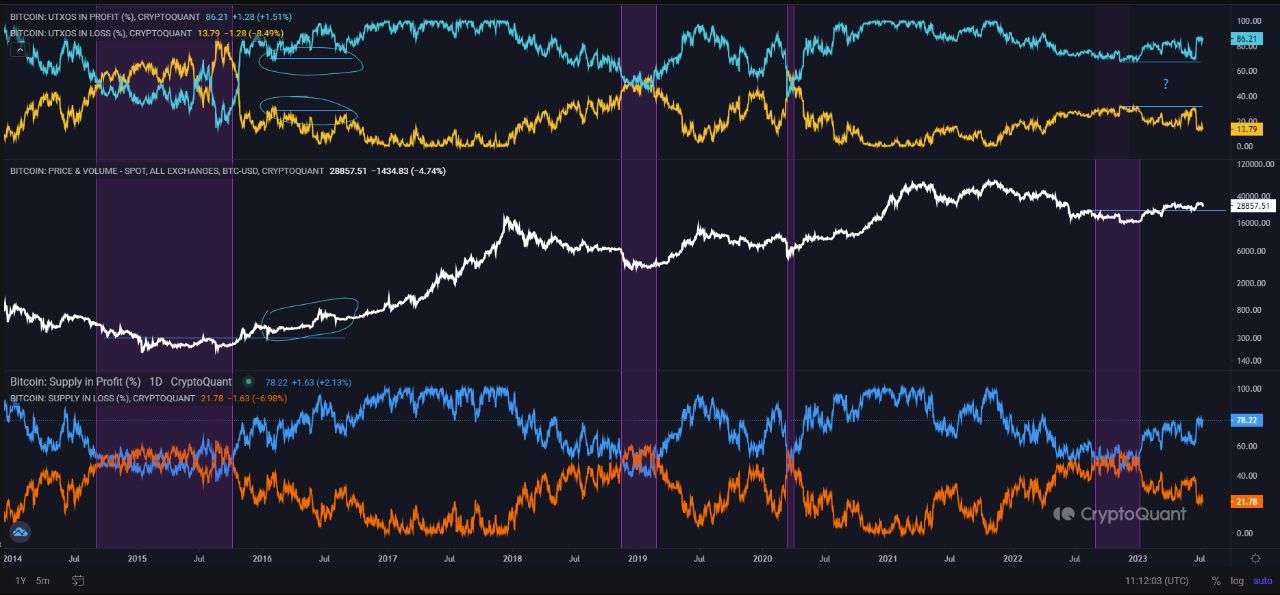
7/10/2023 My last QuickTake post regarding UTxO's % @ P&L from 16th of june posited that we may be in a situation not too dissimilar to the post-bottoming phase of 2015: (https://cryptoquant.com/insights/quicktake/648c3600a6f3c7291efaabad-UTxOs-percentage-PL-closing-in-onto-levels-not-seen-since-end-of-last-year)
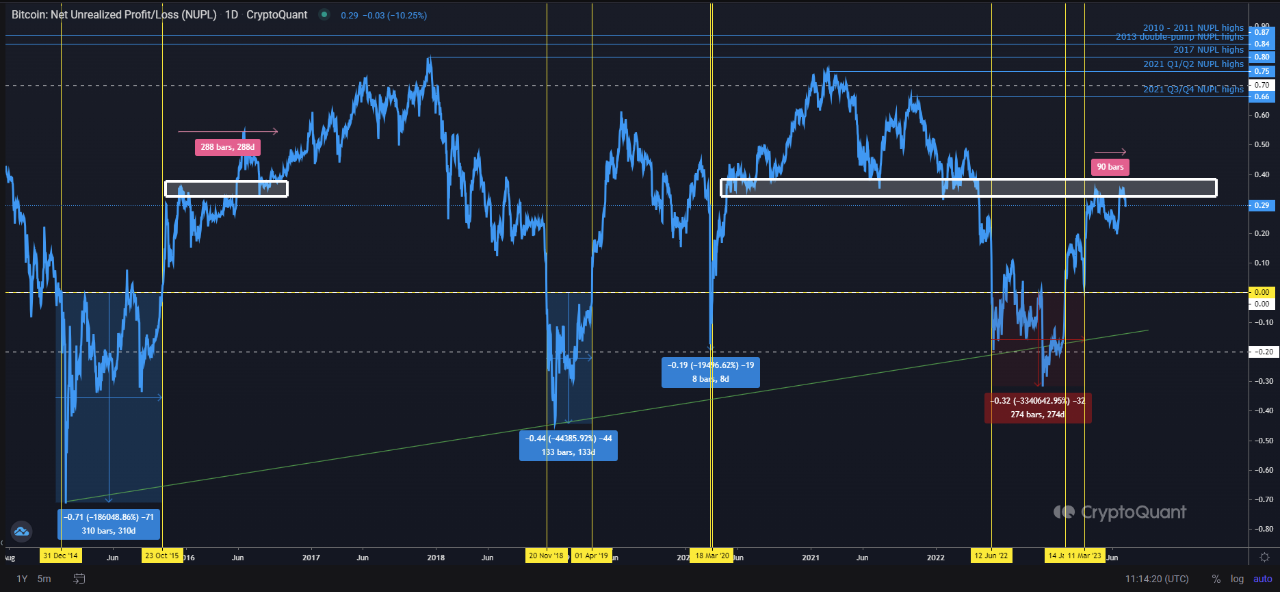
Currently it looks like my last mid-months speculation is unfolding, while the NUPL TA structure caveat mentioned in my last QuickTake from about a week ago (https://cryptoquant.com/insights/quicktake/64a3df1c2ec8802caaf15c45-BTC-SSR-update-comments-on-NUPL-weekly-monthly-quarterly-closes) still holds true - you can see a clear rejection off the 0.35 resistance zone in NUPL (it's been about 3 months of resistance, currently)
As mentioned in my last QuickTake, it's likely that we stay in the current range for awhile, before likely another leg up. In terms of UTxO's % at profit, the "range low" of approx 66% = a no brainer BTFD no matter what the BTC price, the breaking of current highs of 87,13% together with a PA pending further break out confirmation = a no brainer stop buy kind of break out above 30keks - this time with conviction.
Further on-chain confluence, as previously mentioned, can be added with a decisive NUPL break out above 0.35.
I am very confident in my above assesment, ONCE it materializes in the described manner, HOWEVER, I'd like to stress out and emphasize that we're QUITE NOT THERE yet.
What does that mean?
HODLers/strategic allocators - I suggest you keep on accumulating, any BTC PA drawdowns = opportunity to be a bit more aggressive with your DCA strategies especially.
Speculators, espcially if utilizing leverage - I suggest you wait this one out, or if you MUST speculate, be extremely conservative with your risk parameters.
The above on-chain assesment is in line with PA being prone to clearing liquidity above 32 384 and then letting the volatility keep on getting compressed as we keep on ranging further.
(Keep stacking & manage risk!)

View original →Bitcoin Stablecoin Supply Ratio update:
Definition: Stablecoin Supply Ratio (SSR) is defined as a ratio of the Market Cap of BTC divided by the Market Cap of all Stablecoins. (that's literally like BTC MC/Stablecoins MC)
My last "QuickTake" post on BTC SSR:
https://cryptoquant.com/insights/quicktake/6482d561e926de4bebd3e4eb-Bitcoin-Stablecoin-supply-ratio-a-bullish-2000-days-educational-lookback - a bit of an educational lookback ended on a positive outlook note
Further basic recommended reading - I'll refer you to the CryptoQuant dataguide https://dataguide.cryptoquant.com/stablecoin-exchange-flows-indicators/stablecoin-supply-ratio
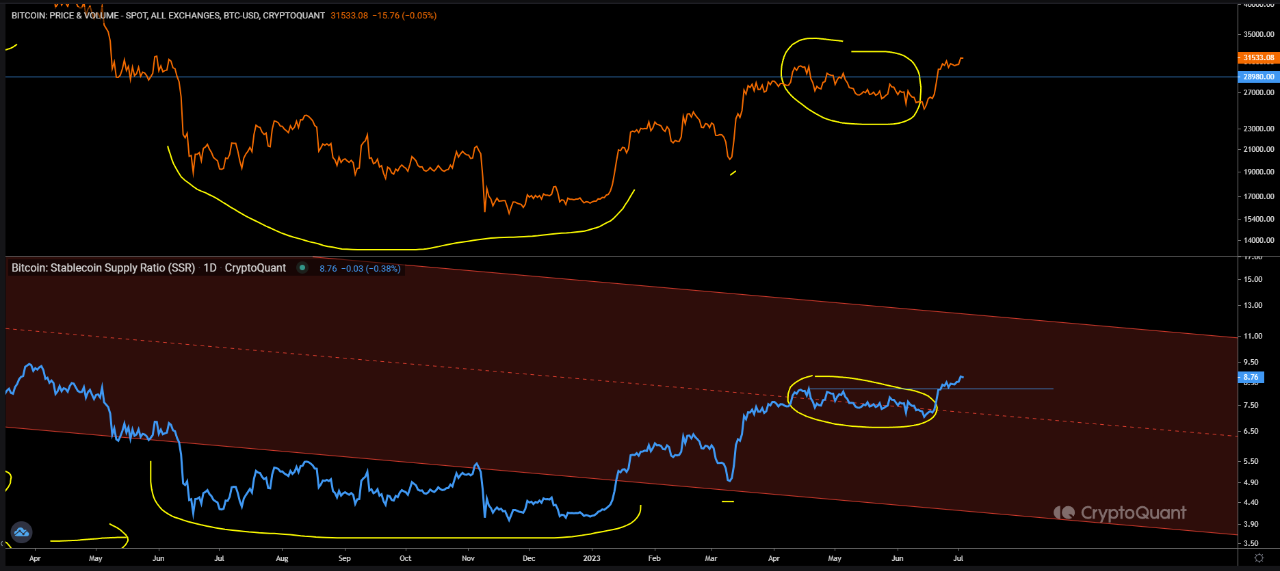
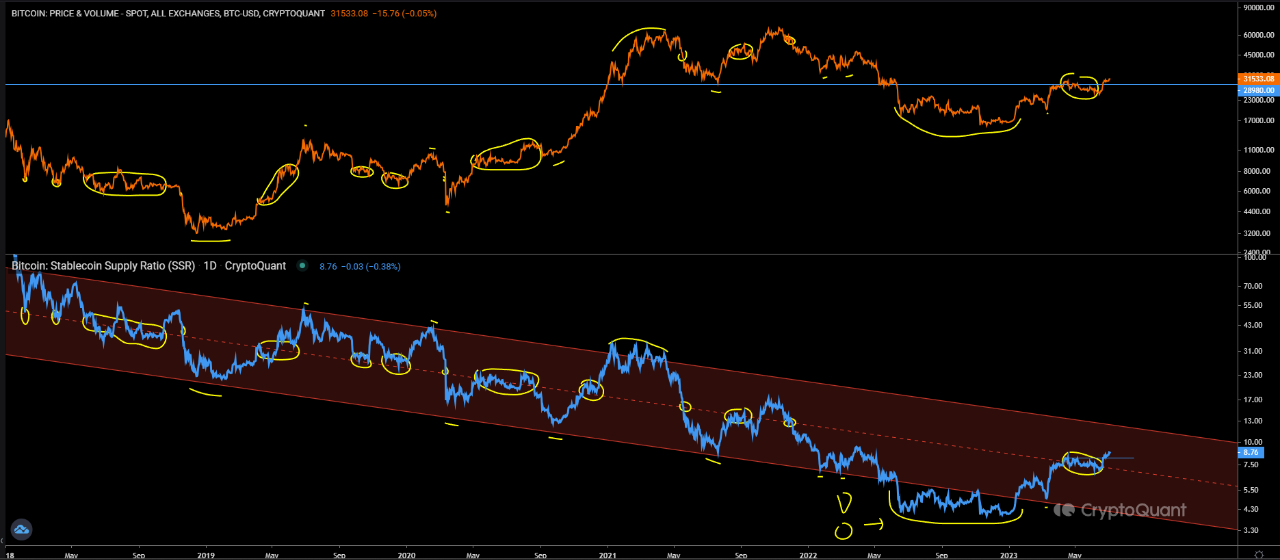
The update: Long-term outlook hasn't changed on bit, the SSR downtrend channel intact, HOWEVER, since my educational lookback about a month ago, the channel's median has been broken to the upside with a "confirmation" in the form of having made new highs.
Just as I suggested at the end of my last BTC SSR update - the Bitcoin's price action's uptrend continues.
Apart from undeniably bullish price action:
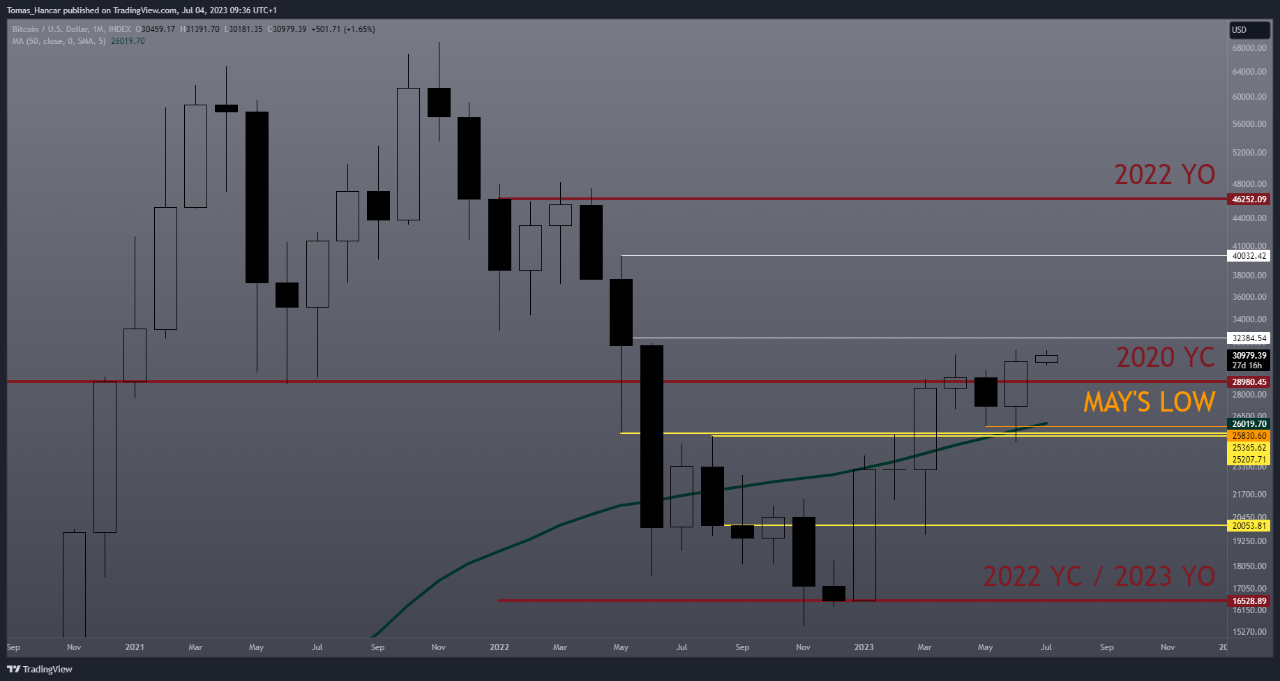
- may's low clearance + weekly, monthly & quarterly closes above the absolutely key 2020 YC of 28980
- weekly bounce off of & close above the 200MA / monthly bounce off of & close above the 50MA
- quarterly bullish candle close way above the aforementioned 2020 YC of 28980
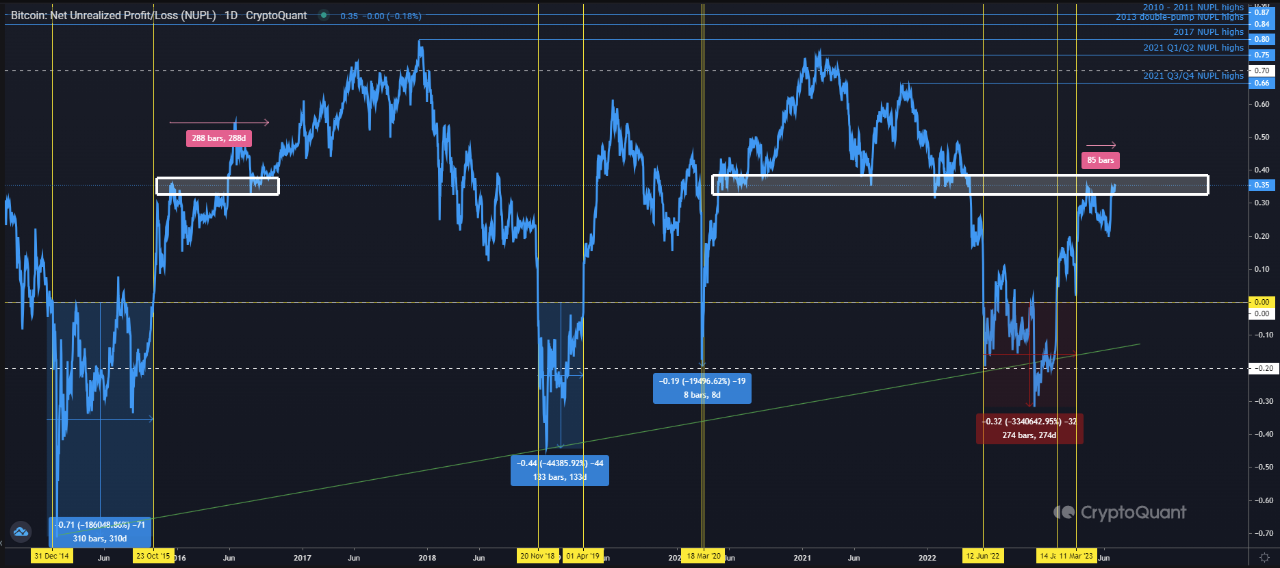
We also see that the NUPL metric (https://cryptoquant.com/asset/btc/chart/network-indicator/net-unrealized-profit-loss-nupl?window=DAY&sma=0&ema=0&priceScale=log&metricScale=linear&chartStyle=line - general chart link) has returned back to the "orange" phase from "green" (early bull market) phase about 3 weeks ago.
That said, however a closer look at NUPL structure warrants a patient approach - while we may have broken 30k decisively - the NUPL ~.35 zone suggests there likely will be a lot of panic break-even sellers as well as opportunistic profit takers until after 30k is cemented as a support again:
https://cryptoquant.com/prochart/FVhHJCLsEm7gqPp (NUPL)

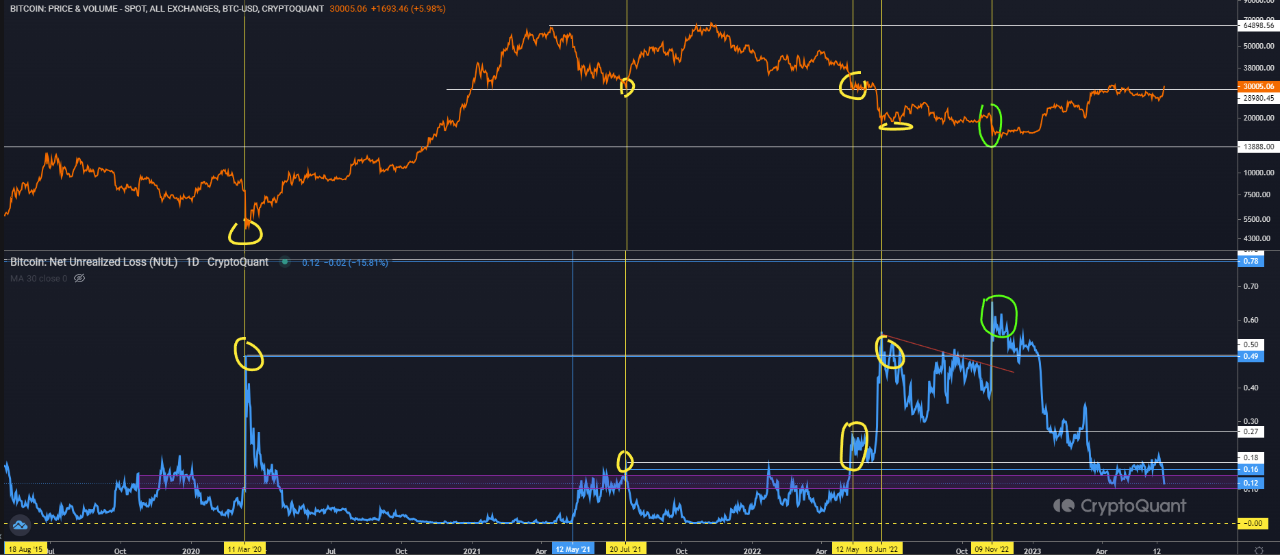
View original →Definition: Net Unrealized Loss (NUL): Sum of UTxO being in loss with the price difference between created and destroyed.
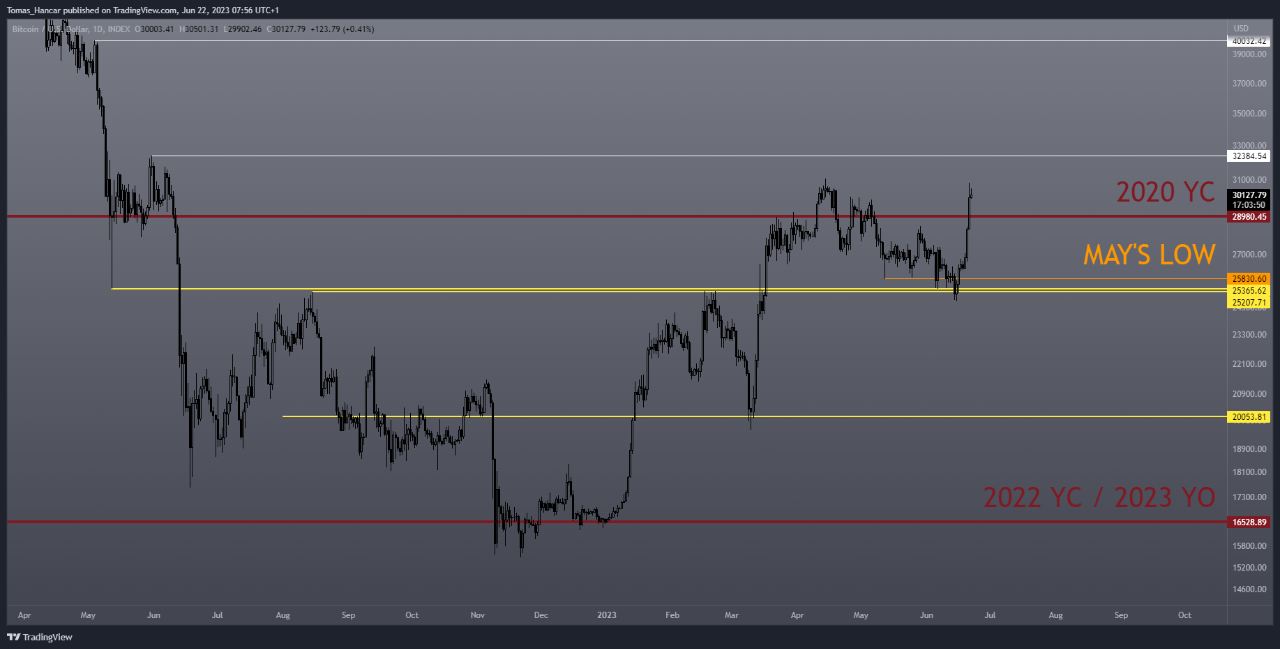
The NUL metric has plummeted back into a key territory between 0.14 & 0.10 as Bitcoin managed to get back above the key technical resistance of 2020 yearly close of 28980, which previously served as an area of interest from both support (jan '21 - jun '22) as well as resistance (june '22 - present => monthly close will be key from technical perspective).
The NUL's congestion zone between the aforementioned levels has served as a key area of congestion from both sides for at least about 4 years now and "technically" speaking, looks like it's about to take a dive lower, signalizing the potential for further Bitcoin's rise in price.
That said, we've had a substantial price appreciation in the past week or so and while in the big picture it sure as hell is still an excellent time to be doing your regular DCA chores, I would be cautioning against using too much leverage with your margin trading accounts - there may still be a chop or, alternatively, a well deserved punishment of potential late longs that may have "overslept" the past few days of incredibly swift Bitcon's price rise.
Feel free to speculate as much as you want as long as you're managing your risk well and don't size your positions in a manner that would have emotional impact on your decision making.

View original →

