Bullish(Nuanced)BTC
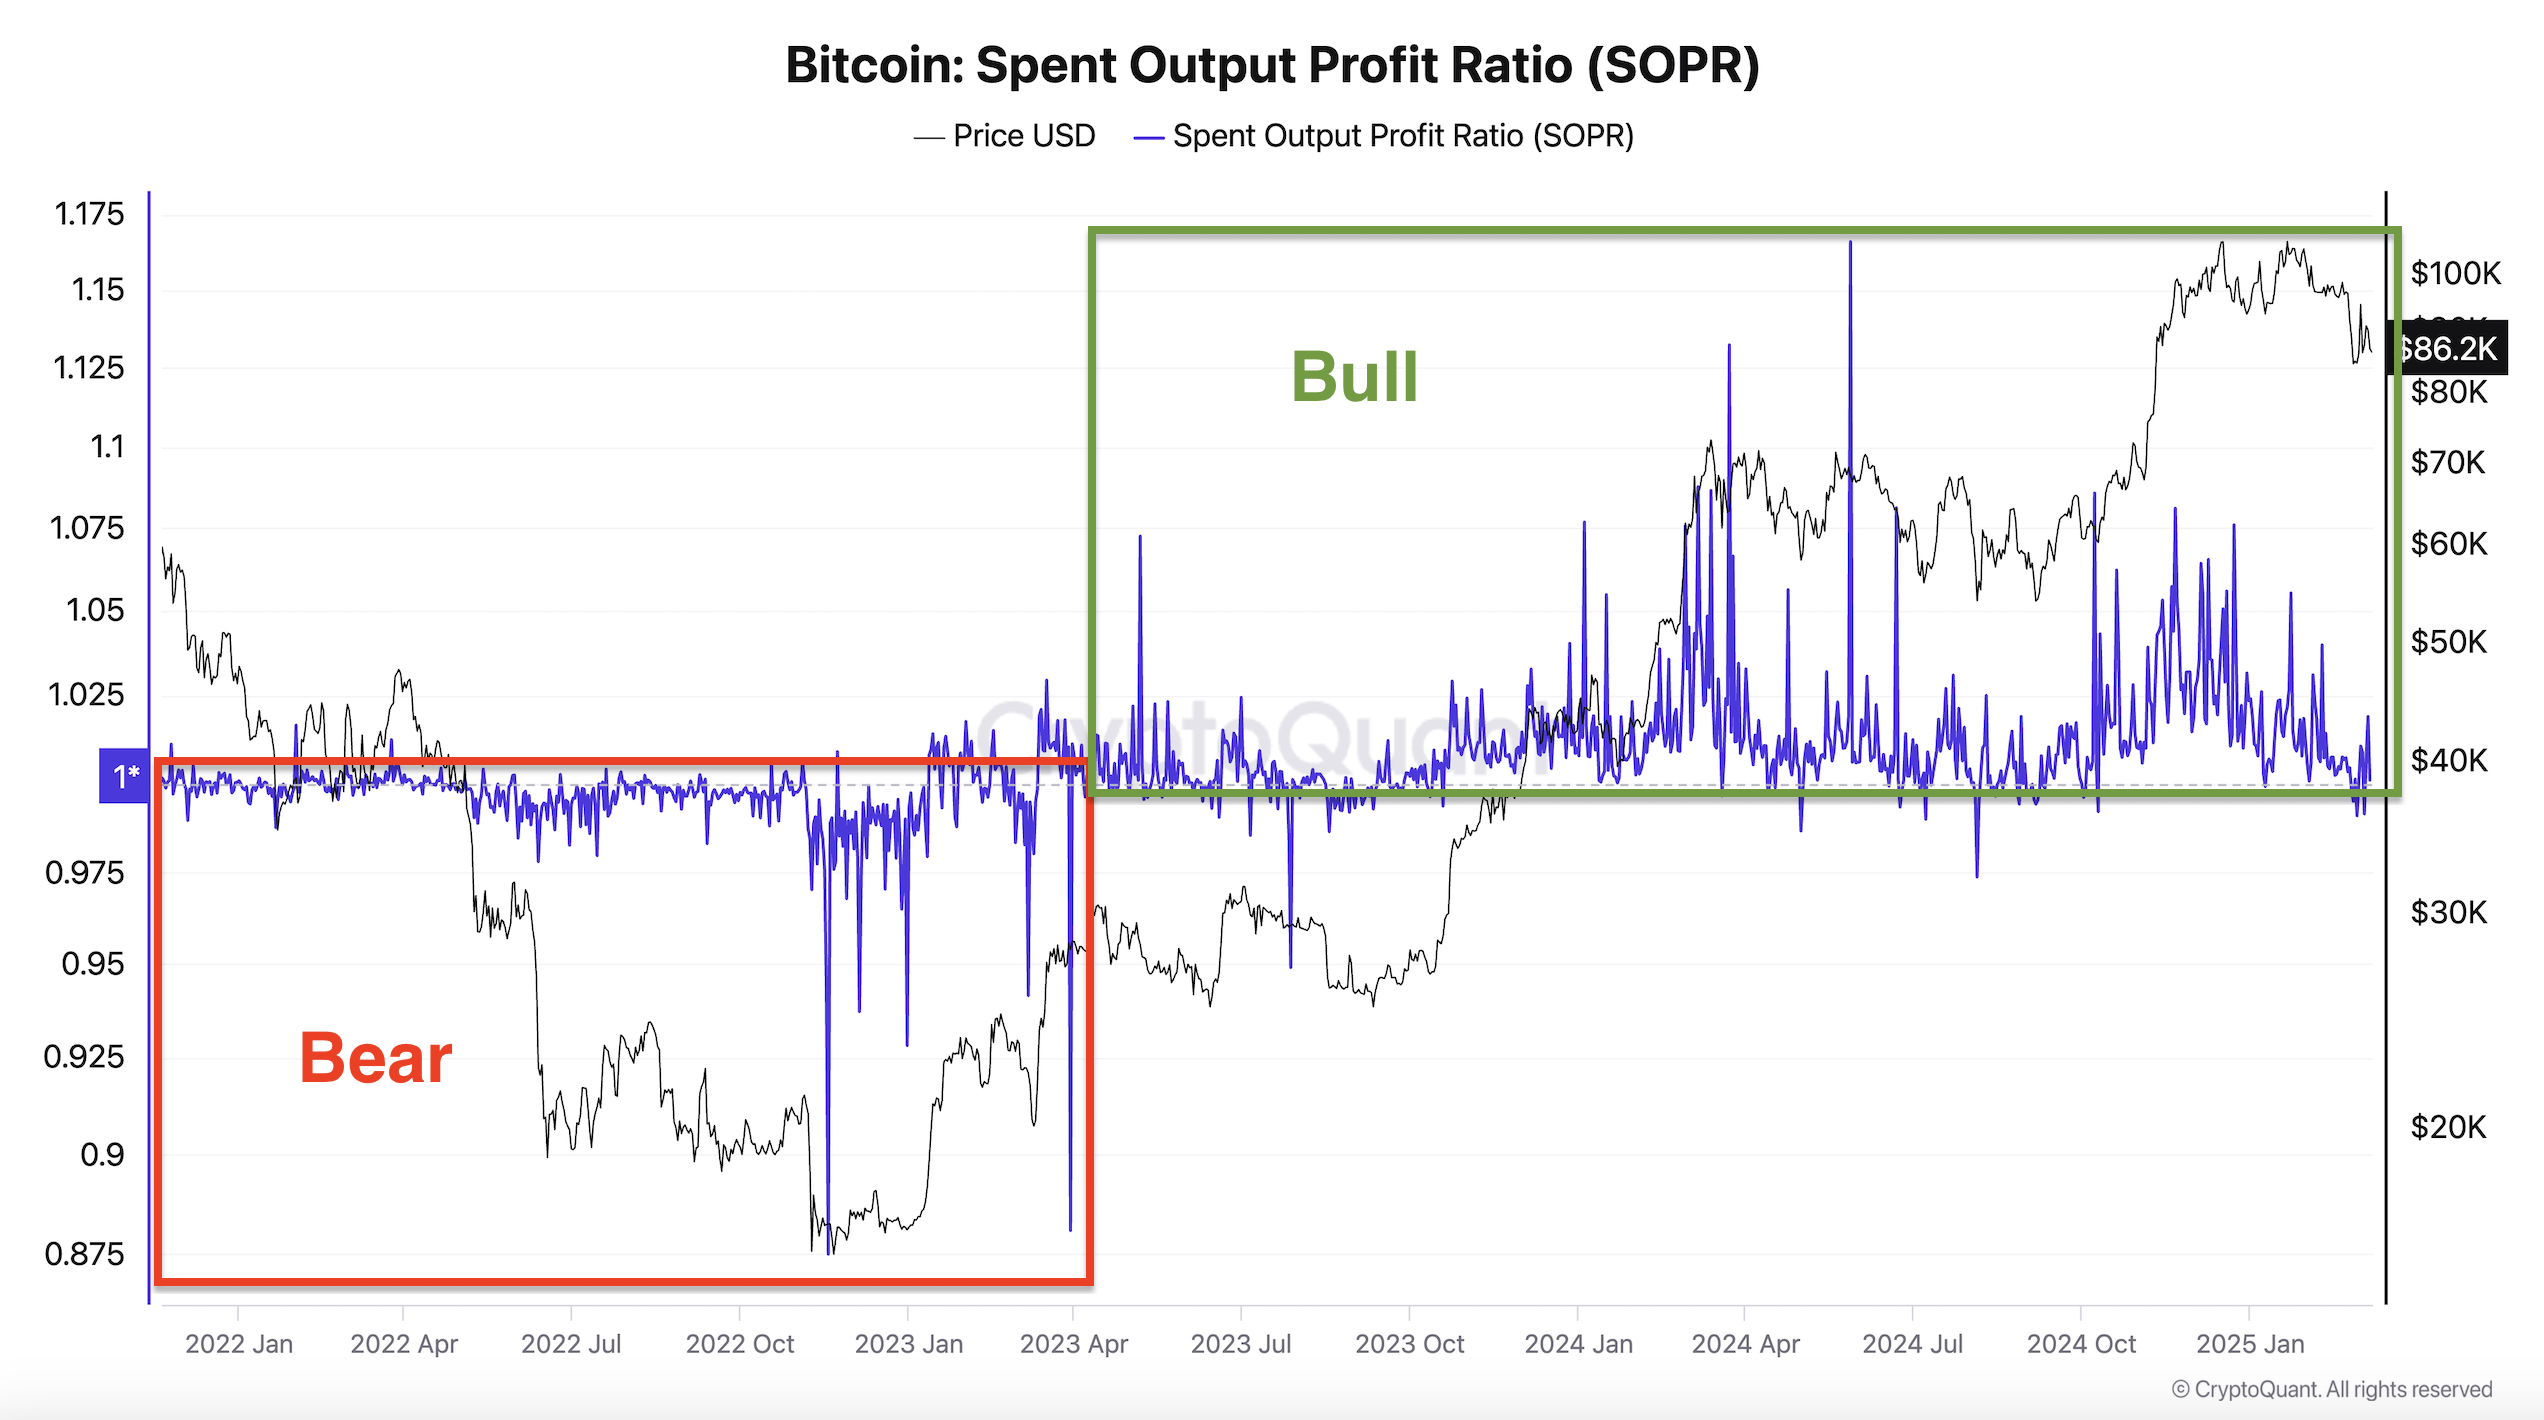
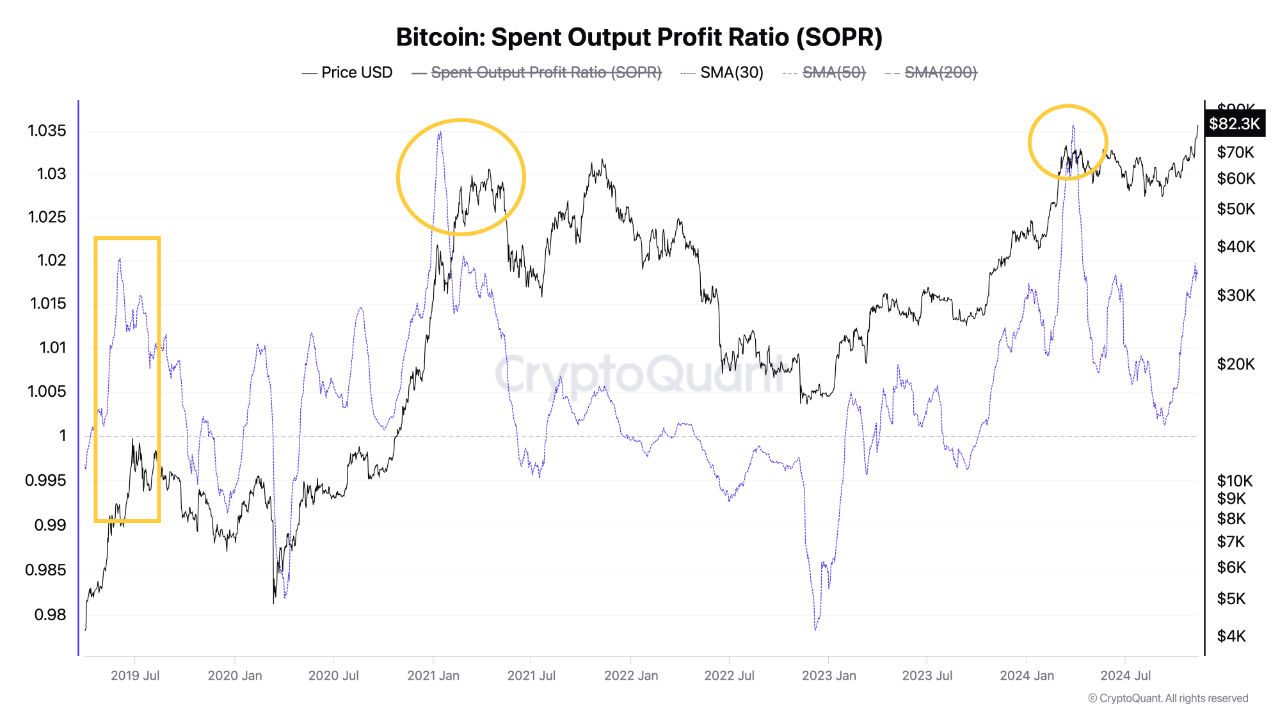
3/8/2025 Once you believe you're in a bull market, it’s hard to change your sentiment. We're going through a period where the bulls' perception is being seriously tested. To distinguish a bull market from a bear market, we can look at the SOPR. In a typical bull market, people move their sats in profit, resulting in an SOPR greater than 1, unlike in a bear market. From this perspective, the bull market still seems to be in play.
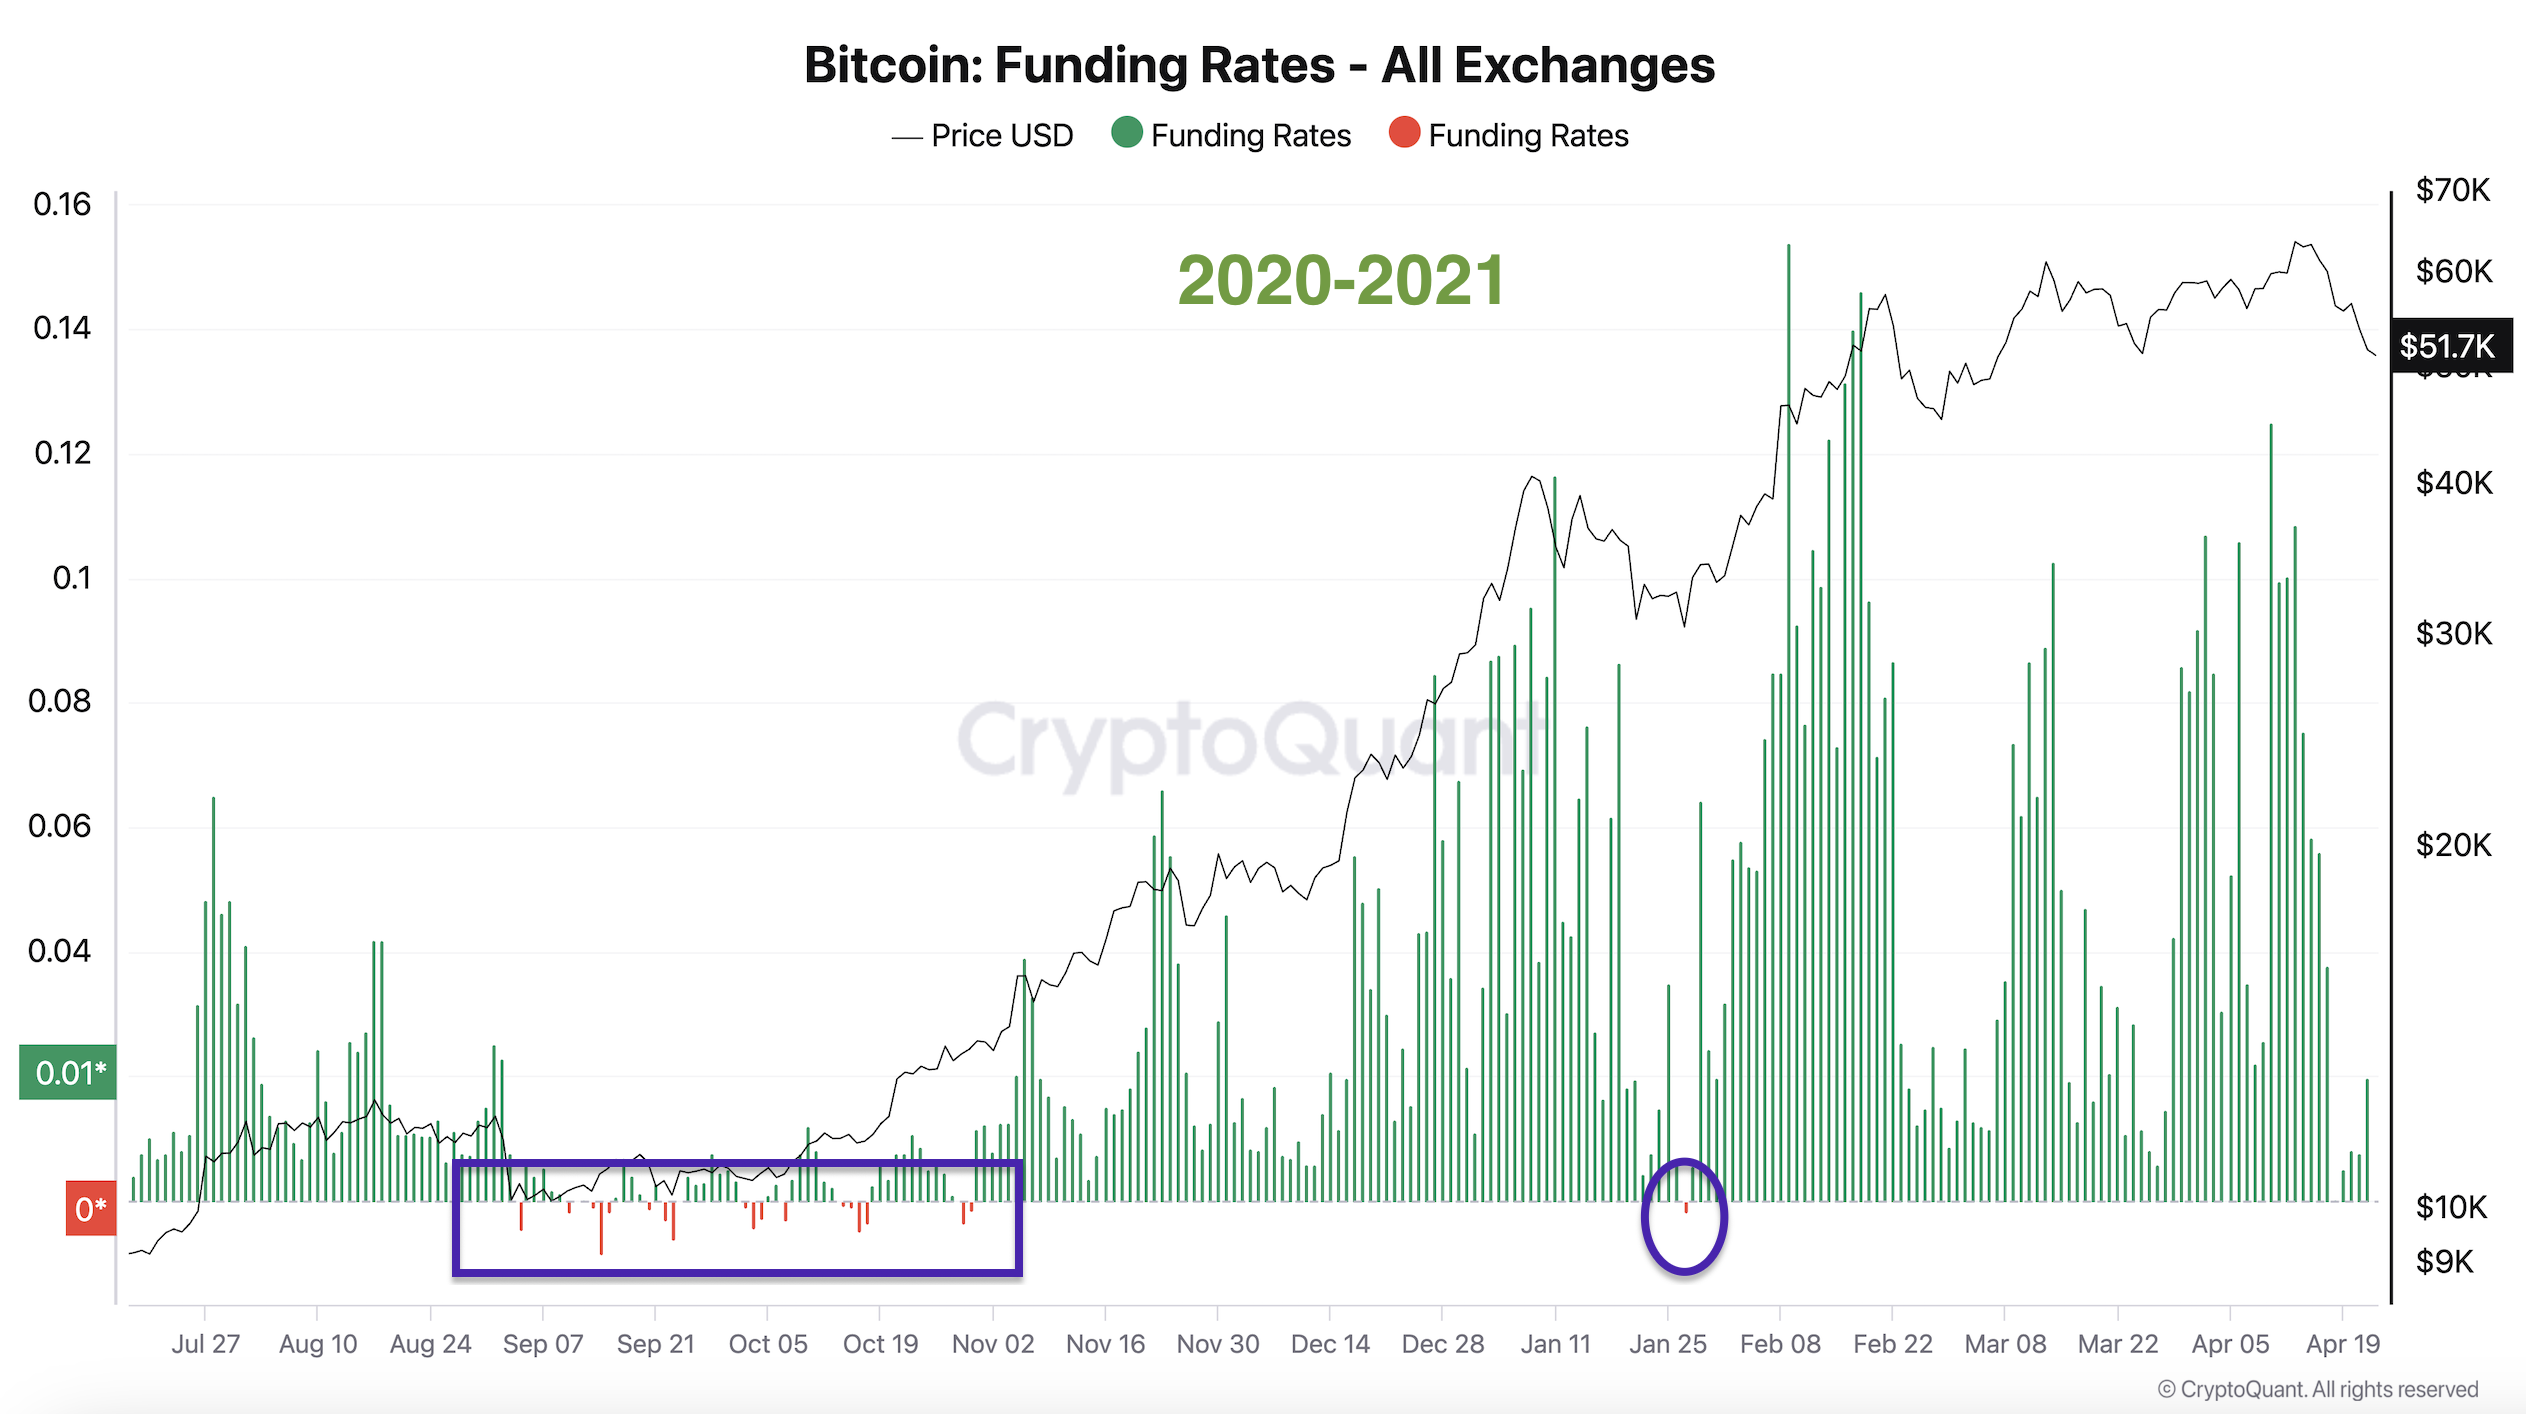
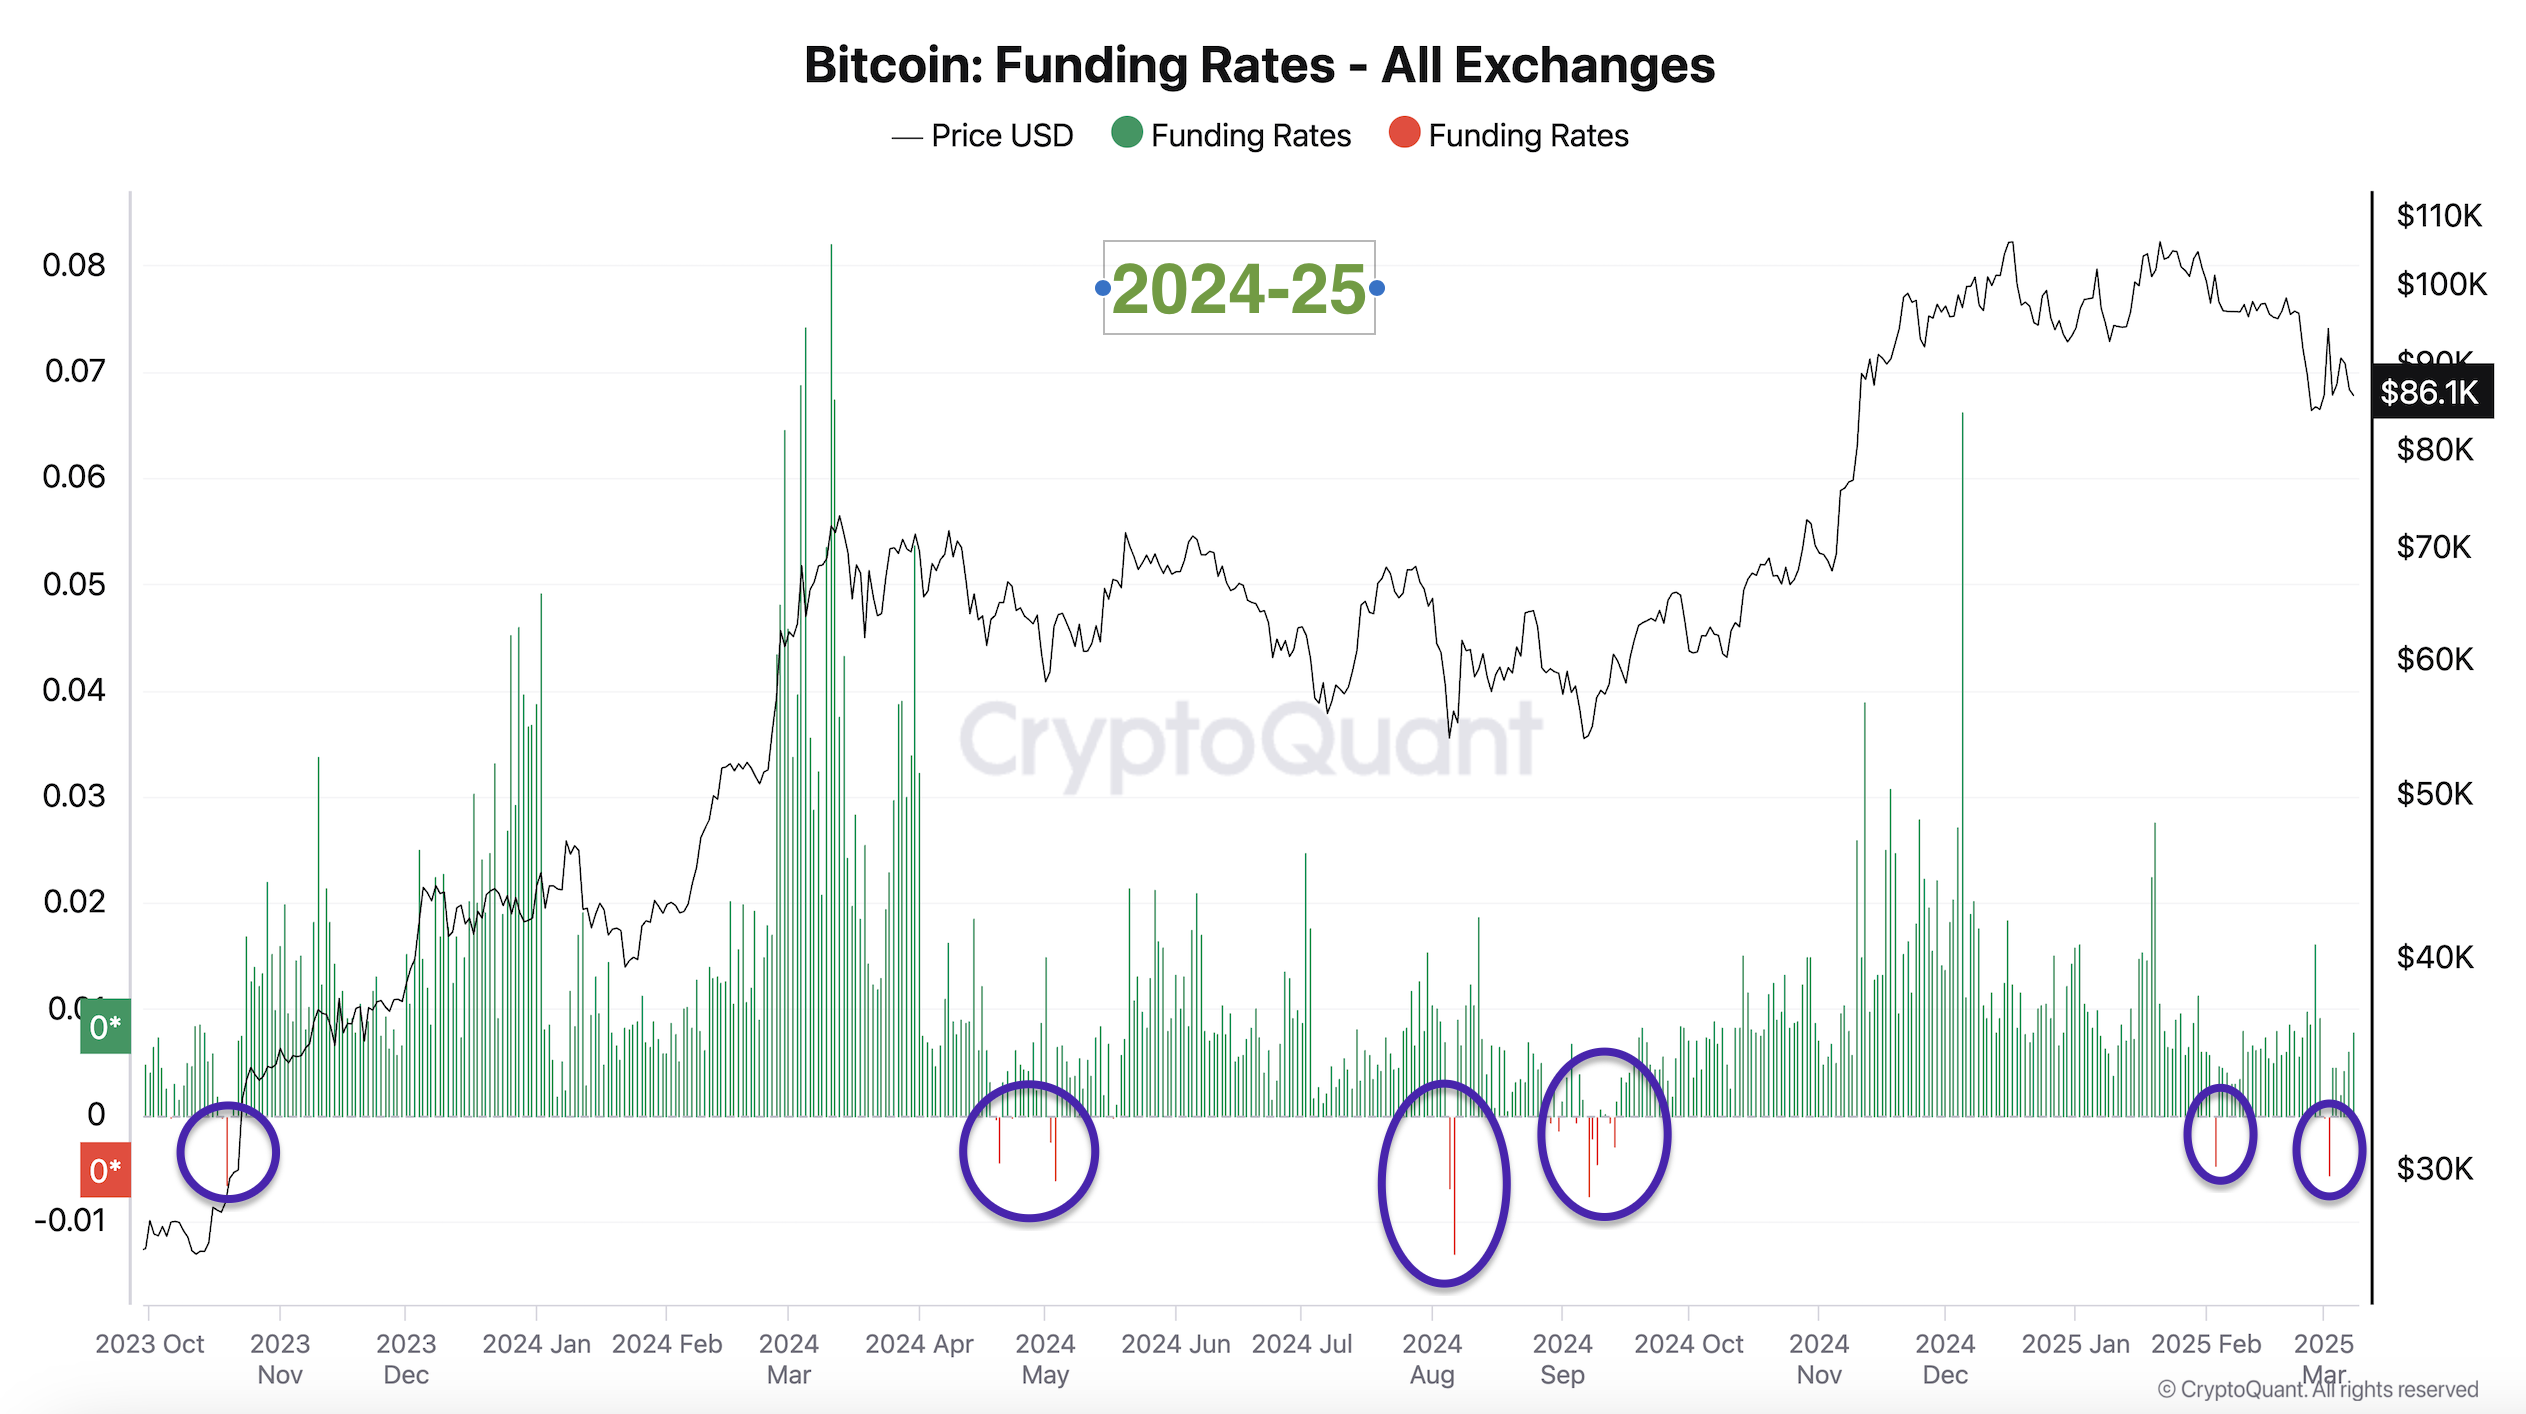
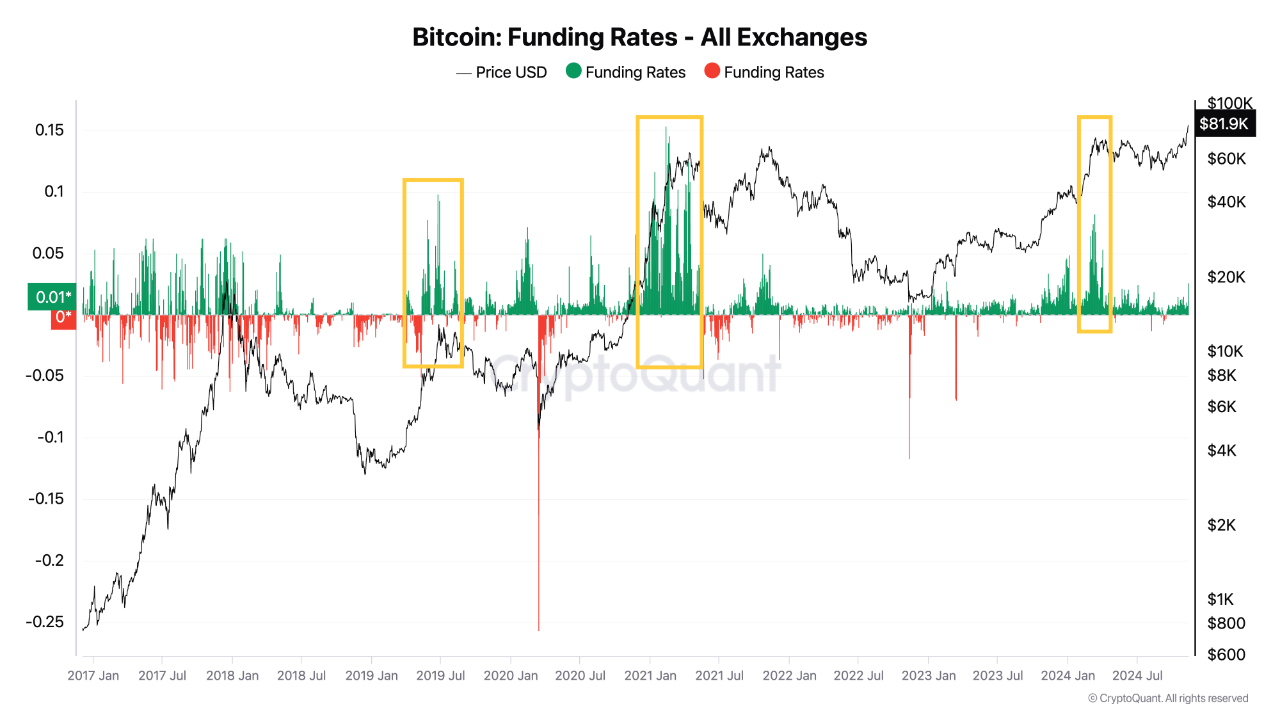
Funding rates are another strong indicator, and they rarely turn negative in bull markets. The second graph shows their trend during the 2020-21 bull run (up until the first peak in April). The current trend still resembles that same bull market pattern in terms of funding rates.
In conclusion, for bulls to be convinced that the market has shifted, SOPR and funding rates need to drop below critical levels more frequently than before

View original →Bullish(Nuanced)BTC
12/8/2024 In this cycle, we saw a maximum 30% decline in Bitcoin's price, which is modest compared to previous cycles. This occurred in August during the so-called 'carry trade shock.' The most likely factor cooling down major shake-outs appears to be ETFs. Waiting for the next big correction to enter the market or add fresh capital might result in being late to the rally. On the other hand, being overly aggressive while the market is surging could be risky. So we better try to understand where we're now.
1.ETFs: Still showing strength, with Coinbase premium highly positive.
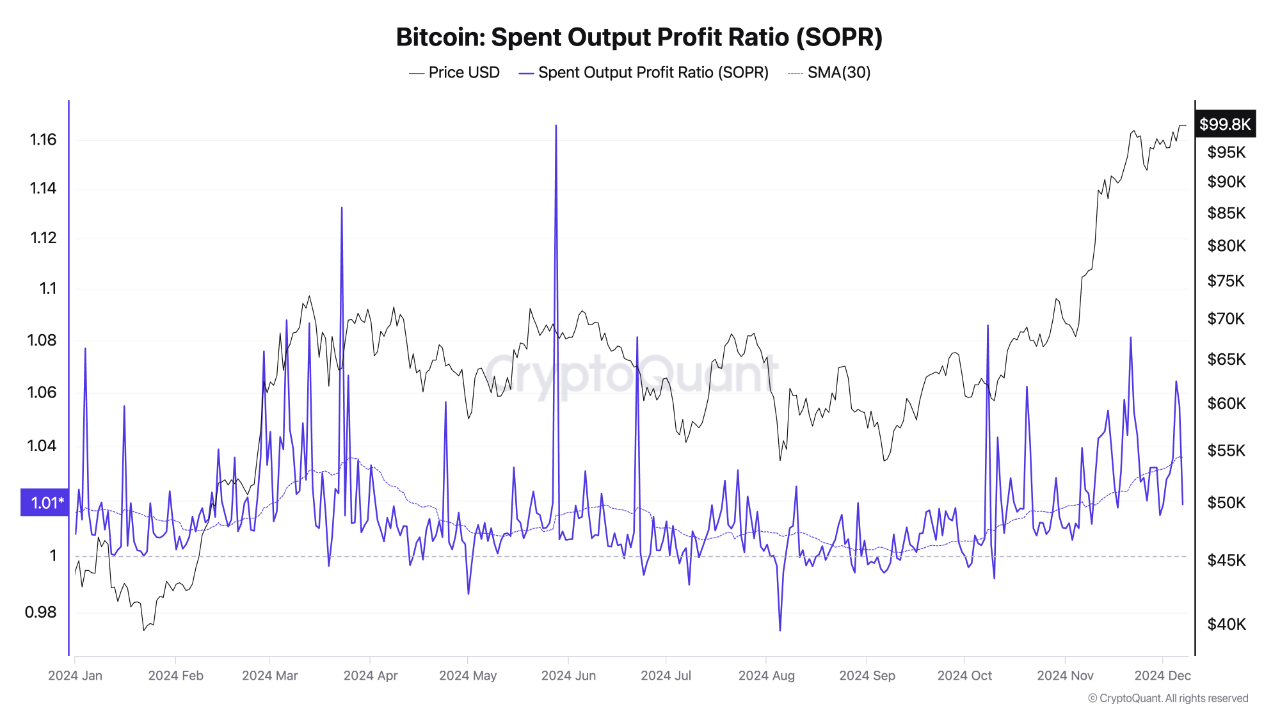
2.SOPR: Appears to have cooled down a bit, which seems healthy.
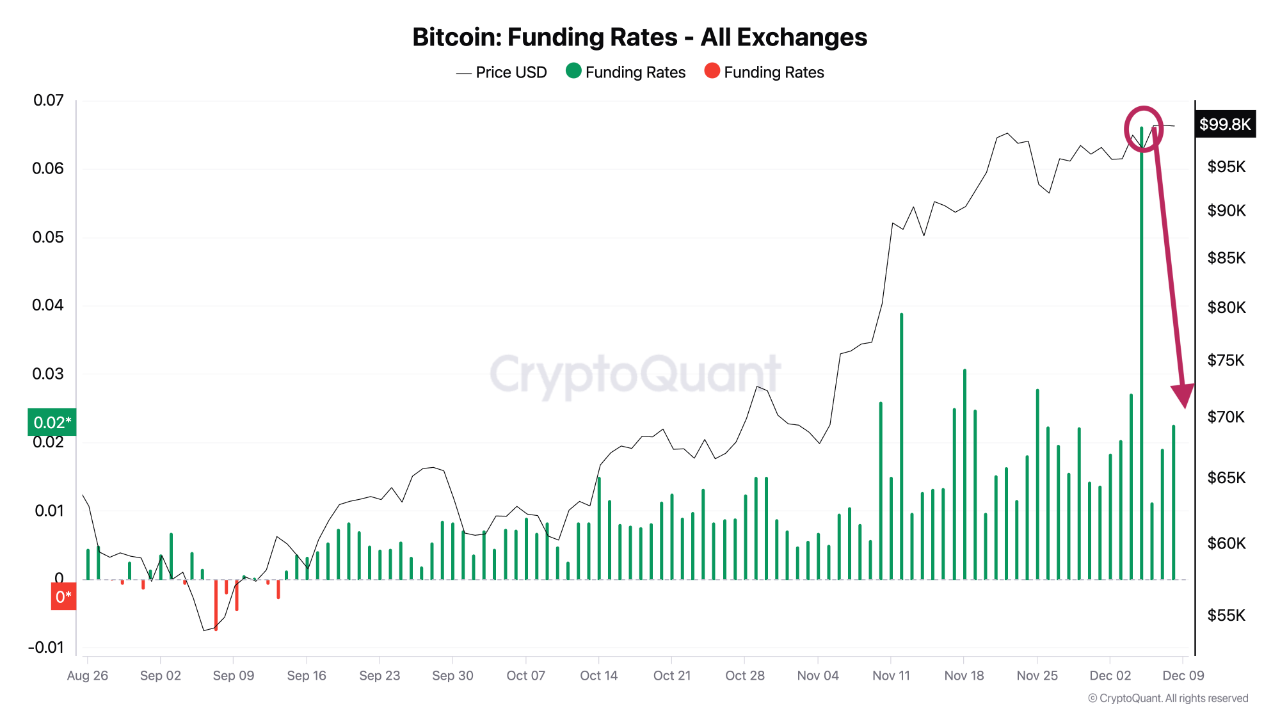
3.Funding Rate: Dropped after a sudden shake-out in Bitcoin's price on Thursday.
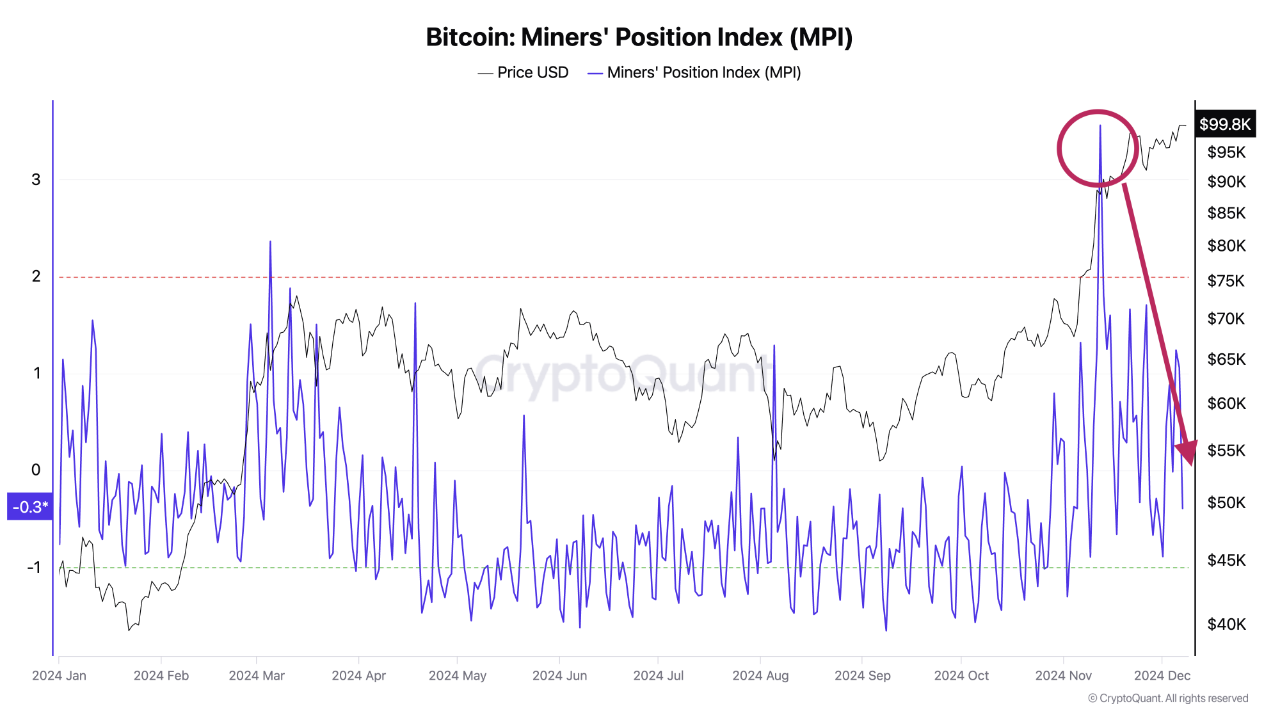
4.Miners: Don't appear to be in a rush to sell.
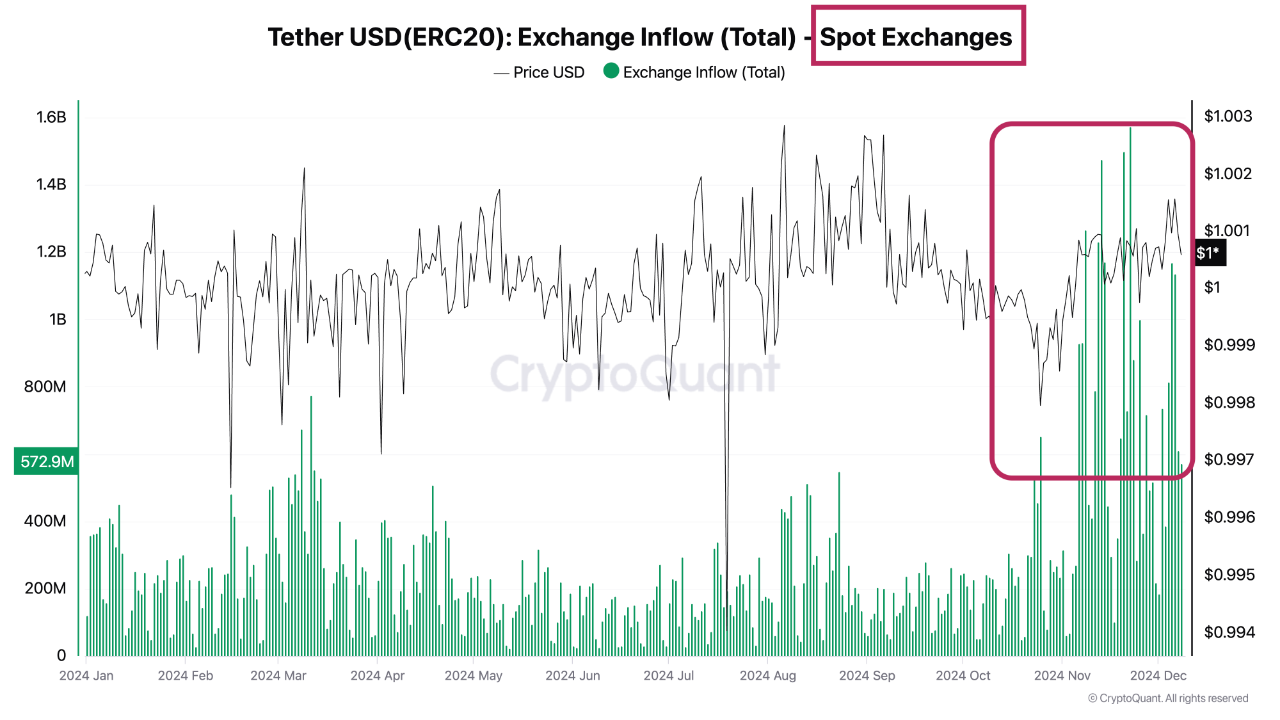
5.Stablecoin Flows to Spot Exchanges: Higher than they’ve been at any point this year.
In conclusion, a correction could happen at any time without a specific reason, but the current situation doesn’t indicate a shift in momentum.

View original →Bitcoin investors' questions never end. We always think about when it will reach a new all-time high (ATH), and once it happens, we start asking when it might top out. Fortunately, we have many tools to track whether the market is overheated or not. In this analysis, I want to mention two charts that I pay close attention to and two other charts that I pay less attention to
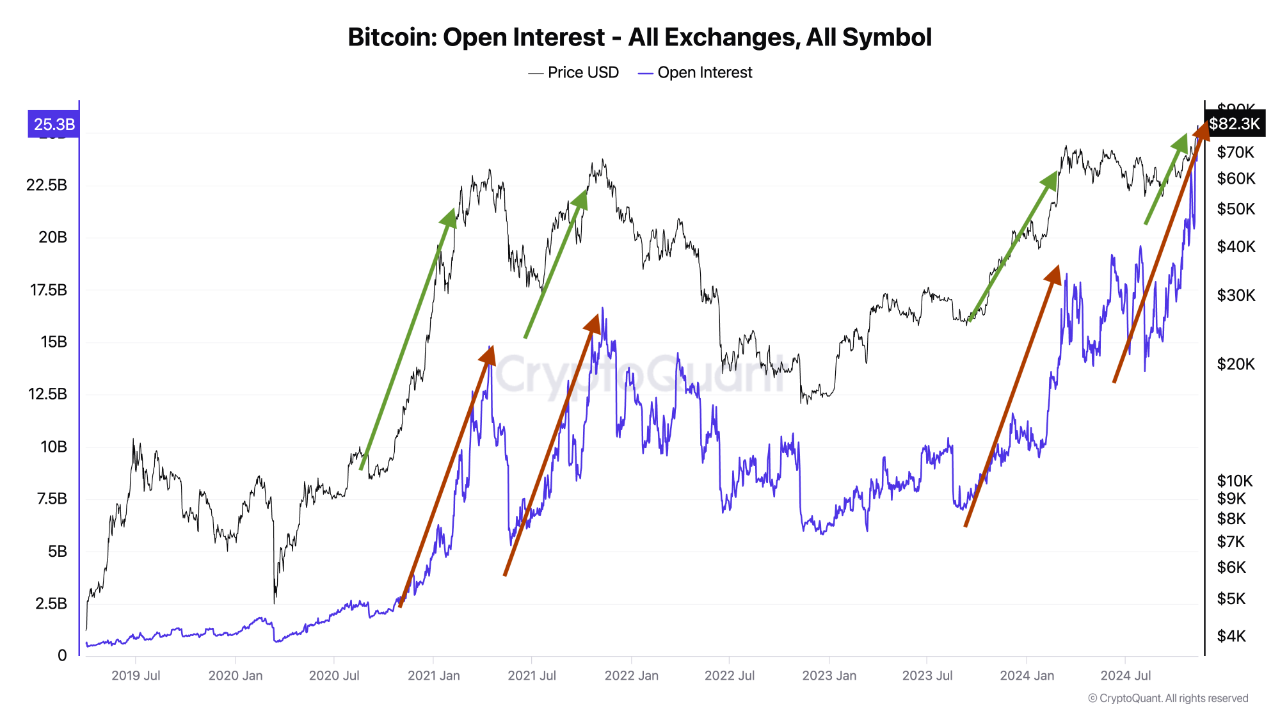
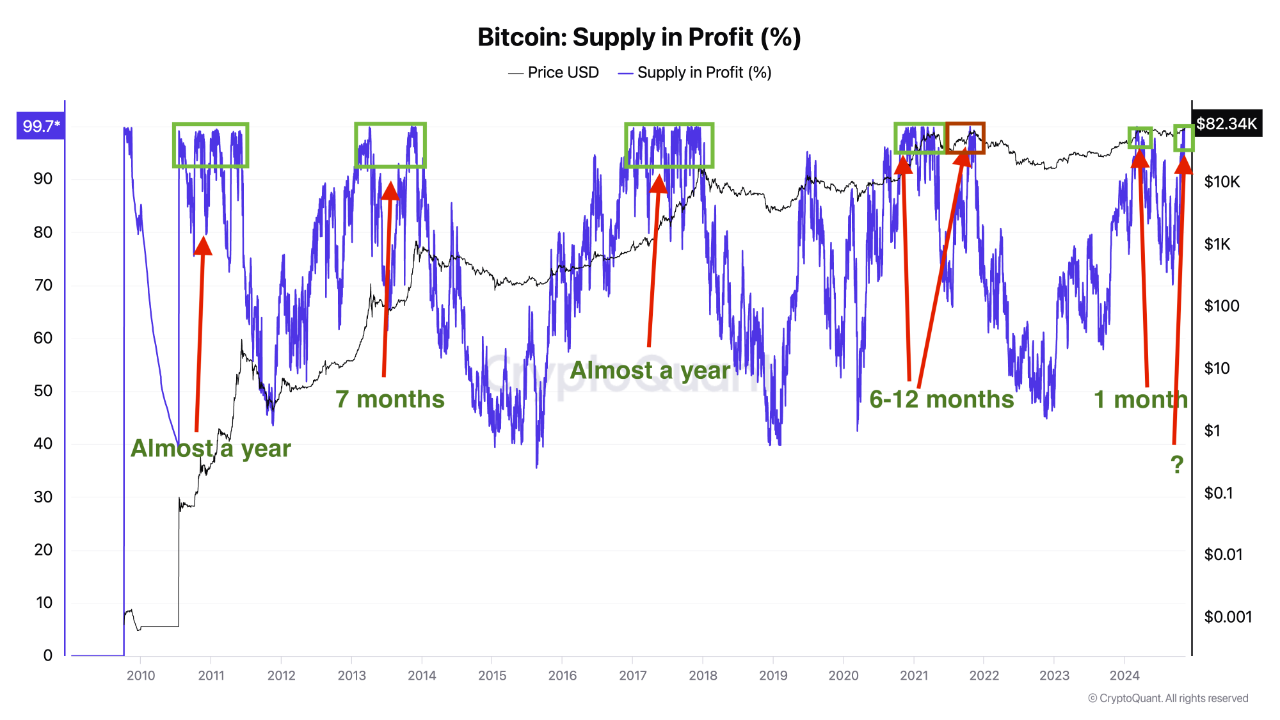
Two charts that I think may be misleading for tracking the market are open interest and supply in profit.
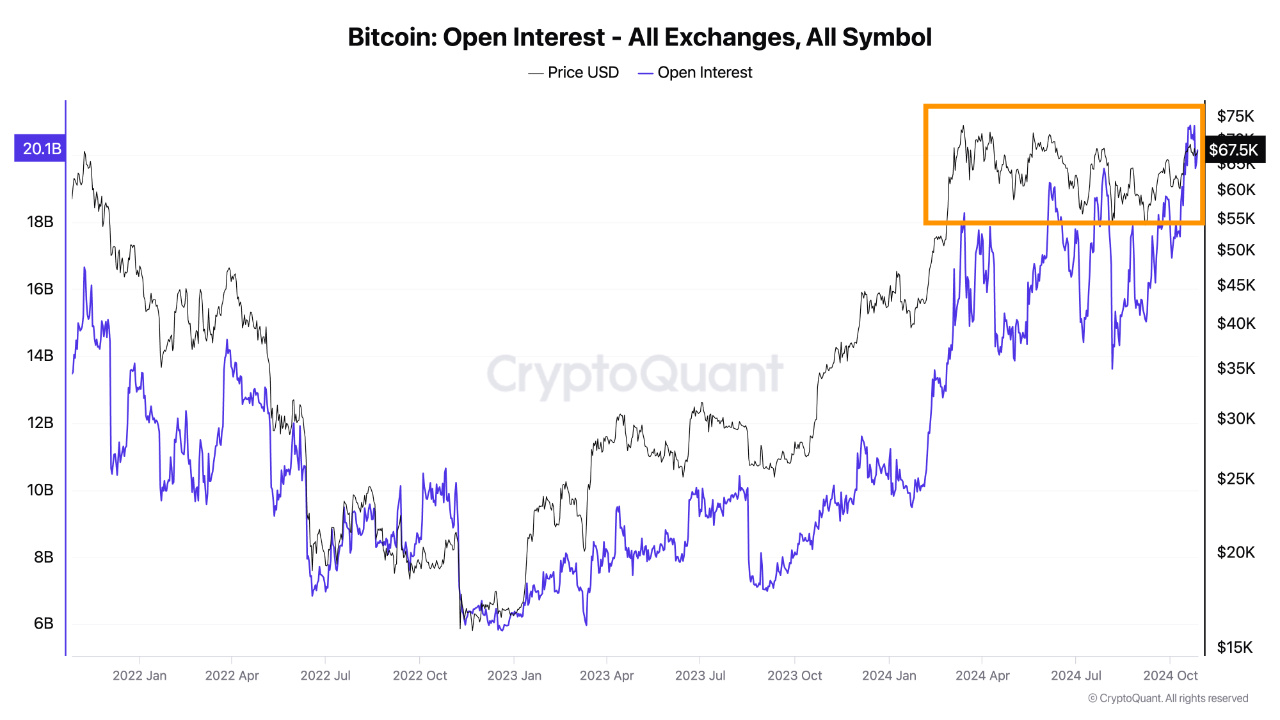
Open Interest: Establishing a cause-and-effect relationship between price and open interest is challenging. While we may think that price reacts to open interest levels, historical data shows that open interest doesn’t drive price as much as price drives open interest. Additionally, as the futures market and BTC adoption grow, higher open interest levels are expected in the coming years
Supply in Profit: This metric shows the overall profitability of the BTC network. It correlates with BTC's nominal price, so when BTC reaches an ATH, profitability often spikes to extreme levels (above 95%). If extreme profit levels triggered major sell-offs, reaching new highs would be challenging. Instead of focusing solely on profit levels, it’s helpful to consider how long extreme profitability can persist. As shown in the chart, profitability can remain at extreme levels for up to a year, which makes sense within the broader market cycle
Now, here are two charts that I find useful for assessing market conditions:
Funding Rate: This metric is useful for identifying when the market is overly bullish, which can signal that a top is near. I prefer monitoring the funding rate over open interest to navigate the market. The current level is nowhere near an extreme.
SOPR (Spent Output Profit Ratio): Profitability alone is not risky unless supply in profit starts moving. To reduce noise, I’ve used the 30-day moving average of SOPR in the chart. The current level also does not indicate an overheated market

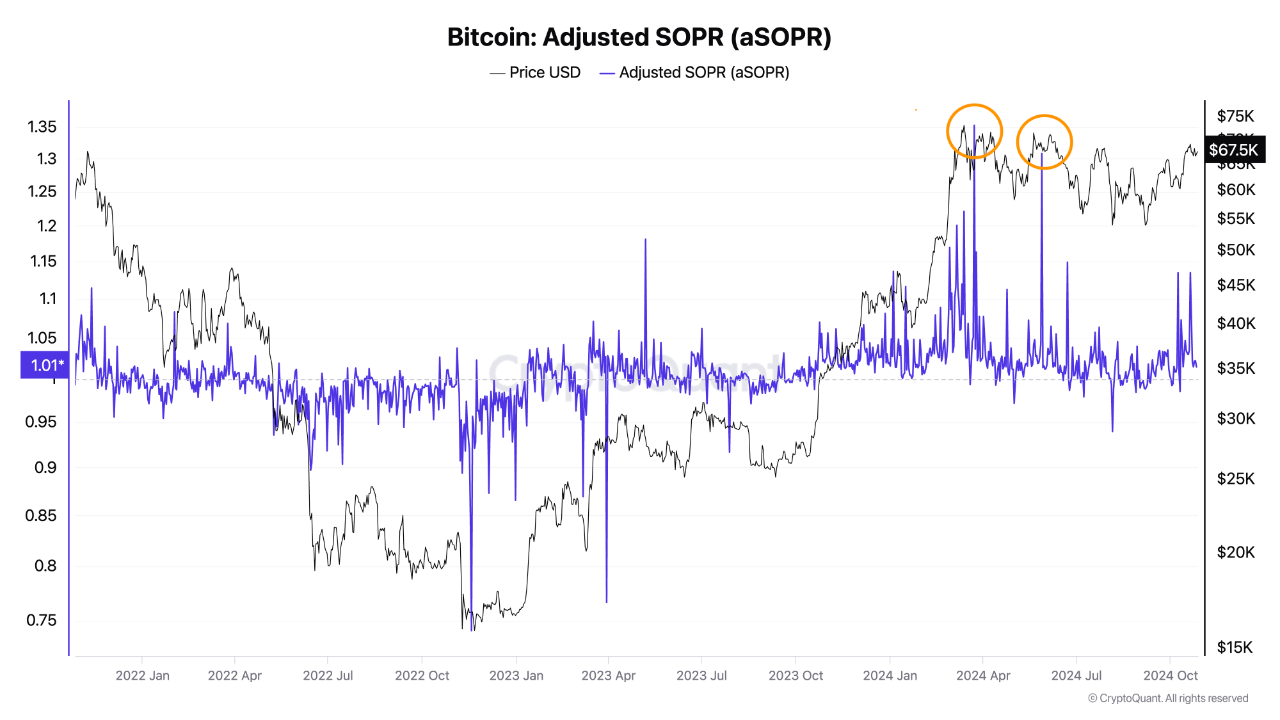
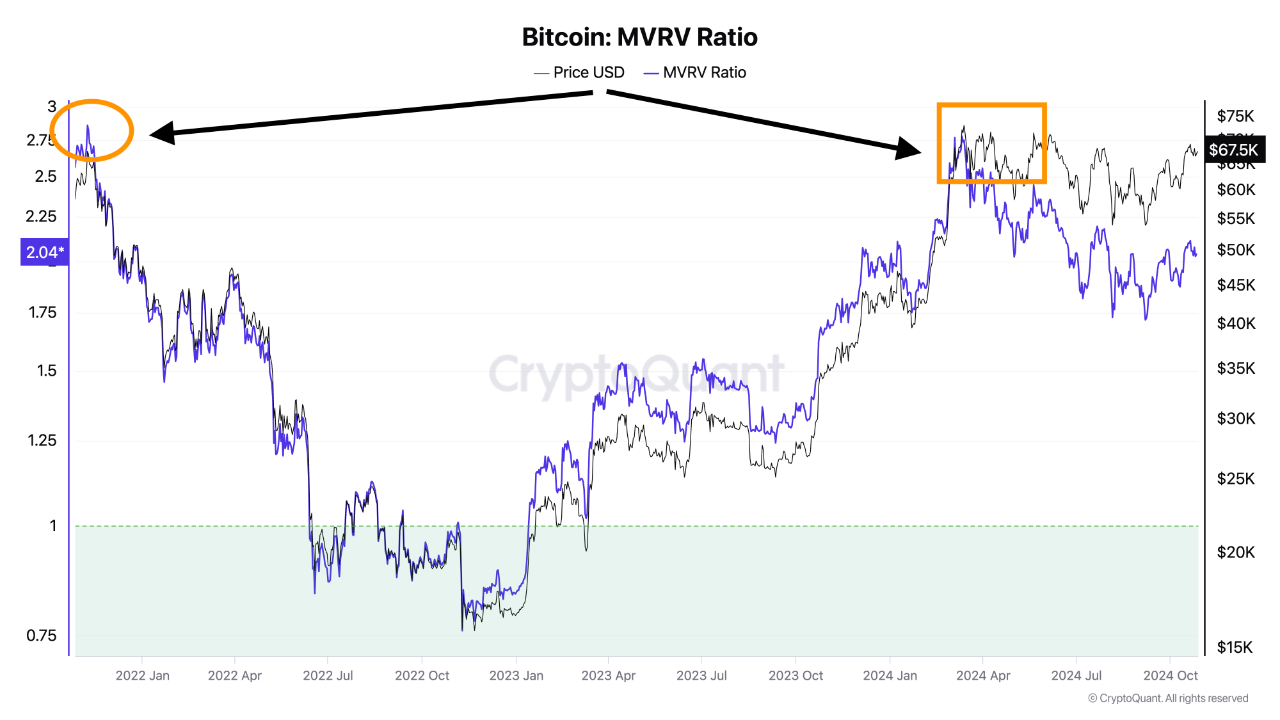
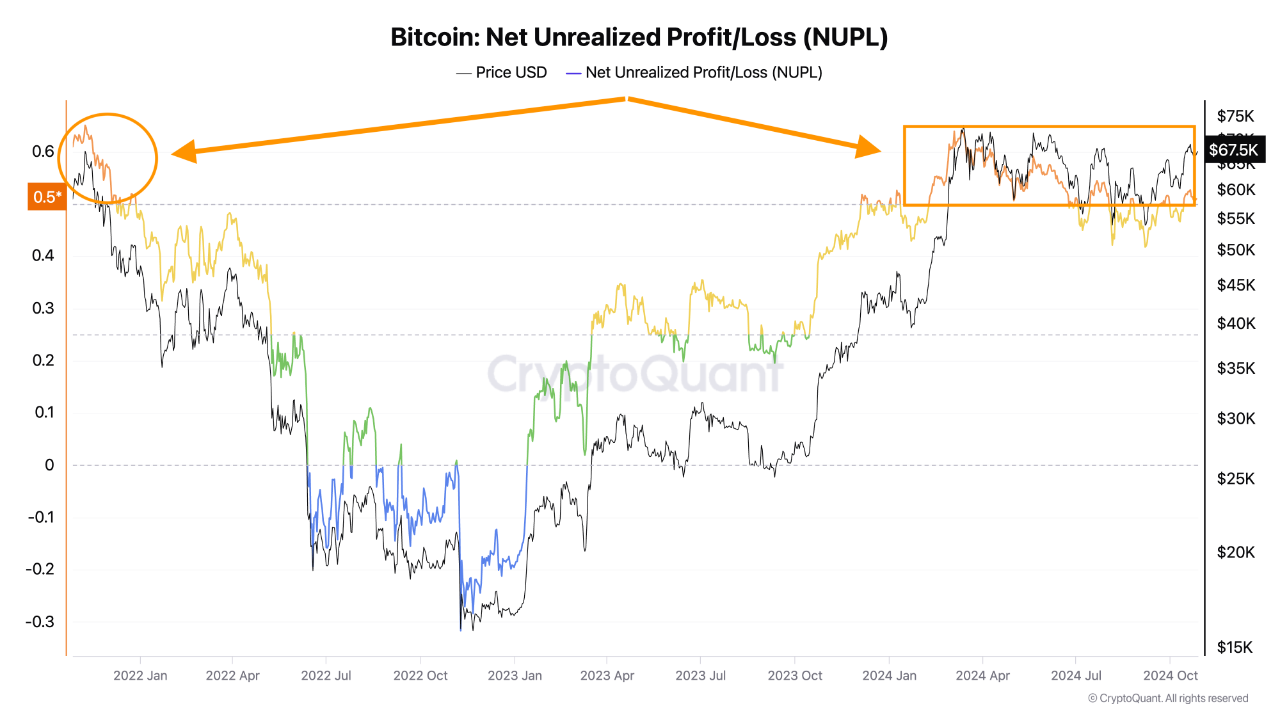
View original →It would be great to have a single peak at the end of the bull run that everyone agrees on. Looking at previous cycles, 2017 seems to have had the most ideal shape, with a definitive peak at the end. Perhaps it was the last one of its kind. The 2021 cycle was quite different from 2017, as it featured two peaks. Even more interestingly, most on-chain indicators didn't signal the BTC all-time high as the actual peak in November 2021, which is why some even call it a "fake rally."
We have to admit that every cycle has its own characteristics. In 2024, things got even more interesting, as we saw the all-time high (ATH) before the halving for the first time. Some believe we may have already seen the cycle peak in March, as certain metrics entered the overheated zone back then. While it's impossible to know if that was the true cycle top, from an on-chain perspective, we will likely see some metrics revisiting overheated zones repeatedly rather than hitting them just once. Especially after the 2021 bull run, investors remain hopeful about seeing new highs in 2025.

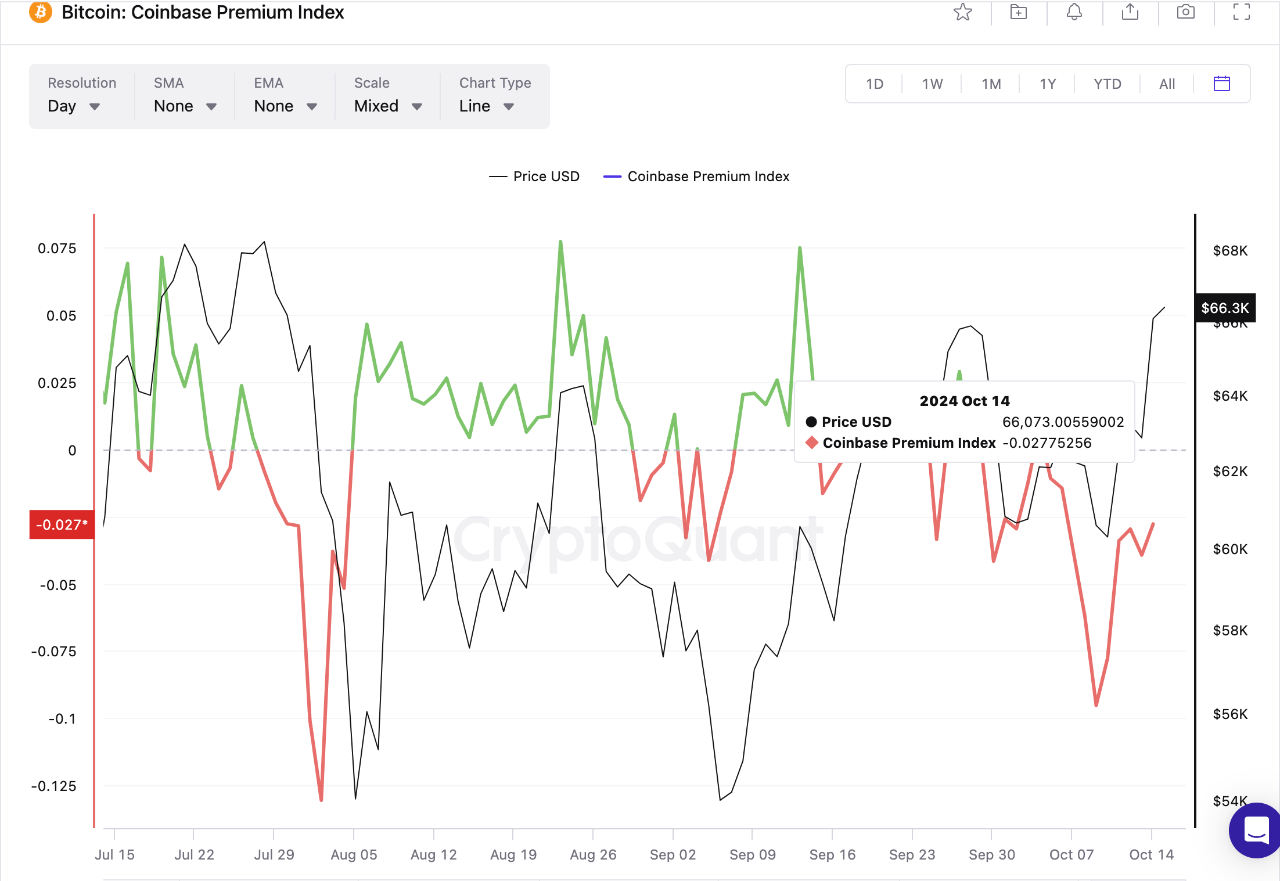
View original →The Coinbase Premium Index tracks the price difference between the Coinbase Pro price (USD pair) and the Binance price (USDT pair). Coinbase Pro typically represents whale and institutional movements, while Binance reflects more retail activity.
In many cases this year, we have seen the index turn positive when ETF inflows were high. However, it did not turn positive despite two consecutive days of high ETF inflows (October 11-13). The total net inflows were 253 and 556 million USD, respectively, on those days. This raises the question of whether investors on Binance, whether retailers, institutions, or whales, are surpassing the buying pressure on Coinbase Pro.
We definitely need more data to draw a conclusion, but it will be interesting to monitor this chart in relation to ETF trends. If ETF inflows remain positive and the index stays red, it may suggest that retailers are gaining strength.

View original →Bearish(Nuanced)BTC
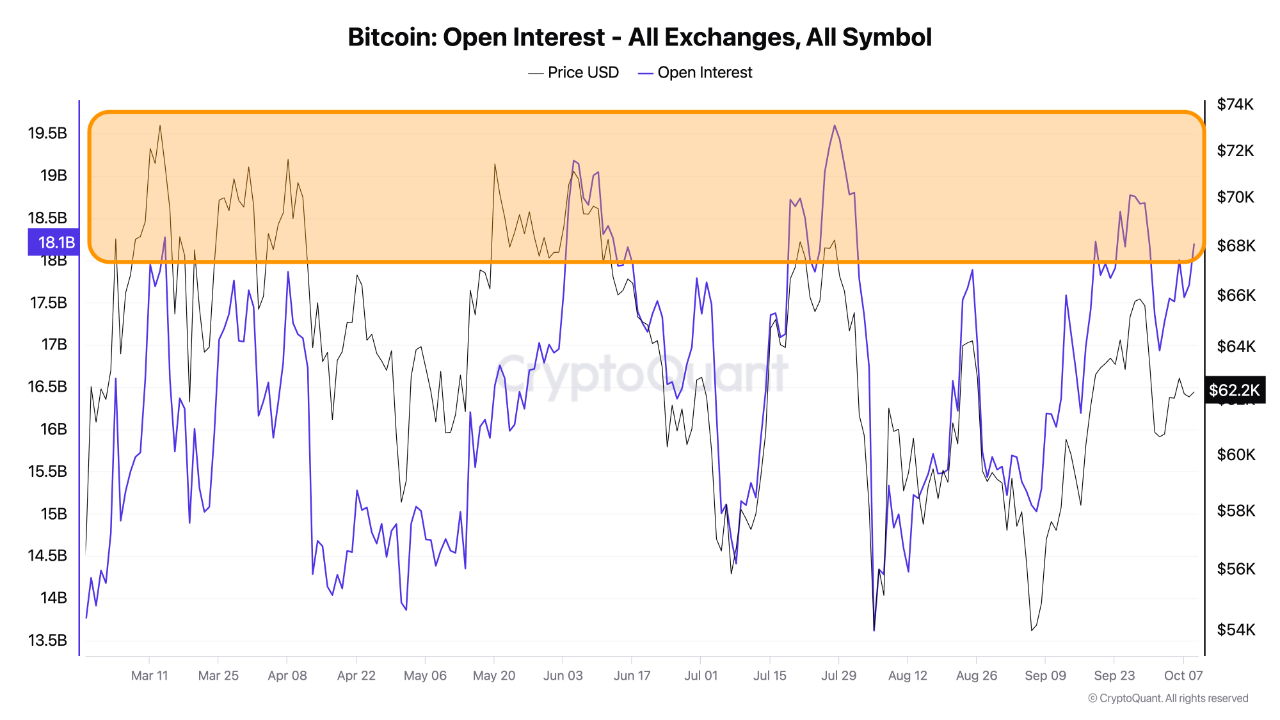
10/9/2024 We are once again in a high open interest zone, as it has exceeded the critical USD 18B level. In the past, we have seen major corrections each time this occurred. The market seems indecisive in many aspects, with some believing that the next big upside move is on the horizon, while others think BTC's downward trend remains strong. A common belief is that BTC may need a final shakeout before surging to a new all-time high (ATH).
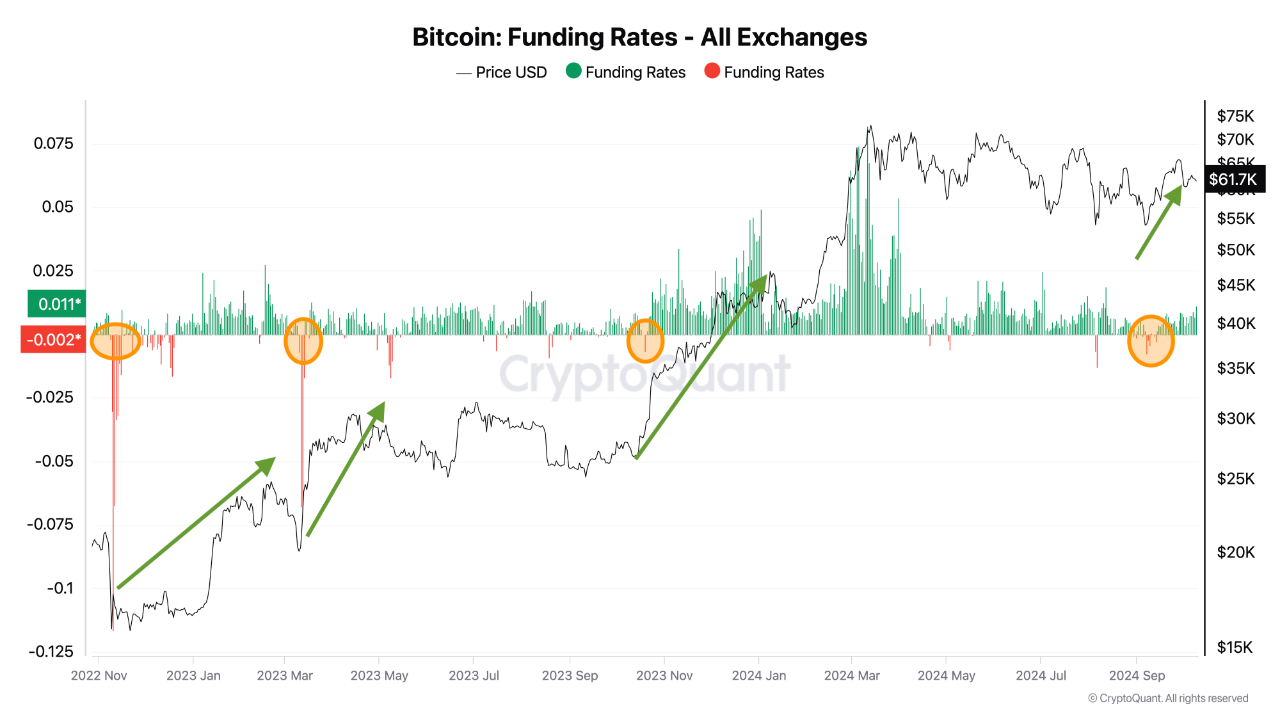
On the other hand, funding rates are not particularly high. They are slightly above their 200-day SMA, with long traders being dominant, which is unsurprising. Historically, funding rates have turned negative with major corrections, often before significant price increases.
In conclusion, it wouldn’t be surprising to see some long liquidations that lower the open interest and prepare the market for its next move. Given that funding rates aren’t excessively high, even if a price correction occurs, it may not be very deep.

View original →

