Bullish(Nuanced)BTC
5/23/2025 While Bitcoin recently set a new All-Time High (ATH) in price, its MVRV ratio hasn't hit the peaks seen in past cycles (2013, 2017, 2021). Previously, MVRV also peaked with prices, often exceeding 3.5-4, signifying high unrealized profit. This current disparity, where a price ATH doesn't coincide with an MVRV peak, can be explained by the tremendous rise in Bitcoin’s Realized Cap.
The MVRV ratio is Market Cap divided by Realized Cap. A significantly higher Realized Cap (the denominator) naturally lowers the MVRV ratio, even if Market Cap (the numerator) is at an ATH. This increased Realized Cap means more coins have moved and their cost basis reset at higher prices in this upcycle. In other words, the network's aggregate cost basis is now considerably higher than during previous ATHs. This suggests the current market situation is different: perhaps more coins are in stronger hands at these higher valuations, or the "froth" or overvaluation typical of past MVRV peaks hasn't occurred to the same degree. It might also indicate that significant profit-taking has been absorbed by new capital at these elevated prices, pushing the network's Realized Cap higher.


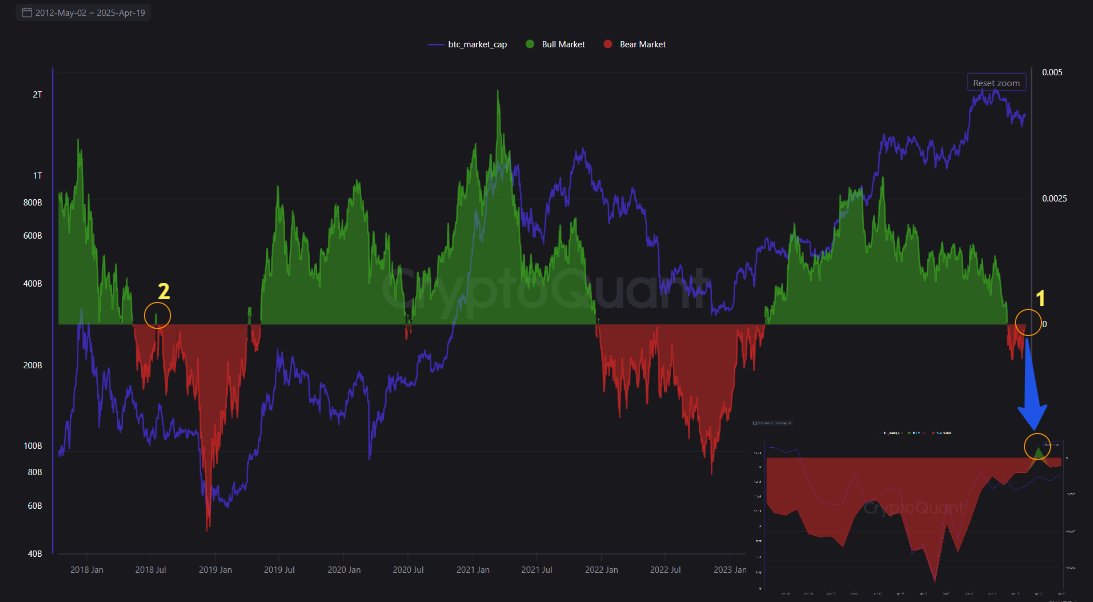
View original →The on-chain chart above hints that Bitcoin may be repeating a familiar pattern. Two key points are highlighted — Point 1 (2025) and Point 2 (2018) — both marking the end of a bear market phase and a potential shift toward bullish momentum.
In 2018, after months in the red zone, the market broke through and entered a bullish period. Now, in 2025, we see a similar move as Bitcoin exits the bear territory and approaches a key threshold again.
The lower indicator also mirrors the 2018 recovery, suggesting renewed positive sentiment. If this pattern holds, we could be on the verge of another bull run.
Although external factors can always shift the outcome, the historical similarities are striking. Bitcoin may once again be at a turning point, and the question remains: Is history repeating itself?

View original →Bearish(Nuanced)BTC
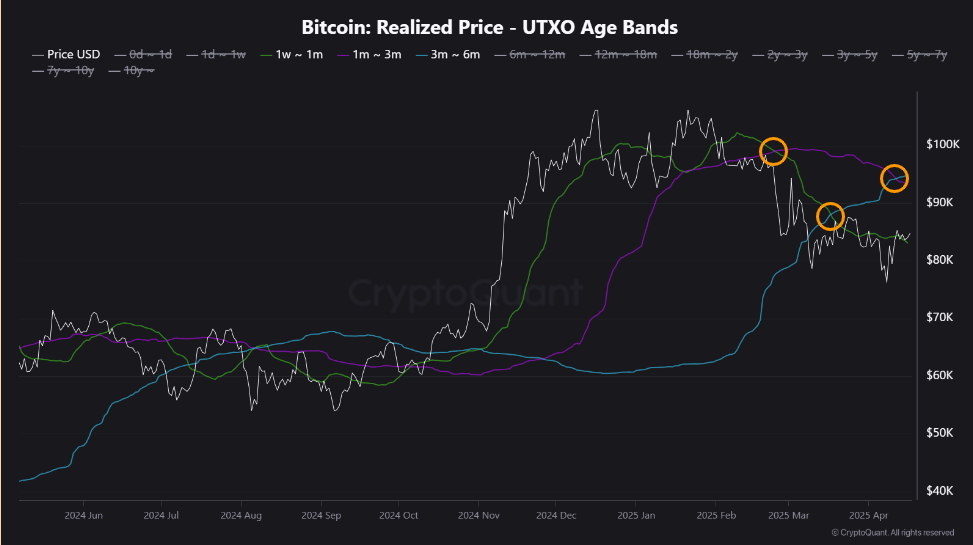
4/17/2025 In the chart above, we can observe a notable crossover in the UTXO Realized Price bands. Specifically, the short-term cohorts — 1 week to 1 month (green line) and 1 month to 3 months (purple line) — have begun to cross below the mid-term cohort of 3 months to 6 months (blue line).
This behavior may indicate a shift in market sentiment, suggesting that short-term holders are realizing losses or that the cost basis of newer market participants is now below that of mid-term holders. Historically, such crossovers have been associated with bearish phases or corrections in the market. It is essential to monitor whether this trend continues, as it could potentially signal a cooling-off period or a broader consolidation phase for Bitcoin.

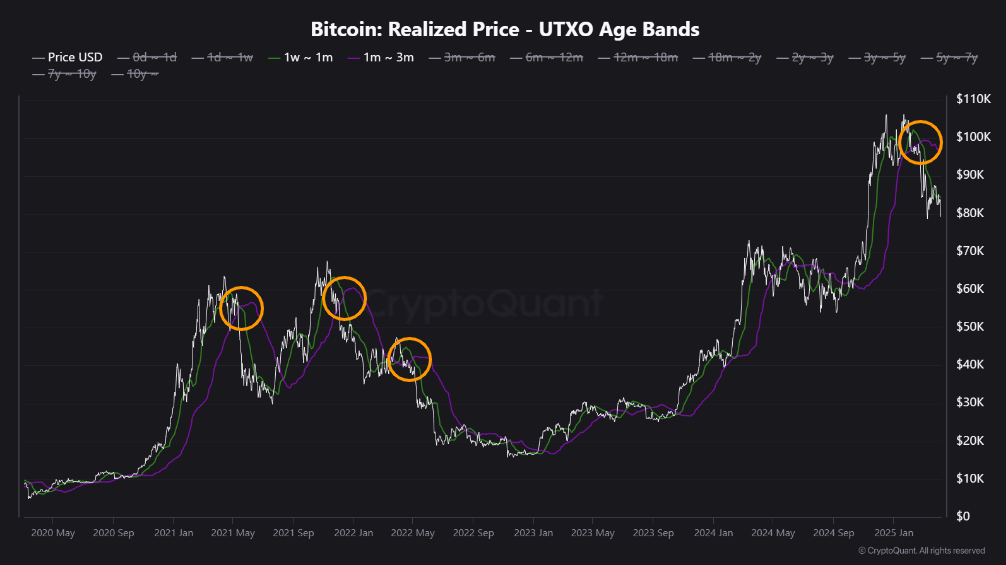
View original →The chart titled "Bitcoin: Realized Price - UTXO Age Bands" shows Bitcoin's price about the realized price of coins held by short-term holders, specifically those who acquired their BTC between 1 week to 1 month (green line) and 1 month to 3 months (purple line) ago. Historically, an upward trend in these age bands often marks the beginning of a bull market. For example, in late 2020, early 2024, and again in late 2024, we can see that these realized prices started to rise before significant price increases, signaling early accumulation phases.
At market tops such as April 2021, November 2021, and March 2025, the 1m–3m realized price tends to flatten or turn downward, indicating that short-term holders are starting to take profits and distribute coins. During bear markets, like in 2022, these age bands typically trend downward and often form a support base during price bottoms, as seen in late 2022 and mid-2023.
As of early 2025, the price has begun to correct after Bitcoin peaked above $100K. The 1m–3m cohort's realized price is now curving downward, suggesting that recent buyers may be entering loss territory. If this trend continues, it could point to further market cooling or an extended consolidation period.

View original →Bearish(Nuanced)BTC
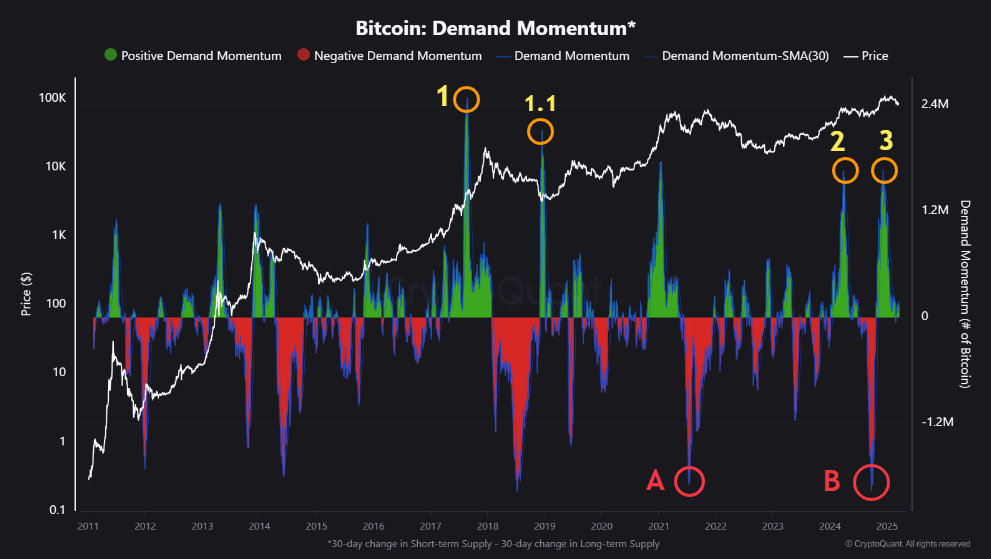
3/17/2025 In 2024, Bitcoin was in demand in March (2) and December (3). That is the first time we have observed two peaks in Demand Momentum close like this. After the March momentum peak, we see a serious decrease (B).
In general, after sequencing peaks on momentum, we see price and demand fluctuation and then gradually decrease like being at between 2017 August (1) and 2018 December (1.1).
But sure we need to pay attention to Market Size, Volume, Liquidity, Interest, etc. changed significantly. But still, the final view is aiming for a downtrend on demand.

View original →Open Interest for 7 days change is under deleveraging area. What does that mean?
When the OI ratio's change for 7 days down to the section, that means we can define the time to buy. Since August 2024, we have been observing one of the deepest areas in the Crypto Market.
To remember, at this time (2024 Aug), Bitcoin's price was around 58 - 60k. After that, the price goes up to ~106k

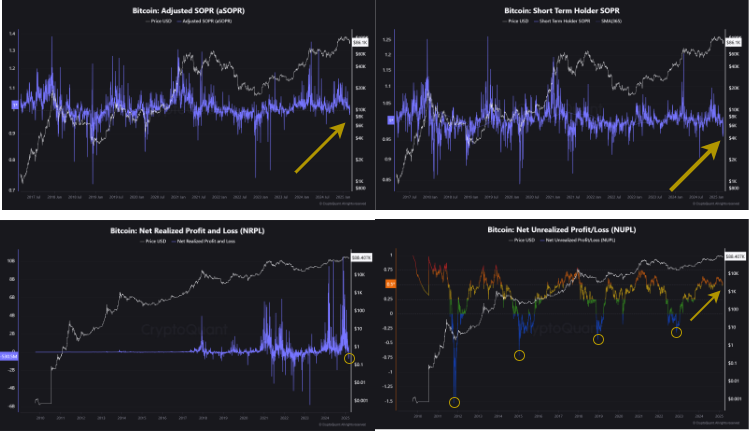
View original →Since the end of December 2024, we have been observing a downtrend in Bitcoin. Because of that, Short-Term Bitcoin Holders can't resist anymore
Here is the result: aSOPR, SOPR, NRPL, NUPL
aSOPR - Adjusted Profit Ratio of Bitcoin Short Term Holders indicates under 1. Actually, the Indicator is fluctuating around 1. We need to see the ratio over 1 level.
SOPR - The Indicator is more decisive about staying under level 1. Historically, when aSOPR down under 0.8 and SOPR is under 0.9, that can be buy signal.
NRPL - Net Realized Profit and Loss indicator had been affected by the current state. Realized PnL is over 700 million. That is the next dip since August 2024.
NUPL - From the other side, unrealized PnLs for Bitcoin holders are still positive, although the ratio is decreasing by affecting the latest down. NUPL is in the s. 0.5 Level support level. 0.5 is the firm level since 2012 and is still working.
In conclusion, Bitcoin is at a critical level. All 4 metrics show us that there may be a potential dip.

View original →Bearish(Nuanced)BTC
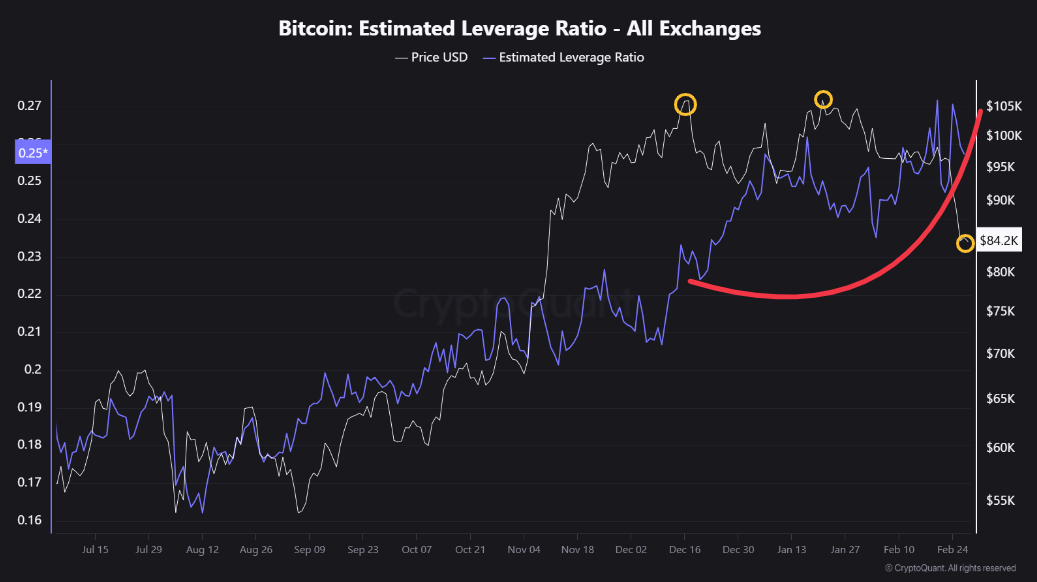
2/28/2025 Since December 2024, Bitcoin did its All-time-high (ATL) price, and now it is on the downtrend. But that is not a roadblock for traders.
As we can observe from the Estimated Leverage Ratio, traders is increasing the leverage. According to Net Realized Profit and Loss (NRPL), their loss is over 550 million dollars. That shows us that traders are tempted by huge losses and want to compensate their casualties.
The event is making them more aggressive and because of that we can see uptrend on the Leverage Ratio since December of 2024

View original →Bullish(Nuanced)BTC
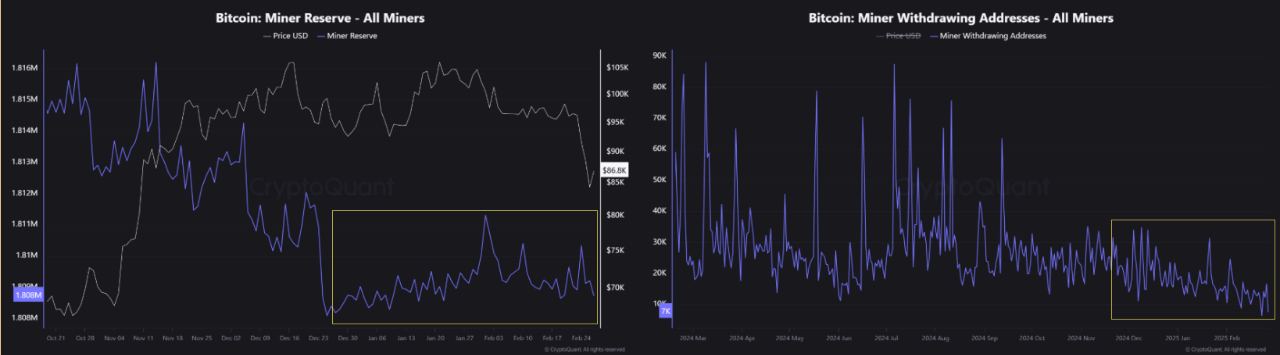
2/27/2025 Since December of 2024, All Bitcoin Miners have started accelerating their mined Bitcoins. The Miner Reserve is not changing nominally from December 2024. As soon as the Bitcoin price increased, miners were sold significantly. That was obvious!
But since last December, after Bitcoin did ATL according to Bitcoin Miner Withdrawing Addresses, we can see the withdrawal transactions have been stopped and even decreased.
Besides that, Miner Reserves are not affected significantly. It seems they are gathering their Bitcoin. In general, that is happening in the downtrends of the crypto market.

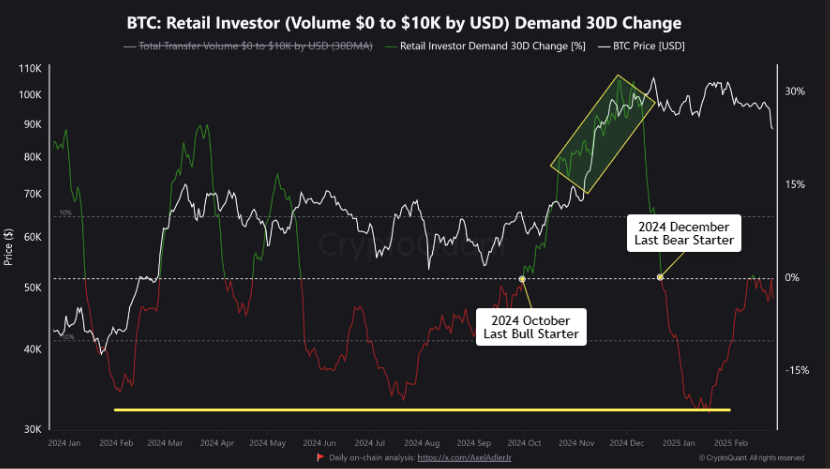
View original →One of the best indicators for assessing the state of Crypto assets is Retail Investor Demand (RID). Investors' demand and interest allow us to make reasonable price predictions.
As I drew in the chart, we can observe resistance to retail investor demand. In the near past - 14 February 2025 the metric tried to go over 0% (neutral zone), but it was unsuccessful. After the unsuccessful try, Bitcoin went down to 88k levels.
Right now, the Demand is accelerating again despite the resistance at 0%. We recently saw the last dip, which happened in June 2021. Then quick reback was seen from this dip. That is good news. Now, we need to see in the chart the metric at over 0%.
So, how can we use the Retail Investor Demand (RID) Metric in our long-term analyses?
The RID has 3 main levels:
a) -15% (negative)
b) 0% (neutral)
c) 15% (positive)
At near -15%, you can start to look for dips; 0% is a neutral zone, which is the sign for hopefully price movements, and then if the price goes up over the neutral zone, that means price is on the its premium area.
For example, take a look at 2024 October; we are seeing significant skyrocketing over 0%, then Bitcoin reached its ATH, and look again at 2024 December; RID went down 0%, and we are at a relative bear market.

View original →

