Bearish(Nuanced)BTC
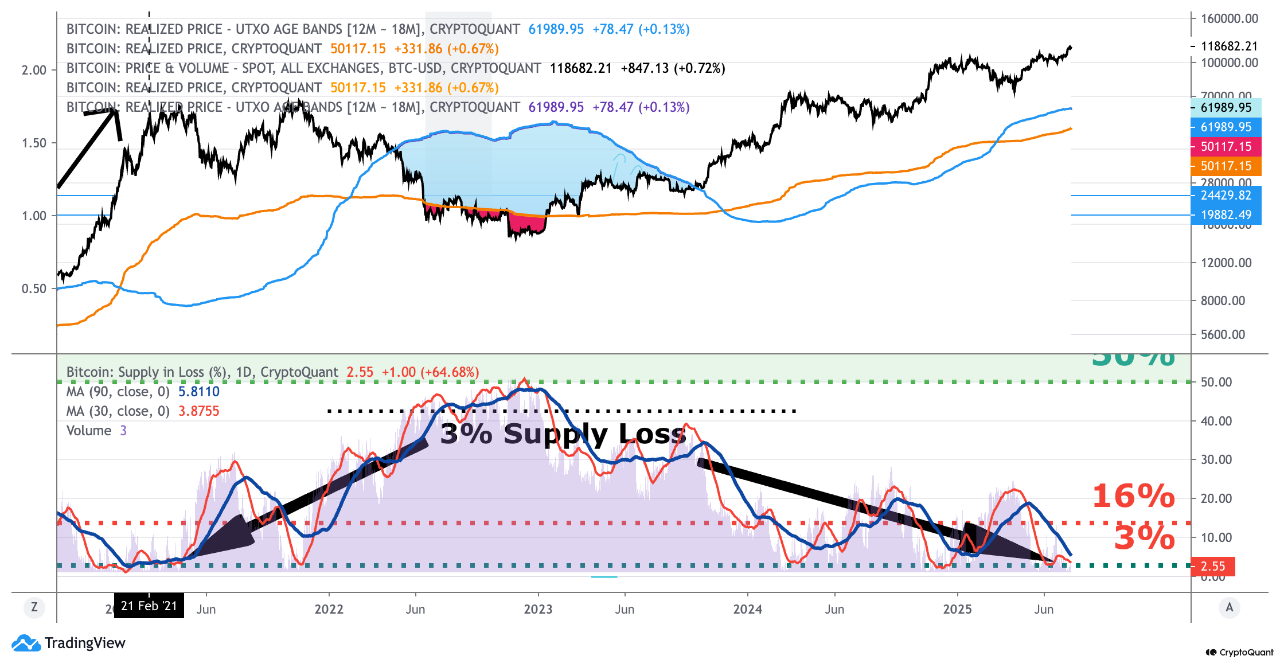
7/17/2025 2021 Cycle Top Signature
Current Supply in Loss: 5.48%
Buffer to danger zone: 2.48% above the critical 3% threshold
Risk trajectory: Lower numbers = higher risk
Next few months critical
At 5.48% Supply in Loss, we have runway but need to watch the decline toward 3%. History shows this metric provided perfect timing for the 2021 exit. The next few months are critical not for immediate panic, but for disciplined dca out strategy.
Risk Level: Moderate (prepare, don't panic)
Key Metric: Watch 5.48% → 3% decline
Action Plan: Progressive exits as threshold approaches

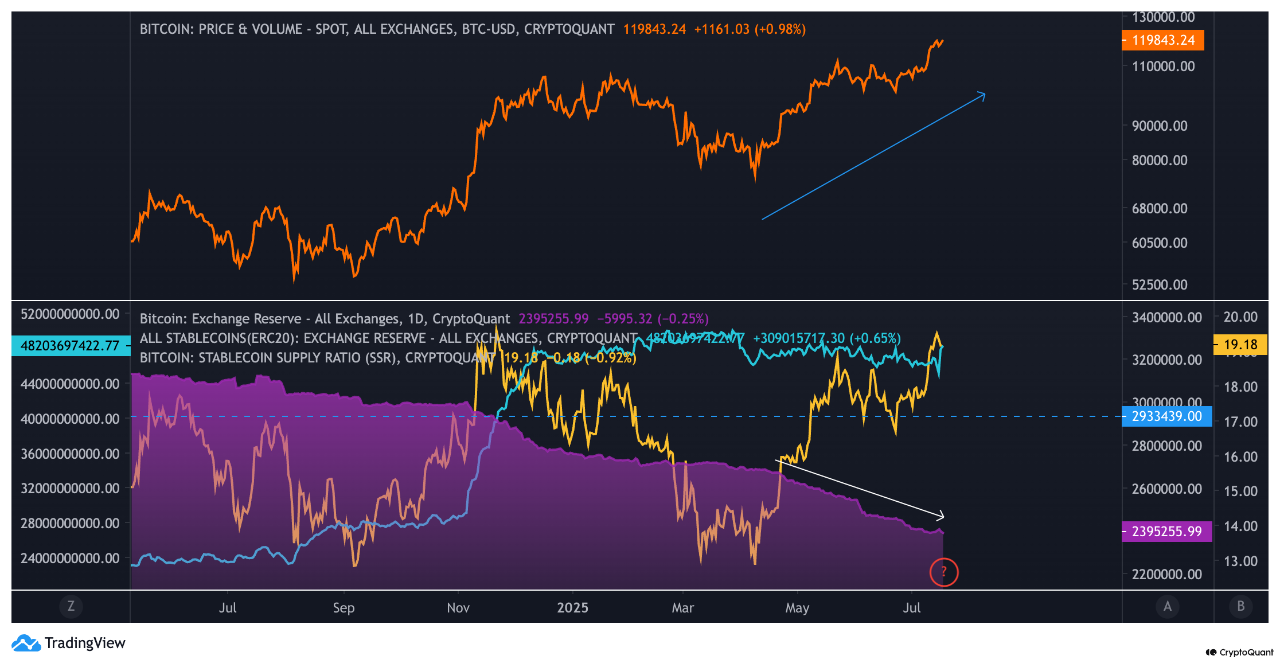
View original →Exchange Reserve: 2.39M BTC (near historic lows of 2.5M threshold)
Exchange Netflow: -7.85K BTC (negative = outflow from exchanges)
Trend: Continuous supply drainage from exchanges
We're witnessing a historic supply squeeze with exchange reserves at critically low levels. When combined with negative netflows, this creates a powder keg for explosive upward price movement. Probably what leads to the explosive top of this rally.

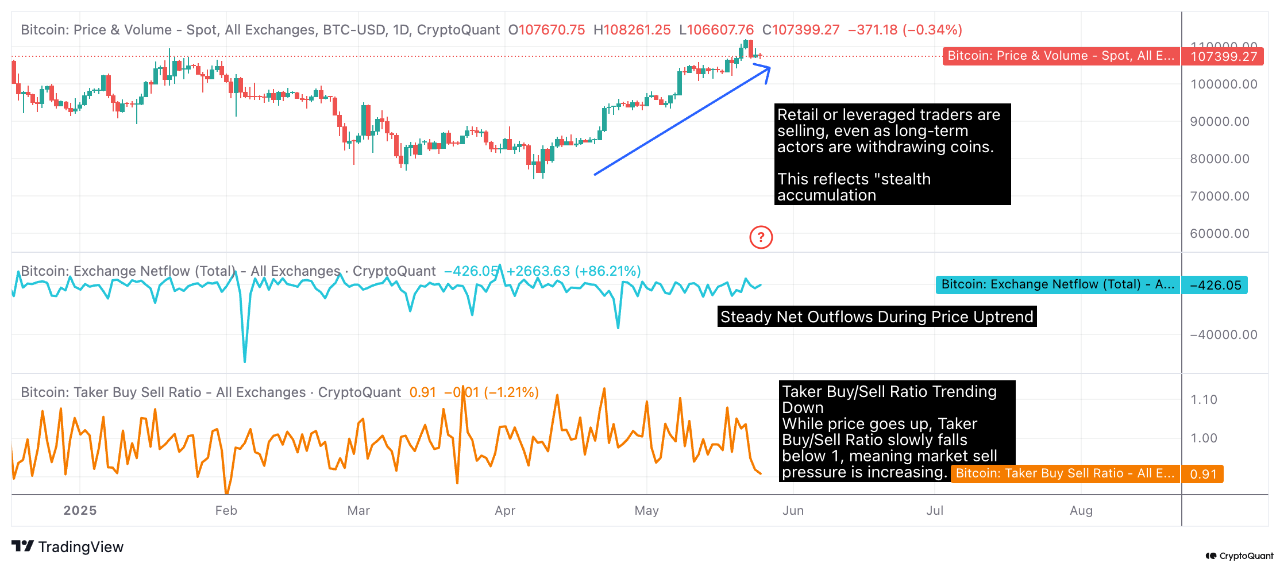
View original →While $BTC grinds higher, exchange netflows remain negative — coins consistently leaving exchanges.
Yet the Taker Buy/Sell Ratio is back under 1.0 — showing more aggressive sellers than buyers in recent days.
📊 This divergence is telling:
Retail is de-risking.
Whales are quietly accumulating.
No panic spikes in inflows → no major distribution yet.
If sell pressure keeps rising but price holds, expect a short squeeze setup.
This is the kind of stealth accumulation that fueled past expansions.
Onchain Edge Bias: Accumulation under pressure bullish continuation likely.

View original →Bullish(Nuanced)BTC
2/19/2025
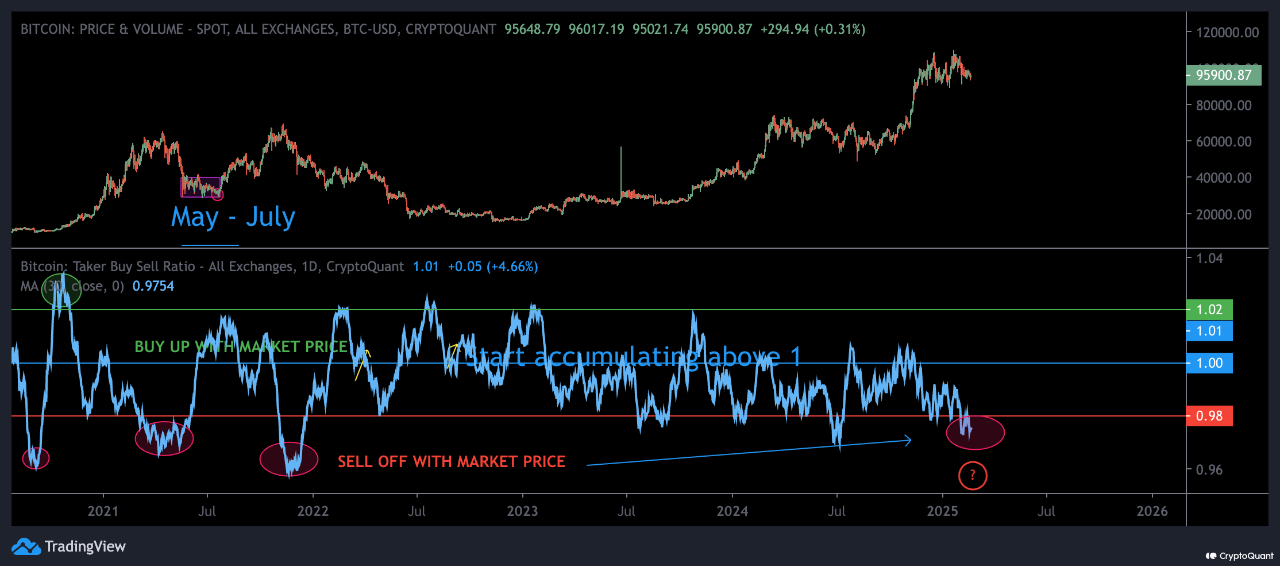
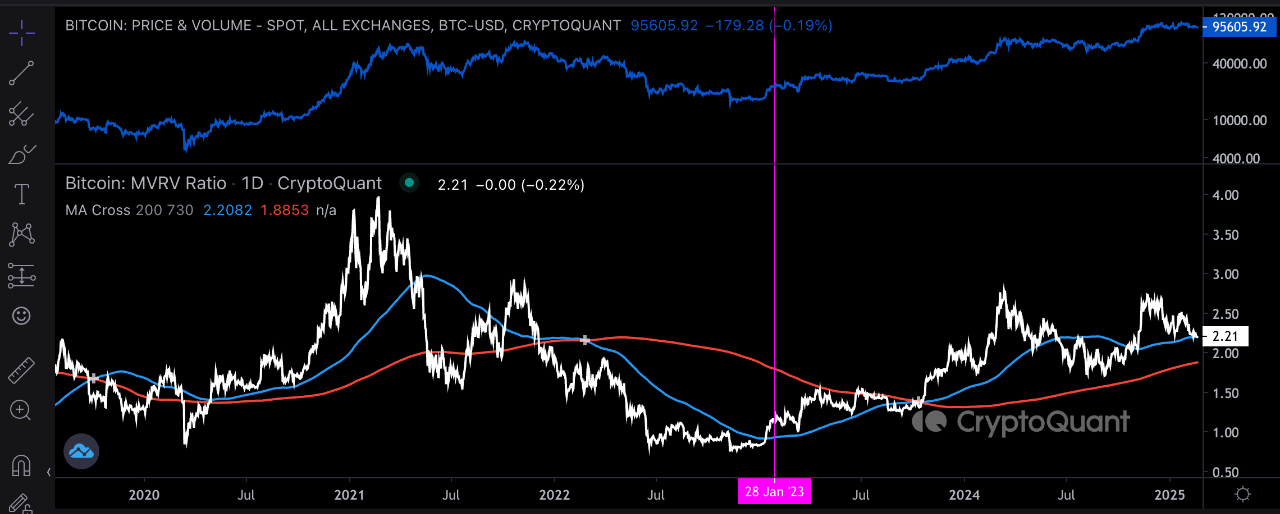
Right now, Bitcoin is in a critical decision zone. Looking at two key indicators—Taker Buy/Sell Ratio and MVRV Ratio—we can see mixed signals, but overall, the data leans more bullish than bearish.
🟢 Bullish Case (More Likely Based on Other Indicators)
The MVRV Ratio (2.21) suggests Bitcoin is not overvalued yet. Historically, bull markets have peaked when MVRV is between 3.5 and 4.0, meaning there’s still room for growth.
Puell Multiple and other on-chain indicators aren't showing overbought conditions, which means we’re not at a cycle top.
If buyers step in, BTC could continue its uptrend toward six figures before a major correction happens.
🔴 Bearish Case (Risk Factors to Watch)
The Taker Buy/Sell Ratio (0.96) shows that more traders are selling into market demand—a level similar to the March & November 2021 tops, which led to corrections.
If BTC fails to break higher and the ratio stays below 0.98, it could signal a short-term top, leading to a pullback before the next leg up.
Final Take:
While some selling pressure is visible, macro indicators (MVRV, Puell) suggest the bull run isn’t over. If BTC can hold above $95K and buying activity picks up, we could see another rally toward new highs. However, if selling pressure increases and BTC struggles to break resistance, expect a healthy correction before another run-up.

View original →Bullish(Nuanced)BTC
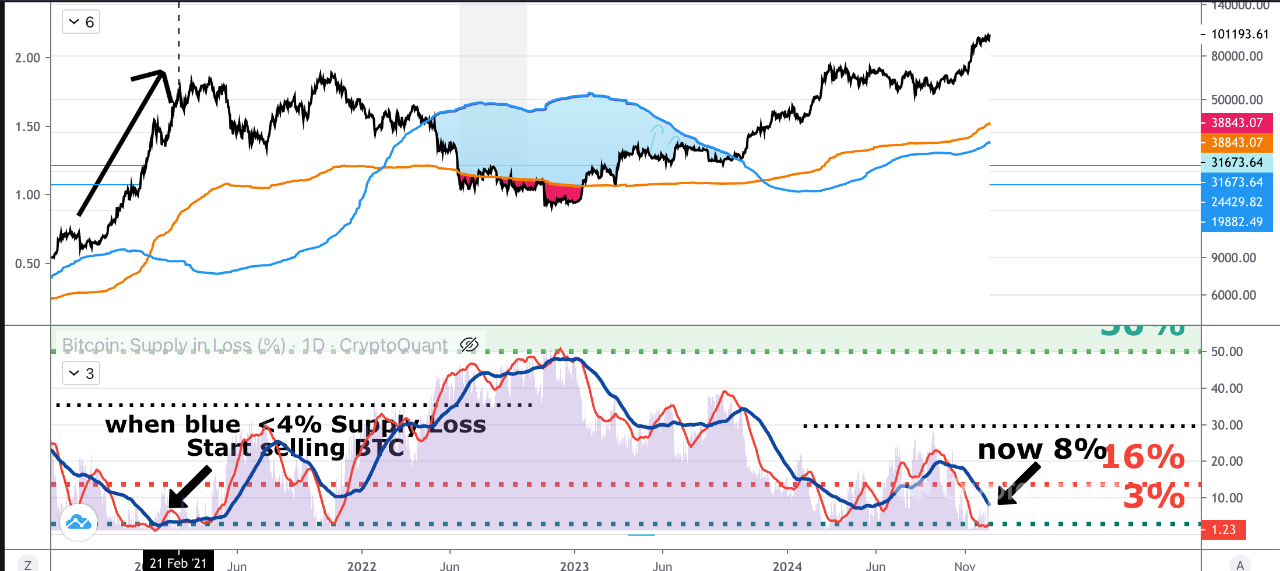
12/12/2024 When the BTC supply loss % goes below 4% you should start dcaing aggressively out of BTC and wait for the next bear market lows.
Current value is 8.14%
Why? Below 4% means a lot of people are in a profit this is the peak bullrun phase. Trust me you don't want to be bagholding because you thought we will never see a bear market again.
Be fearful when others are greedy.

View original →Bullish(Nuanced)BTC
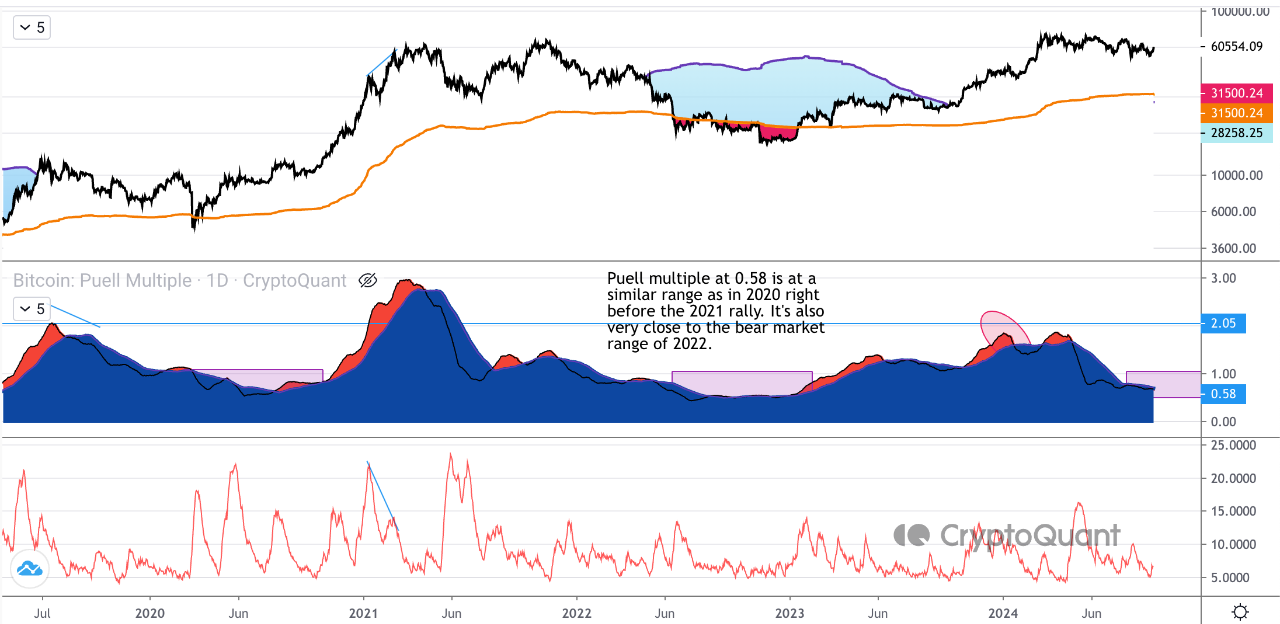
9/14/2024 Puell multiple at 0.58 is at a similar range as in 2020 right before the 2021 rally. It's also very close to the bear market range of 2022.

View original →Bullish(Nuanced)BTC
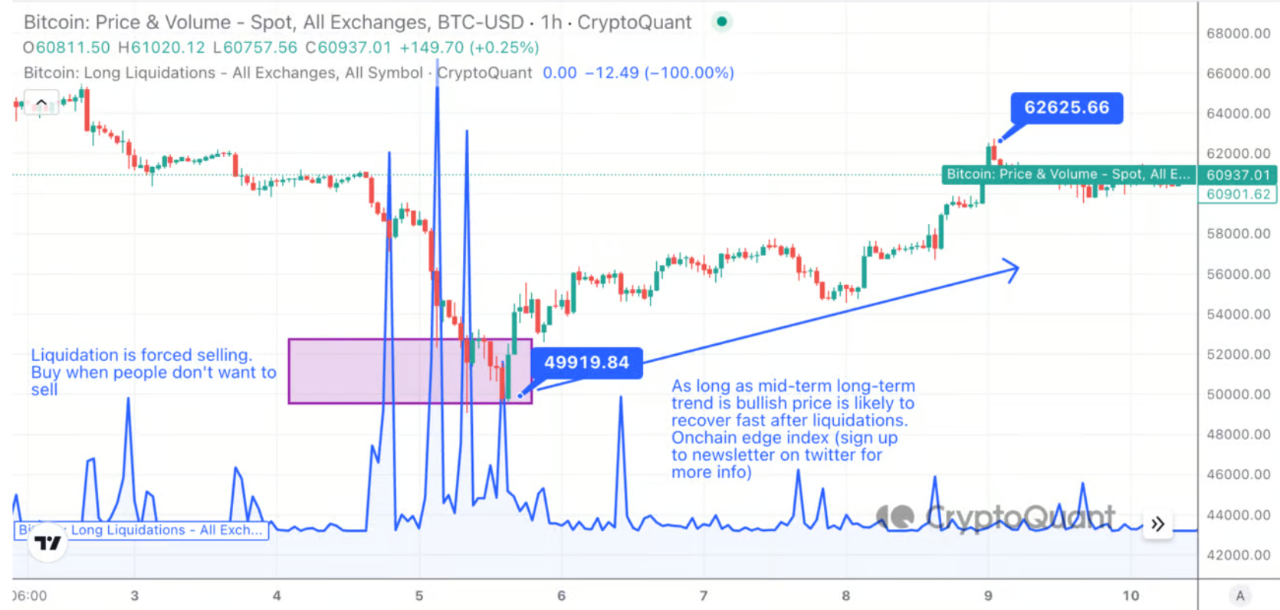
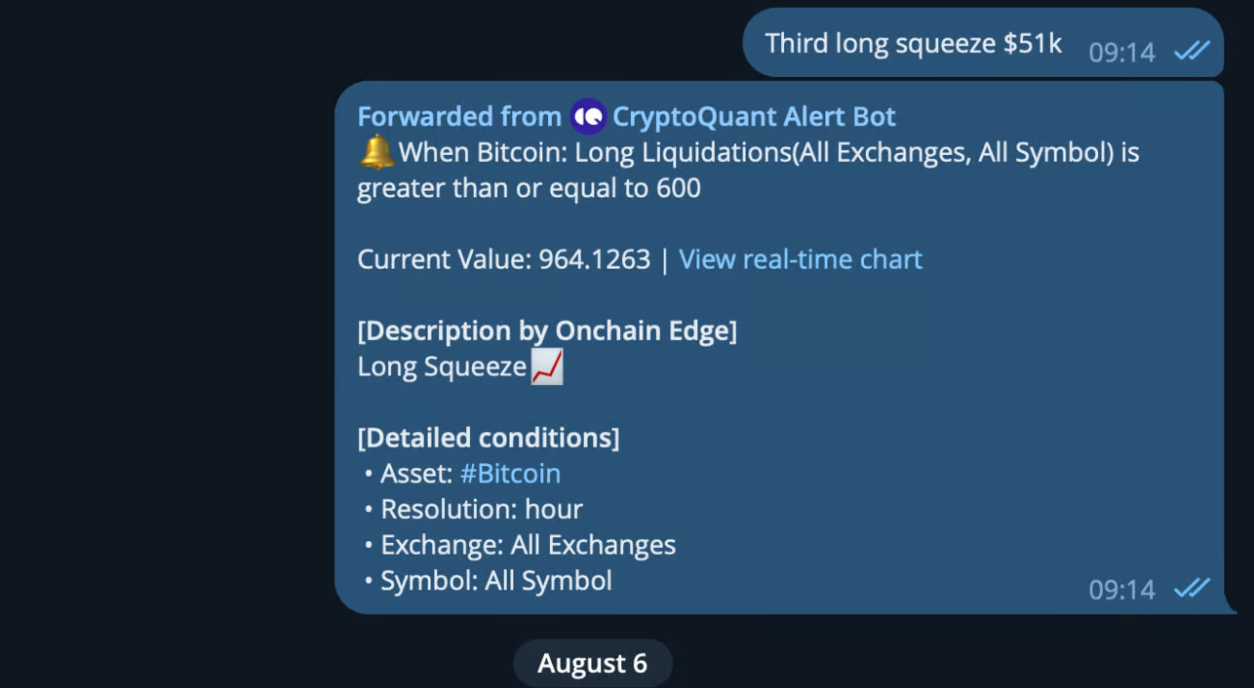
8/10/2024 The trick is to buy during and after a few long liquidation alerts triggered.
The alert looks like what you see in the screenshot. If there are more than 600 BTC long or short positions that get liquidated in an hour then the alert gets triggered.
As long as the overall trend is bullish it’ advantageous to buy after long liquidations.
It's often better to wait for a few liquidations to happen and then look at other indicators for confirmation.

View original →Bitcoin's NVT Golden Cross at -2.24: What It Means for Investors
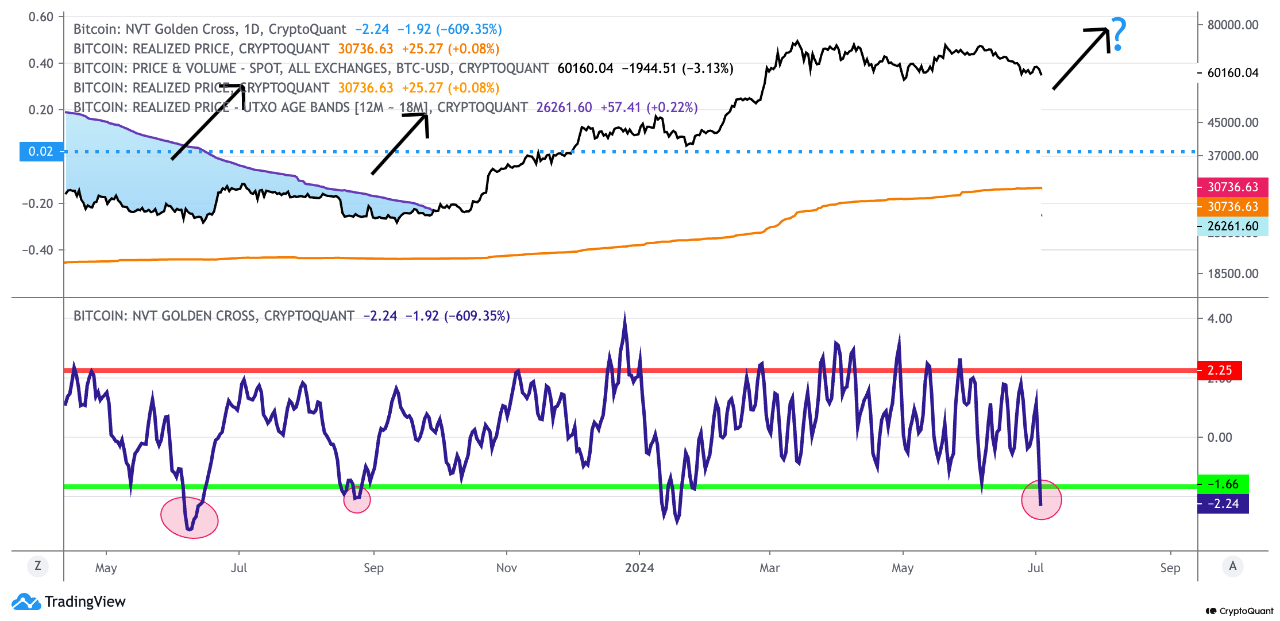
The NVT golden cross number for Bitcoin is now at -2.24. When this number goes below 2, it usually means good news for Bitcoin's price. This has happened 6 out of 7 times before, and it often shows that Bitcoin's price might experience a rally in the next 2-3 months.
But, there was one time it didn't work out. On April 29, 2021, even though the NVT golden cross was lower than 2, Bitcoin's price actually fell from $55,000 to $33,000.
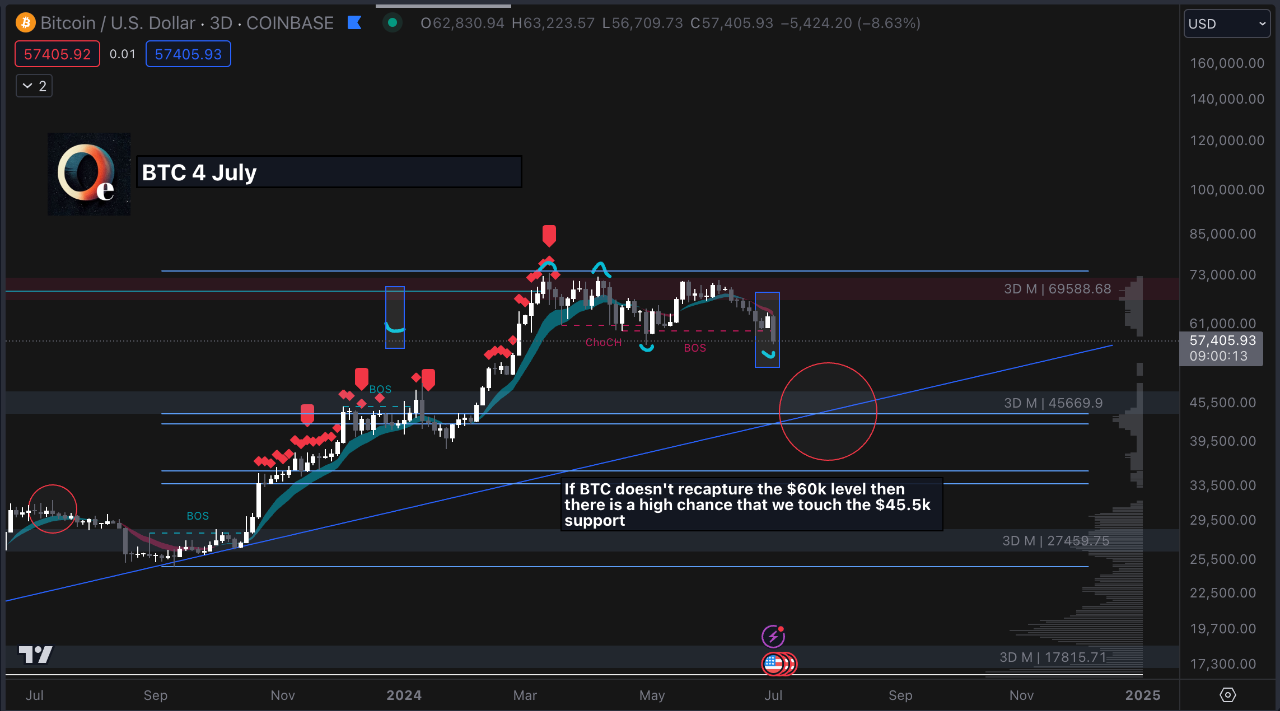
A wick to $45k is possible and i would be buying quite a bit if that happens. Let's see if we manage to hold $51k.

View original →Bitcoin looks like it’s in a reaccumulation phase:
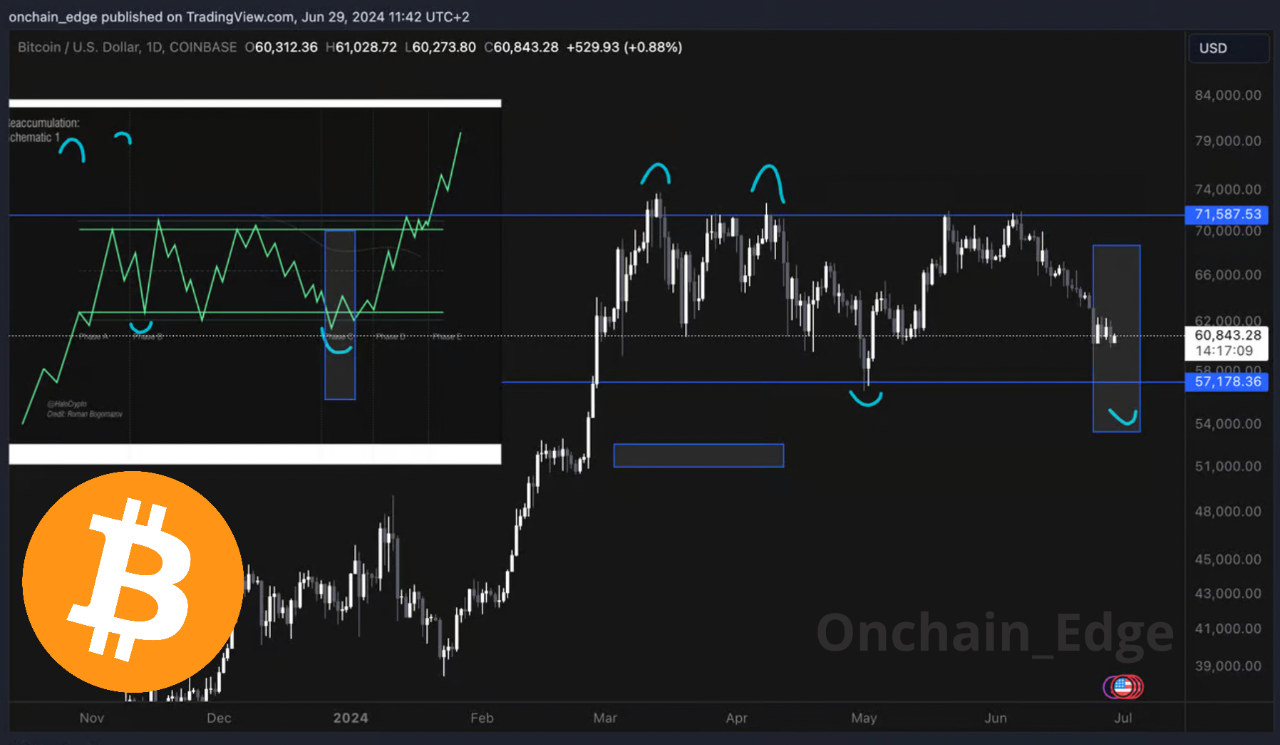
Bitcoin chart with a reaccumulation wyckoff pattern
The current Bitcoin price chart matches the Wyckoff reaccumulation phase, with a consolidation range evident from recent price movements.
Key features include price bouncing between horizontal support (around 57,178) and resistance (around 71,587), indicating sideways movement typical of reaccumulation.
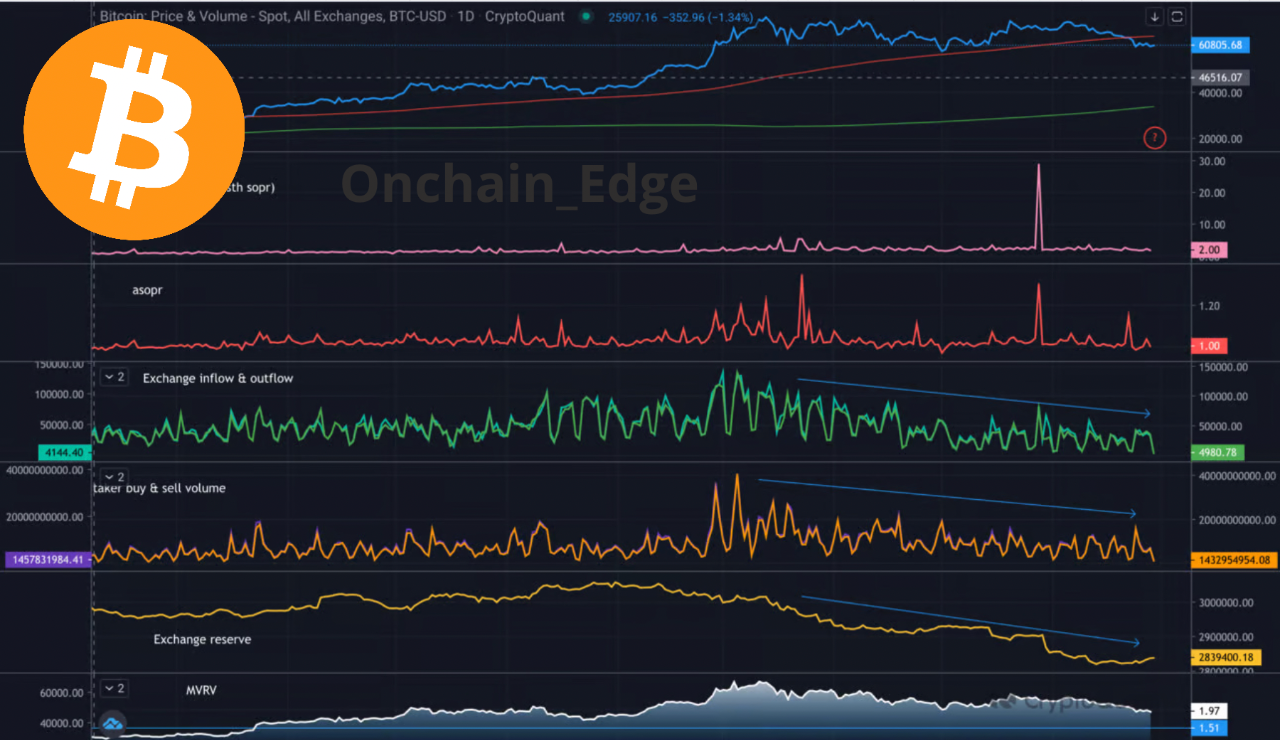
MVRV Ratio: Is 1.97, indicating the market is still above the realized price and hence in a relatively overvalued state.
Market participants have significant unrealized profits, typical of a distribution or early markdown phase. In my opinion, this alright for the reaccumulation phase. For the accumulation phase, we would want much lower mvrv values.
Exchange Inflow & Outflow: The current trend show decreasing inflow and outflow volumes.
Decreasing exchange reserves suggests accumulation as BTC moves off exchanges. This is consistent with the reaccumulation phase.
aSOPR: Hovering around 1.0. which means the market is balanced between profits taken and losses incurred, consistent with a reaccumulation phase where neither buyers nor sellers dominate.
SOPR Ratio (LTH-SOPR/STH-SOPR): Relatively low values, suggesting reduced profit-taking by long-term holders compared to short-term holders. This is a good sign of bottoming which aligns with the accumulation or reacumulation phase.
Exchange Reserves: The exchange reserves have been decreasing for a while. This means BTC is being moved off of exchanges which indicates confidence among holders.
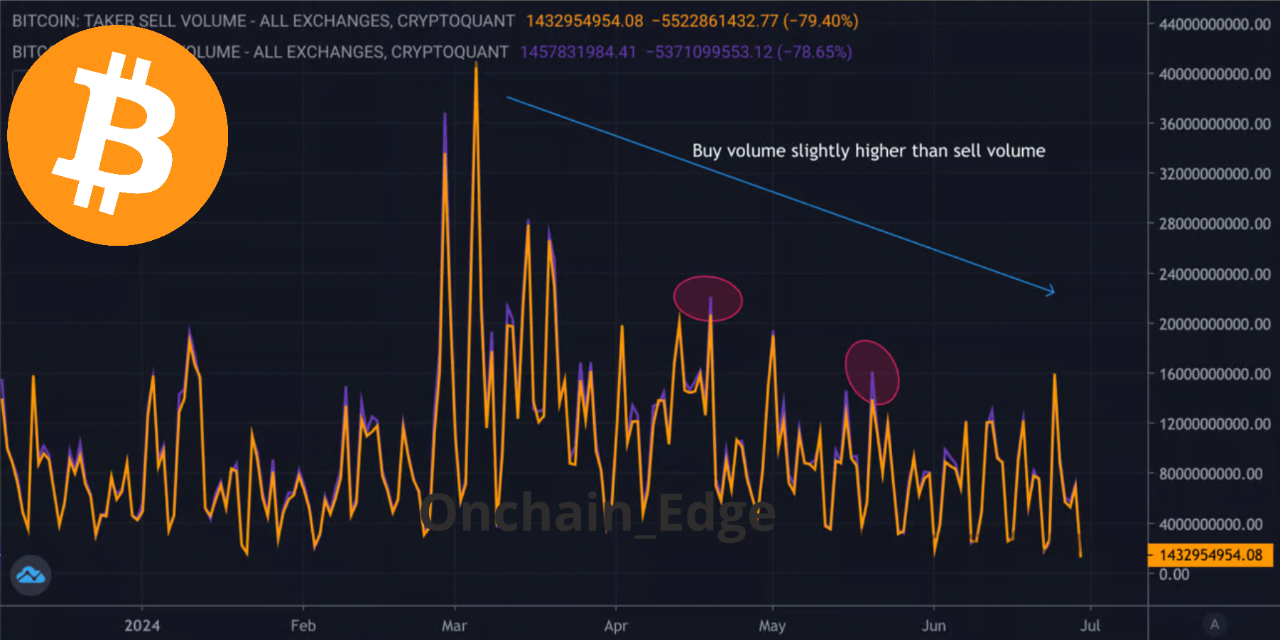
Taker Buy & Sell Volume: Decreasing volumes, with buy volume slightly higher than sell volume. Suggests a period of low volatility and possible accumulation.
If the reaccumulation phase continues, we could expect a breakout upwards (markup phase) as the next step in the Wyckoff cycle.

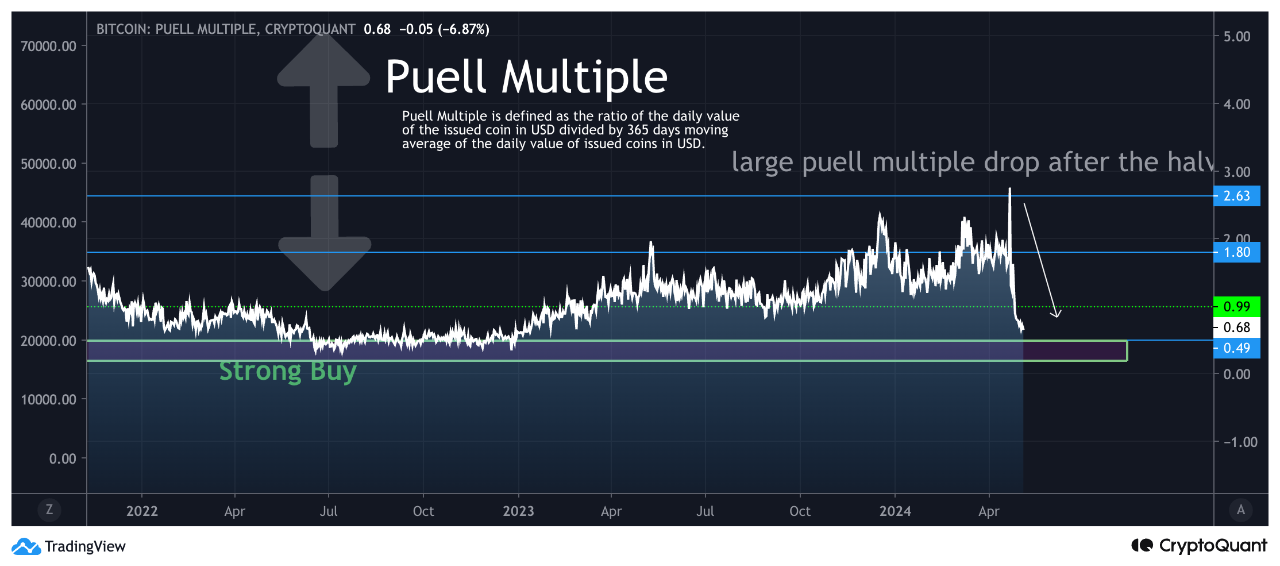
View original →The puell multiple dropped from 2.63 to 0.65 after the halving.
puell multiple value today with btc at $63k is at the same level as when btc was at $22k.
longterm outlook is bullish

View original →

