Bullish(Nuanced)BTC
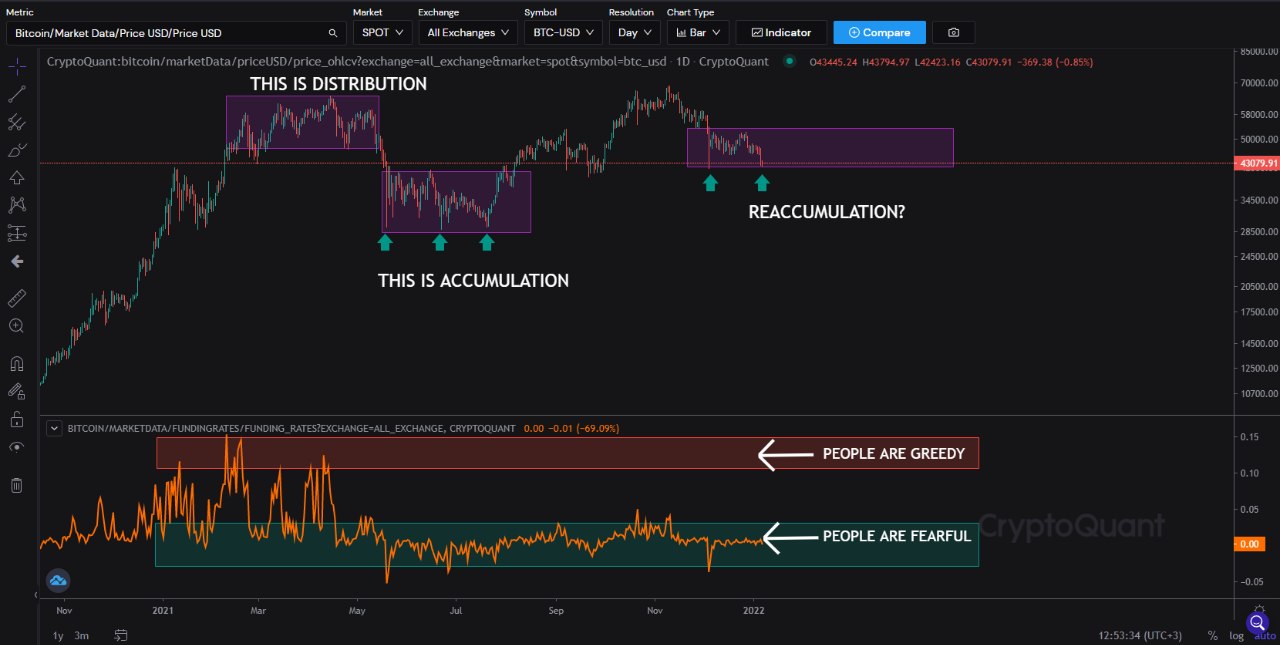
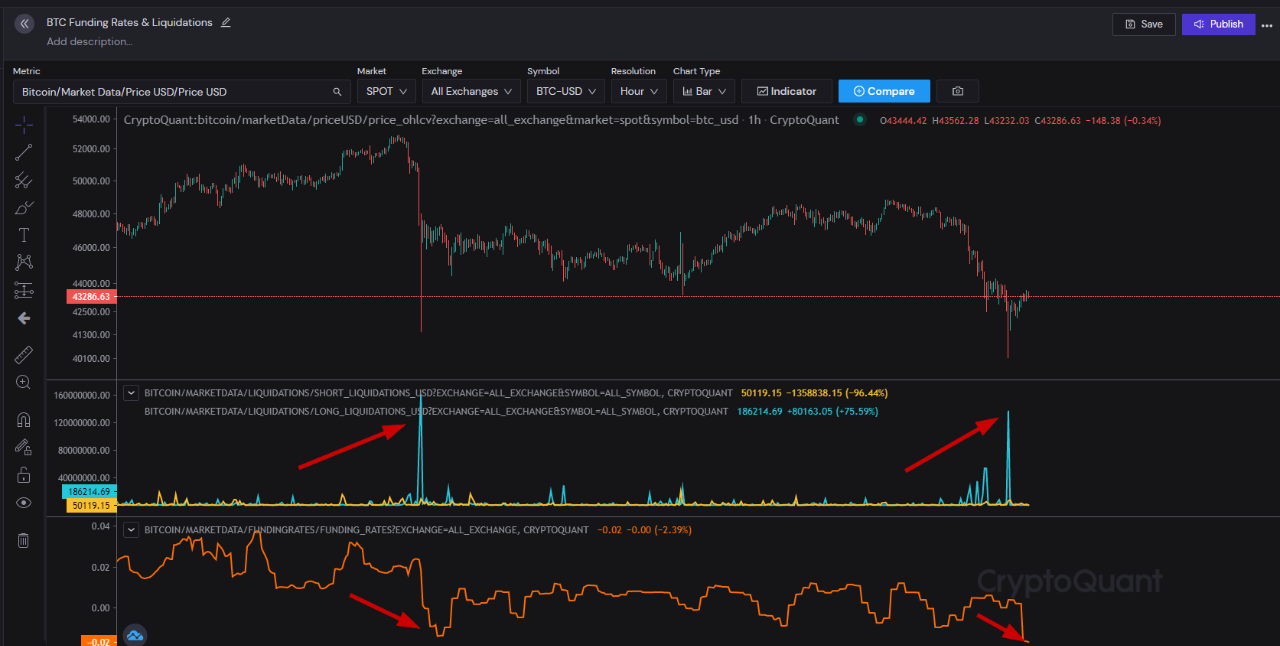
1/7/2022 Bitcoin tends to test liquidation lows to clear out longs entered at reaction from the first capitulation. In May crash, liquidation lows are tested twice. Now we are testing capitulation low. Funding rates are still in a fear zone. More people shorting here filling bids of the whales. We should see a more highs consolidating sideways or starting a mark up.

View original →Bullish(Nuanced)BTC
12/3/2021 While OI is high, funding rates are low, i.e. there isn't enough longs to cause liquidation cascade/crash. Price weakness is mostly caused by macro economic FUD which is not a topping signal for BTC and crypto as a whole.
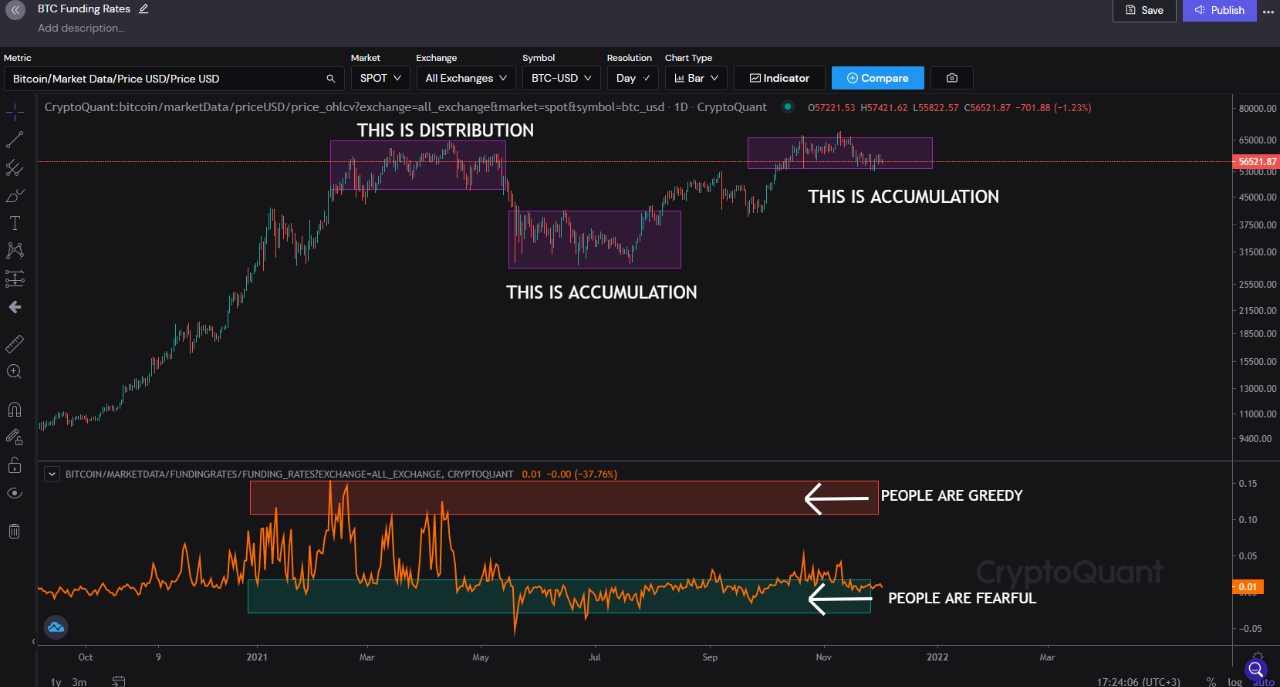

View original →Funding rates are still in the green, there is no craze whatsoever. TA perspective shows a reaccumulation structure from spot market. Every dip is creating higher highs and higher lows. Old coins are still hodling, too. There is no reason to sell at this point.
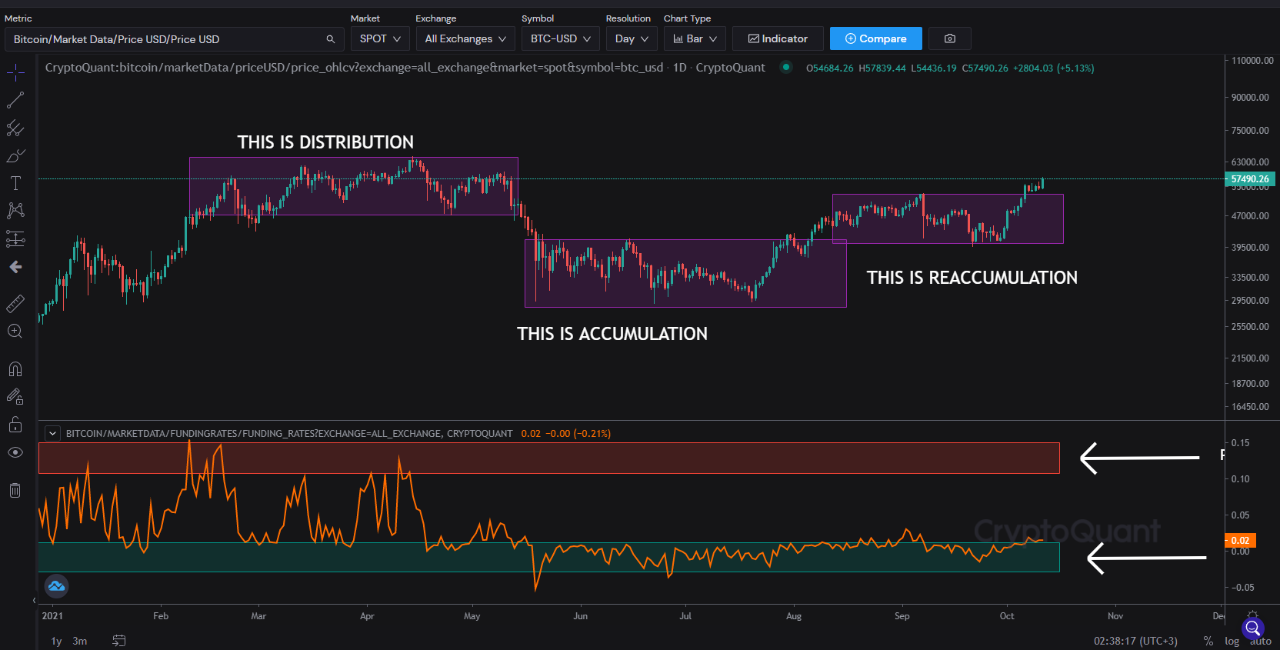

View original →Distribution happens when smart money dumps on high leveraged dumb money. During the accumulation we see the opposite. Right now funding rates are still in the green zone, that means the most recent pump is totally spot derived. It is a good time to buy every small dip.
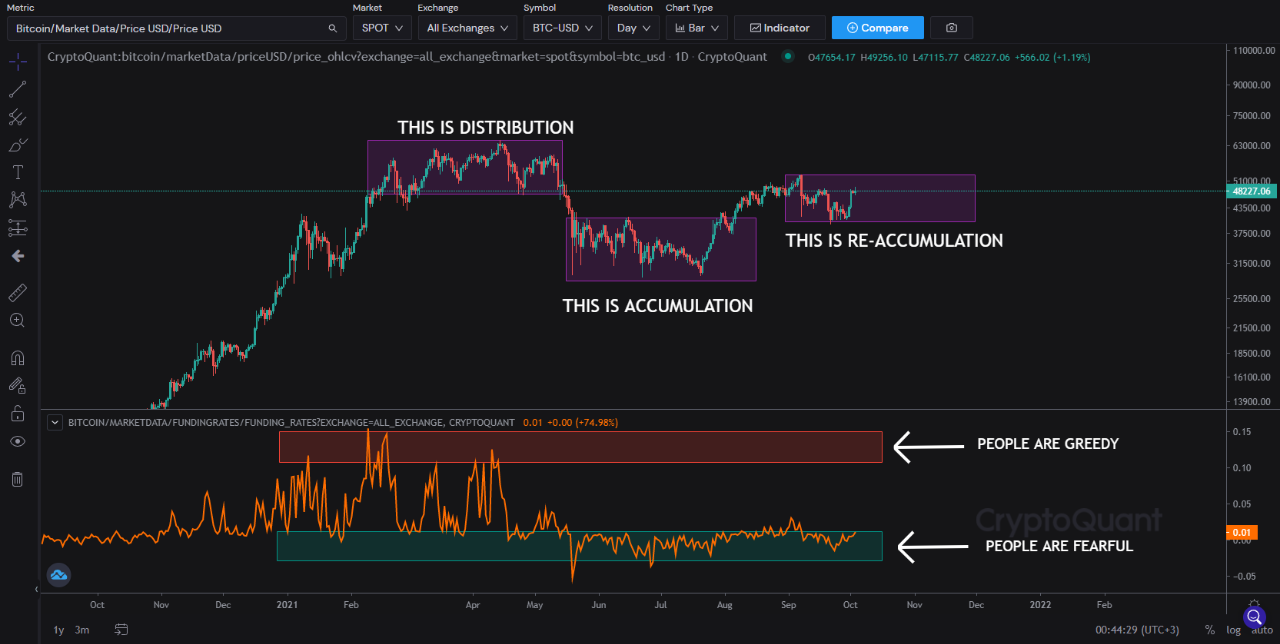

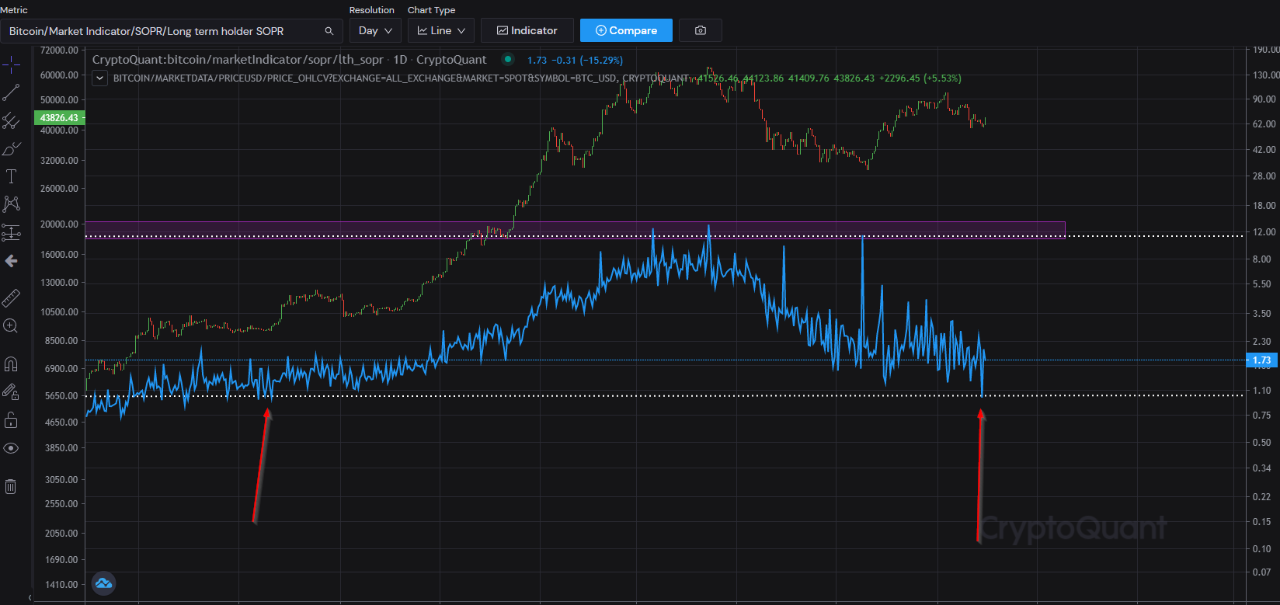
View original →Long term hodler SOPR wicked below 1 yesterday and it was the first time it happened since July 2020 when Bitcoin was trading at $9,500. That number means people who hodl BTC for longer than 6 months sold at a slight loss. That's a huge bullish recovery sign.

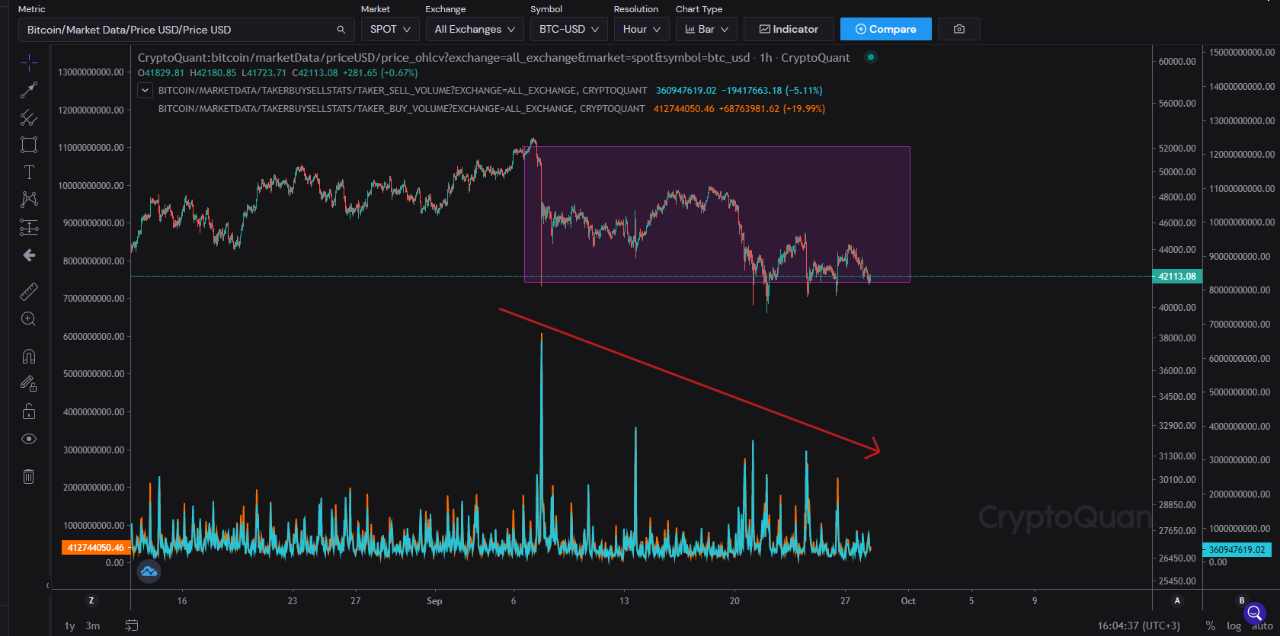
View original →Here is the chart showing taker buy and sell volume. Notice how money changes hand in every attemp downside. In every attempt, interest is diminishing, suggesting a bullish recovery. Do not forget, price returns bullish when fear is at its maximum which is now.

View original →We had 2 long spikes for long liquidations. When longs liquidated, they fill limit buy orders of smarter buyers. We have seen it twice in the same structure. We also have funding rate flattened, that means, people are not paying interest to long which is bullish.
The overall structure also looks like Wyckoff accumulation coupled with onchain metrics like ASOL below 1 and LTHs are not selling. We can expect a small rally and a little sideways action to complete the picture. Then to the moon.

View original →Most of the time, the answer is just before us. Simple.
When most people are in profit --> Sell pressure --> Bearish
When people are underwater --> They are afraid --> They sell to strong hands --> Bullish
In May, sell pressure was so high, people sold their BTC at a loss. Then, buyers of the last resort stepped in. Now there is confusion. People are not sure. When they are back, it's going to be too late. It's time to load.
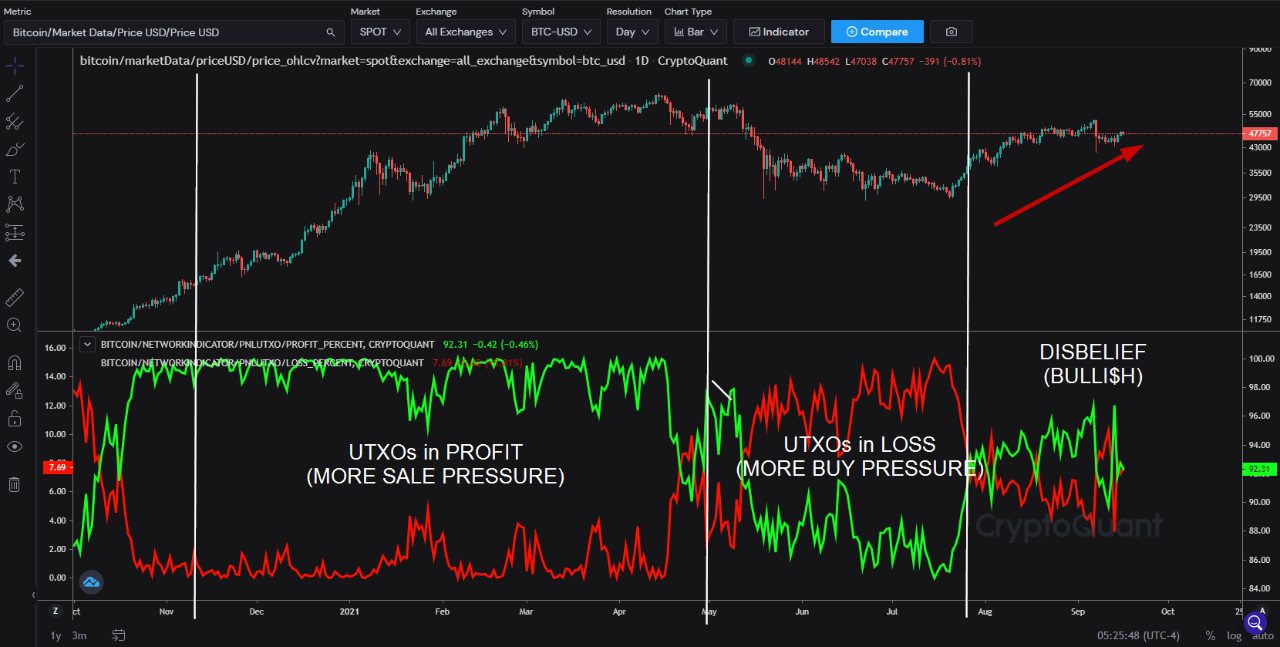

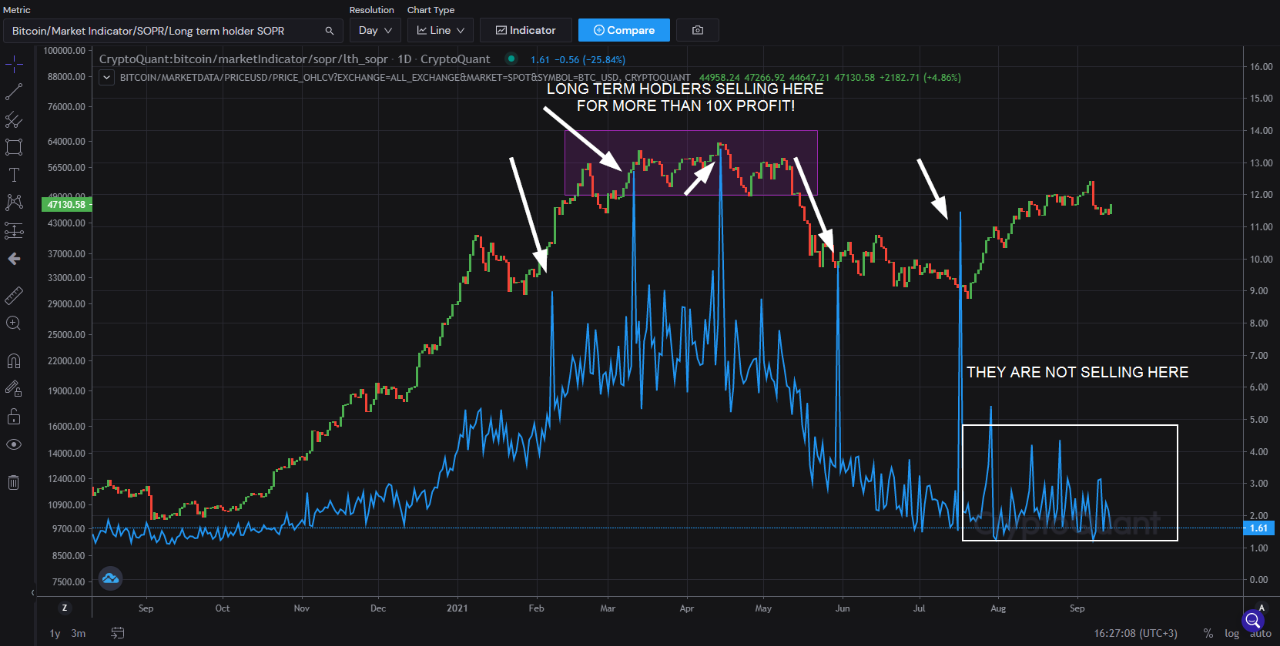
View original →Before the May dump, LTHs sold their coins with insane profits. Now is different. LTHs are now mostly hodling even though the price is over 60% up from the dips. Market is still warming up.

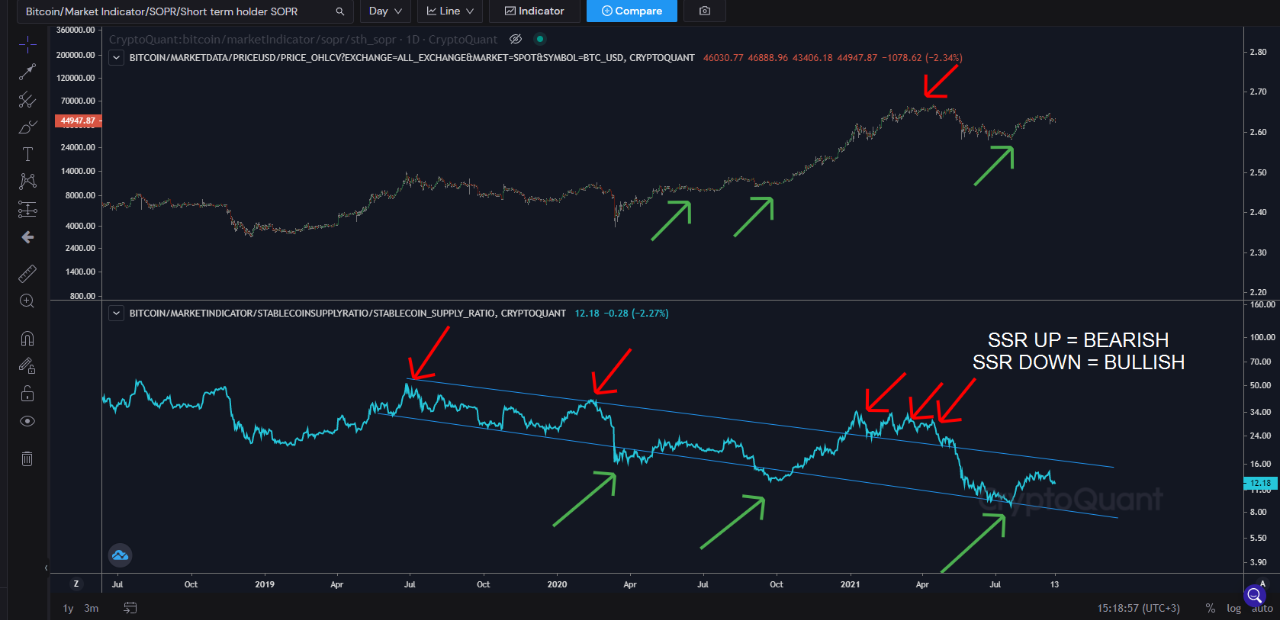
View original →Stablecoin Supply Ratio (SSR) is basically BTC Market Cap/Stablecoins Market Cap. So, if this number is low, stablecoins have more buying power against BTC. What do stablecoins buy? The answer is Bitcoin and altcoins.
SSR just tested the support and slowly climbing up. SSR is simply in an oversold condition. It is as bullish as it can be for Bitcoin ant alts.

View original →

