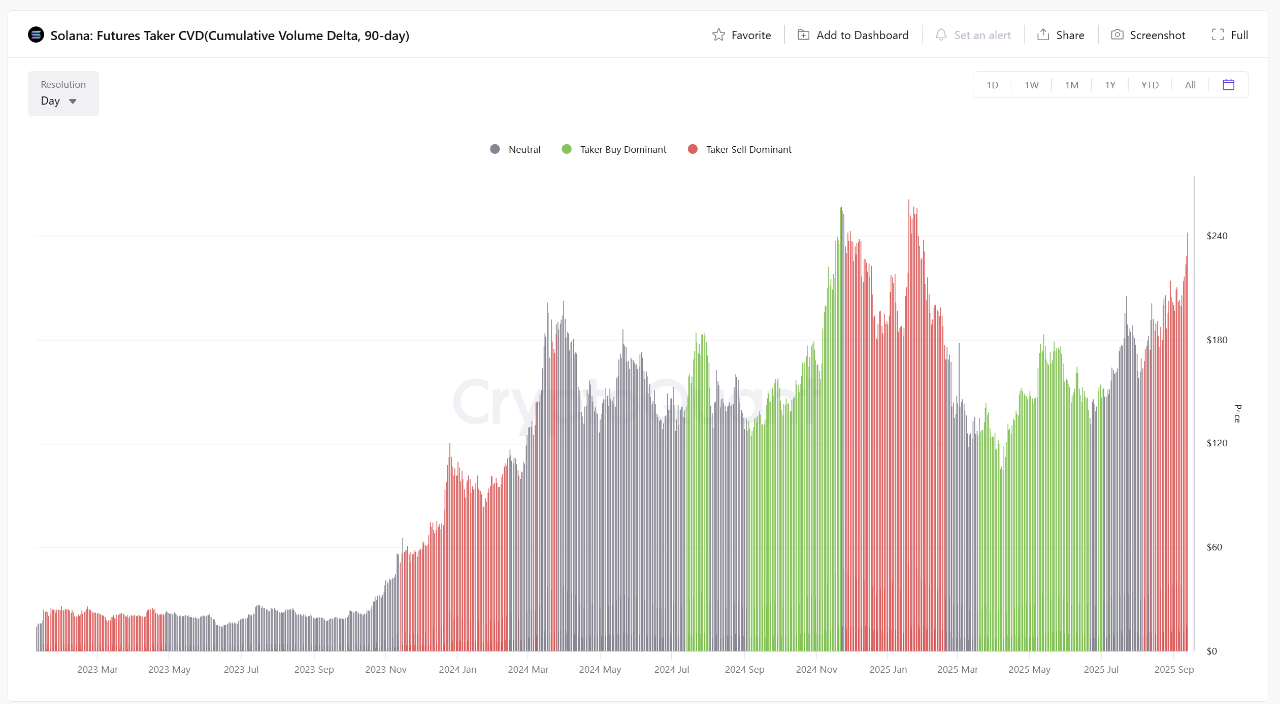
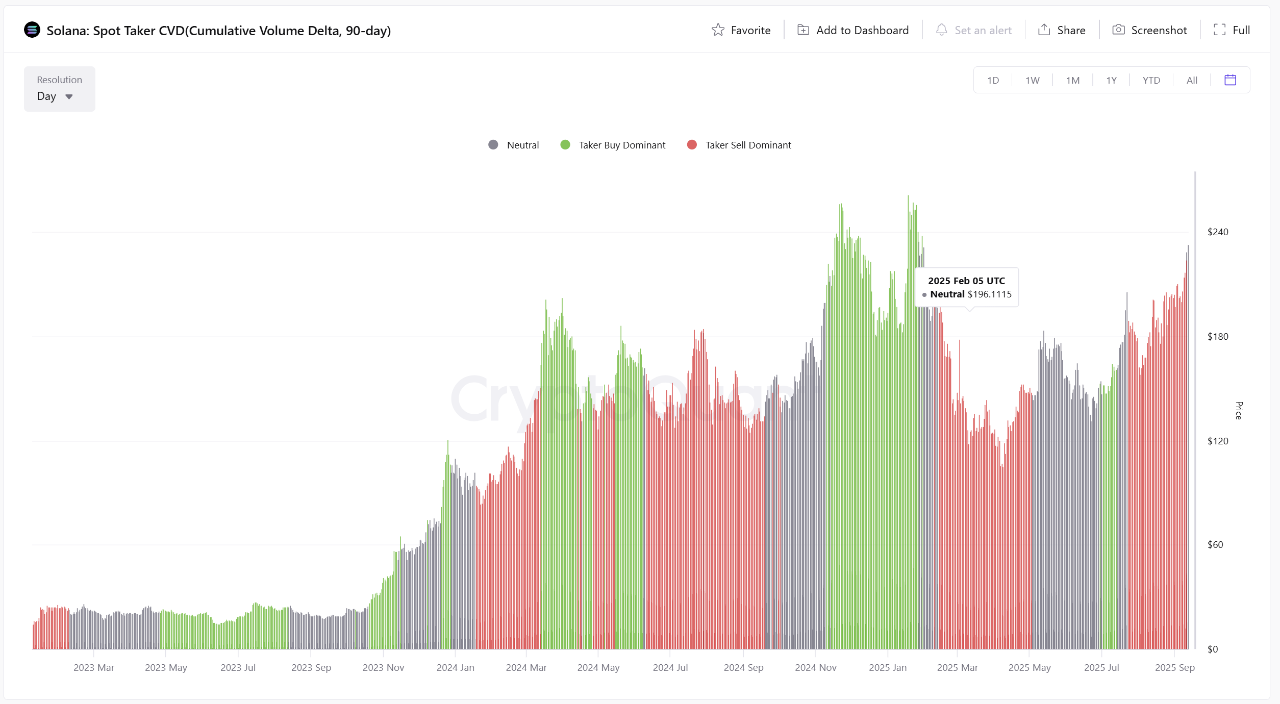
Solana's market displays a clear bullish divergence between spot and derivatives activity. The 90-day Spot Taker CVD shows strong, consistent buying pressure, indicating sustained demand-driven accumulation. In contrast, the flat Futures Taker CVD reveals that leveraged traders remain cautious, neither aggressively long nor short, suggesting a lack of speculative excess in derivatives markets.
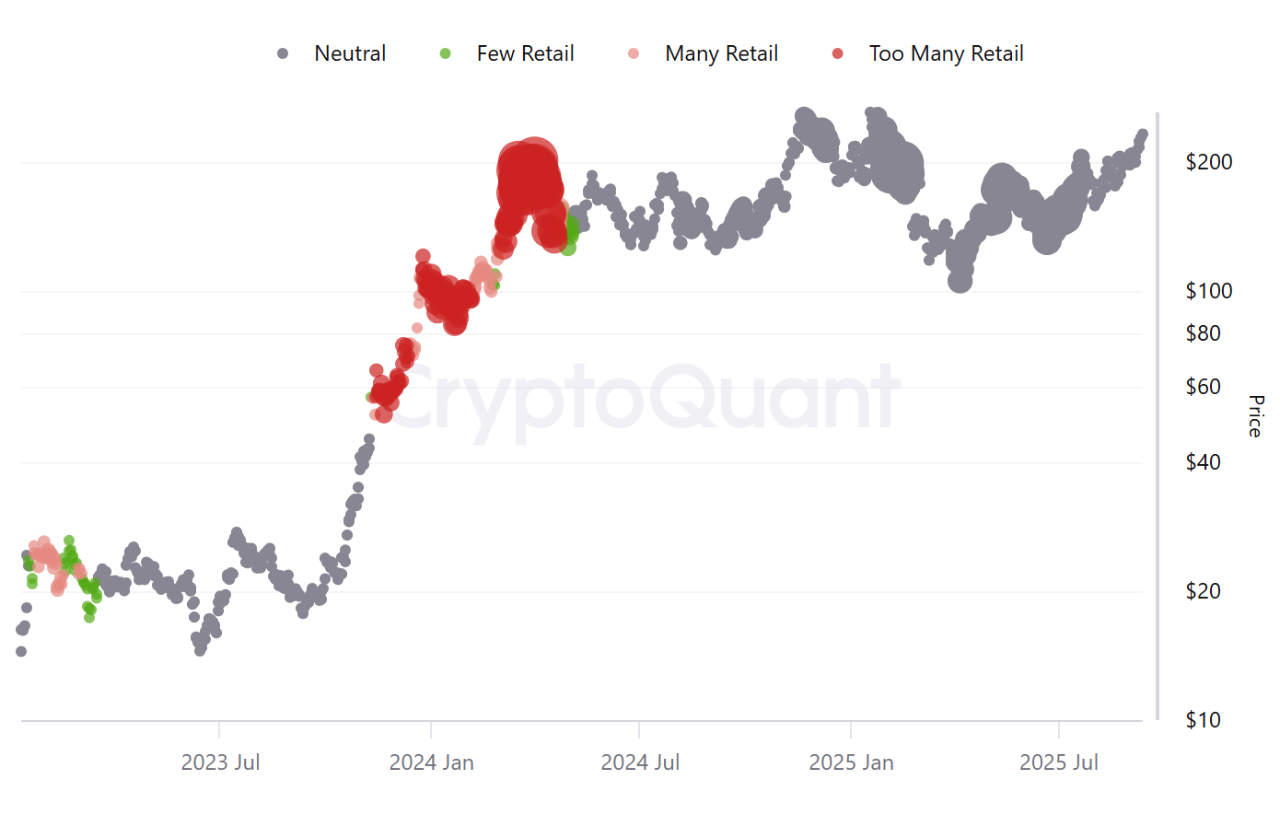
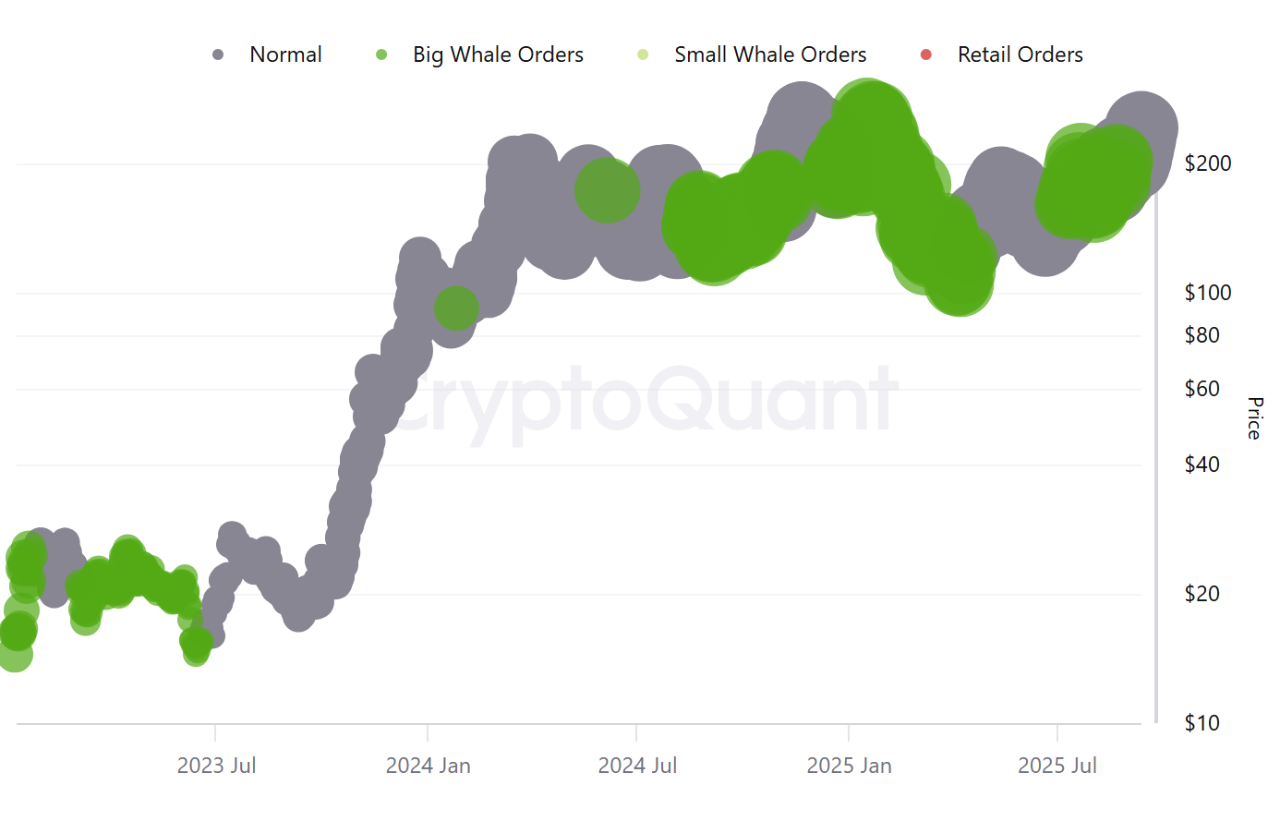
Retail participation is a key driver of this rally. A surge in Spot Retail Trading Frequency confirms broad-based buying from smaller investors, supporting organic price appreciation. This is complemented by stable Futures Average Order Size, which points to balanced institutional and retail activity in derivatives without dominant large-position dominance.
Overall, Solana’s advance appears sound. It was propelled by genuine spot market demand rather than speculative leverage. Strong retail involvement and positive spot CVD provide a sustainable foundation, while neutral futures positioning reduces the risk of a sharp deleveraging event. The market reflects healthy growth supported by diverse investor engagement.

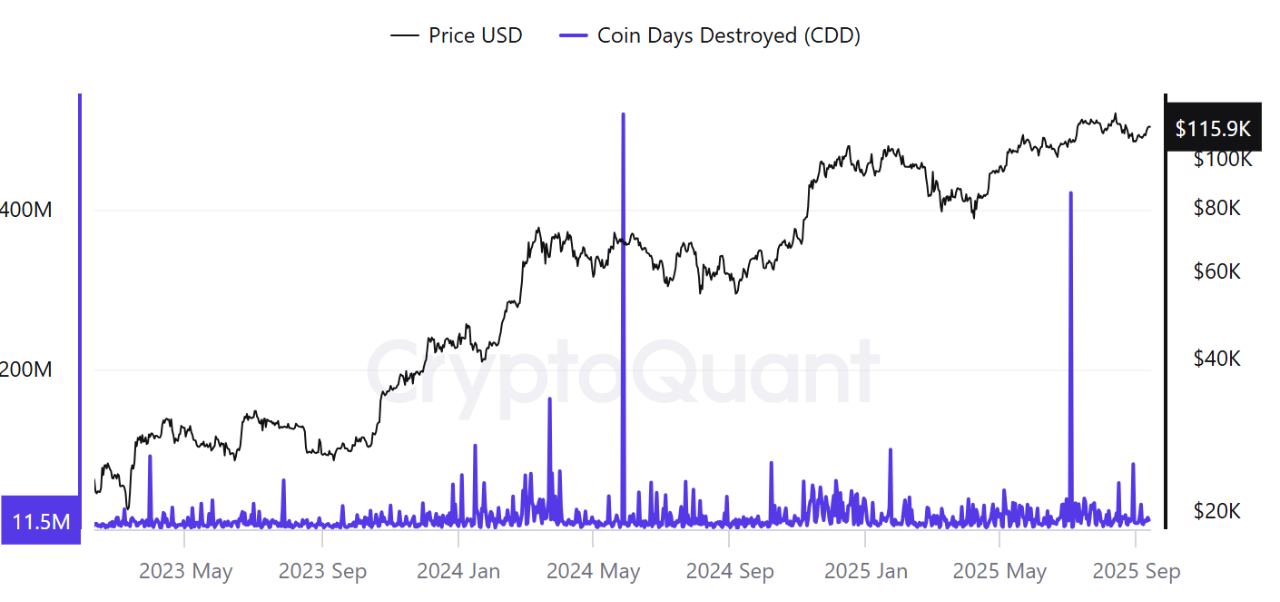
View original →A spike in Coin Days Destroyed (CDD) in July 2025 revealed that over 421 million in dormant Bitcoin was moved. Such activity often sparks fear that long-term holders are selling at a market top. Data suggests this was calculated profit-taking, not panic.
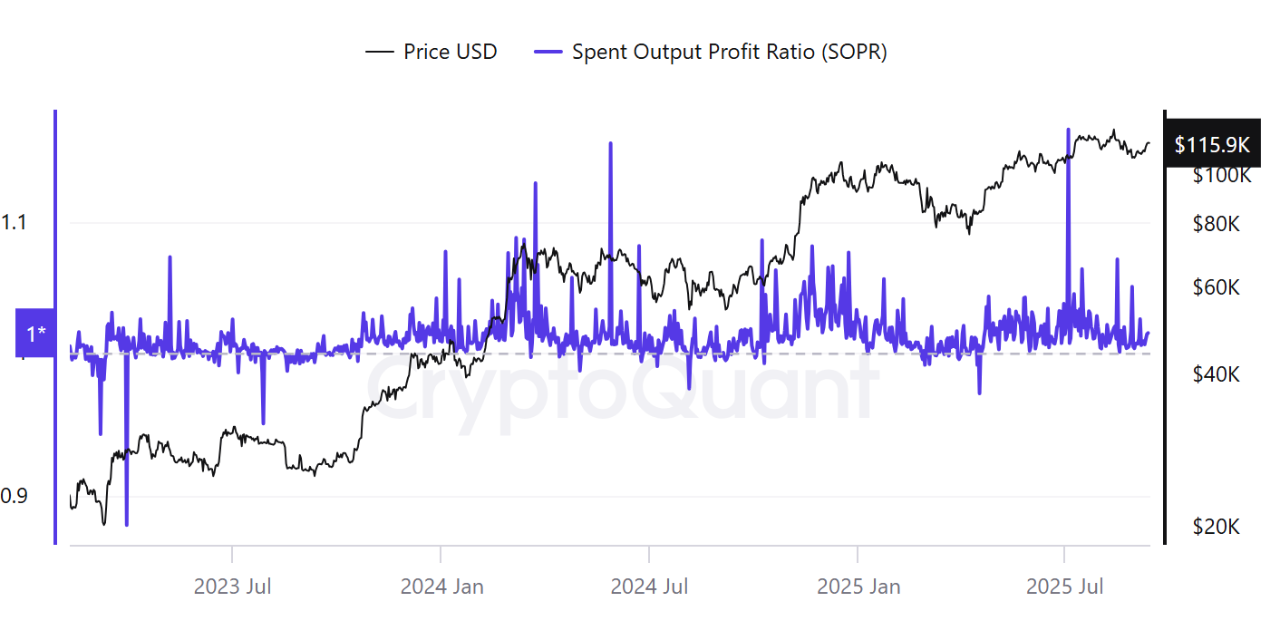
The Spent Output Profit Ratio (SOPR) surged to 1.17 in July 2025, showing that the coins were sold for a substantial gain, especially when compared to lower SOPR values of 0.88 in March 2023 and 0.97 in April 2025.
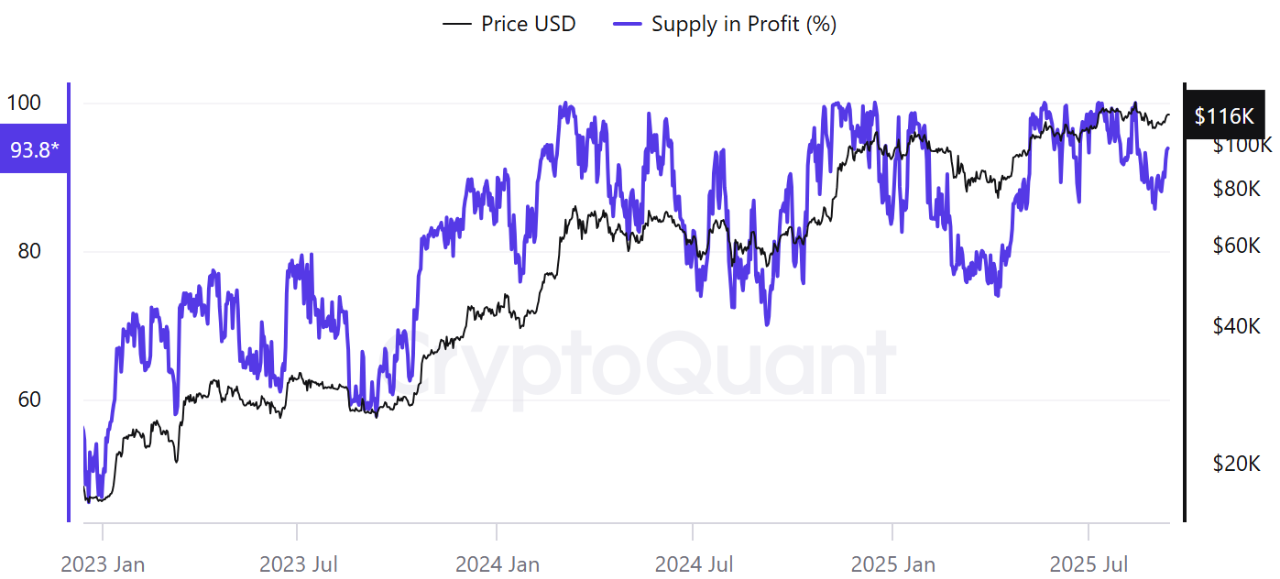
Crucially, the market absorbed this selling pressure without breaking its bullish structure. The key insight is the stable, continuous rise in the Percent Supply in Profit since January 2023 despite volatility across Q2 2024 to Q1 2025. While the old Bitcoins were cashed out, the vast majority of the market remains profitable, demonstrating underlying strength.

View original →Bullish(Nuanced)LINK
7/3/2025 LINK’s $12-$15 stalemate reflects deepening institutional accumulation amid retail apathy. Sustained negative exchange netflow (~ -100k LINK/week) confirms whales absorb sell pressure, punctuated only by brief retail-driven spikes like March 2025’s +5M LINK deposits. Retail disengagement is evident in flat active addresses (~28K-32K/day) and stagnant transaction counts (~9K/day), failing to capitalize on Q4 2024’s minor activity bump despite growing oracle utility.
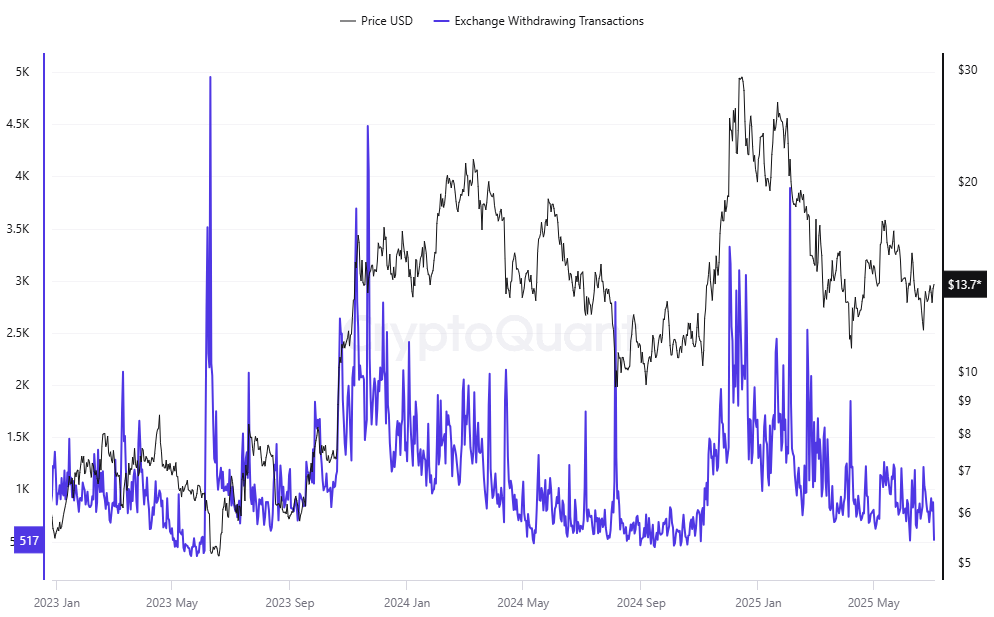
The deadlock persists through whale urgency: exchange withdrawing transactions surged in Q4 2024 (peaking at 3k/day) and remain elevated, converting retail sell orders into accumulation fuel. Neutral leverage metrics prevent volatility, allowing whales to systematically withdraw LINK without price disruption. This creates a supply squeeze, exchange reserves fell ~40% YTD, yet retail’s absence caps upside momentum at $15 resistance.
Resolution demands retail ignition or whale exhaustion. A breakout requires a significant amount of active addresses exceeding as well as transactions to breach $15. Conversely, if withdrawing transactions dip below significantly alongside positive netflow, accumulation weakens; risking a fall to $10. Until catalysts emerge, whales silently build positions, echoing Bitcoin’s 2023 consolidation before its 2024 surge.
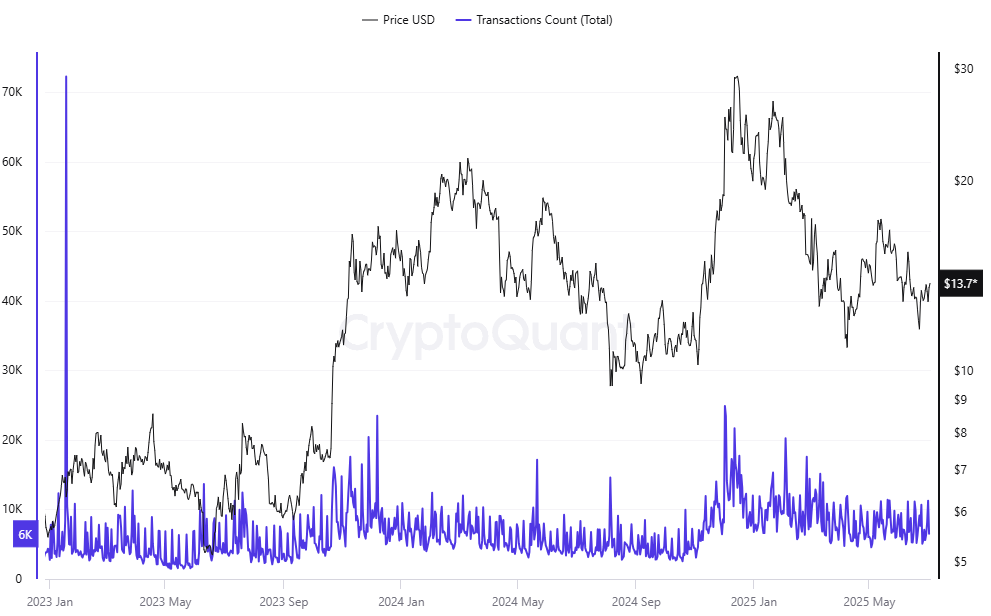
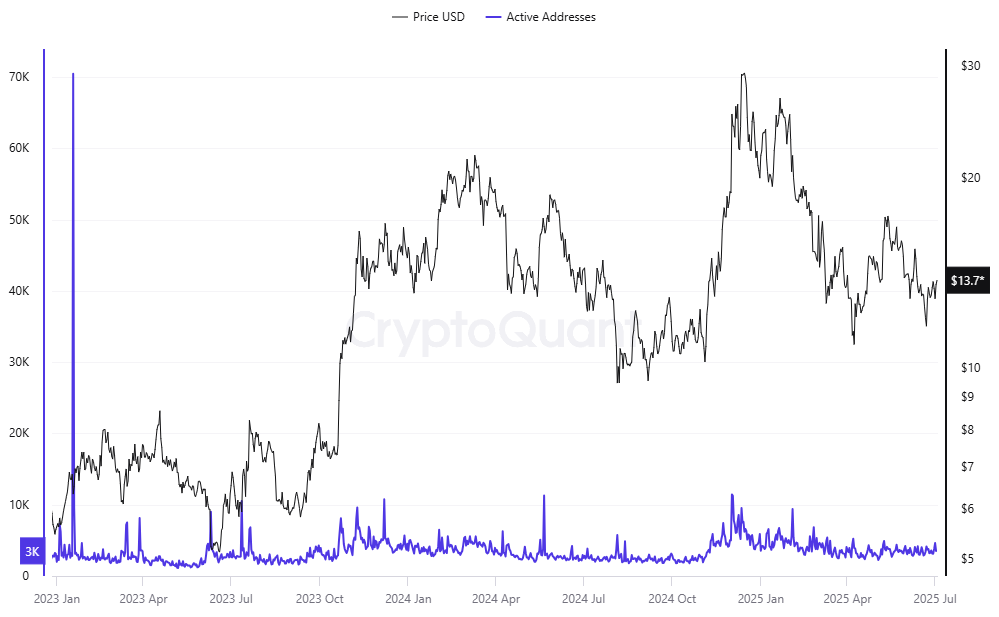
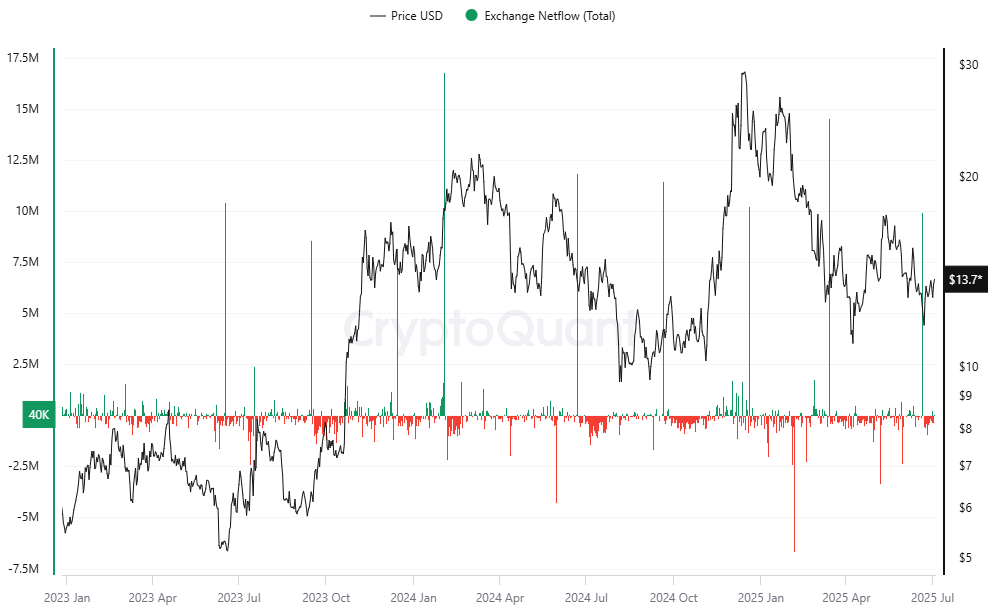

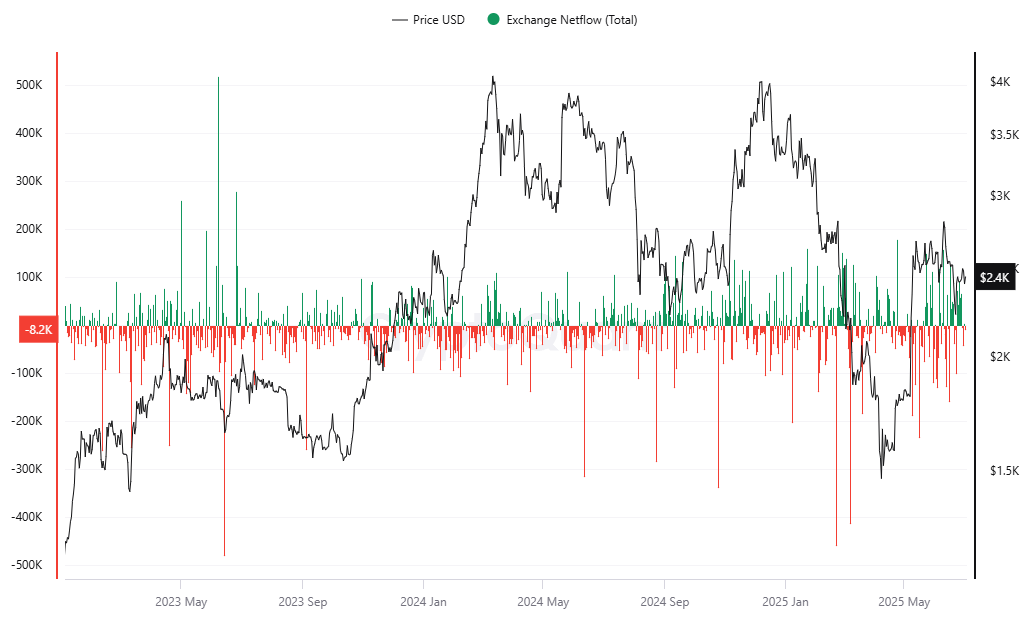
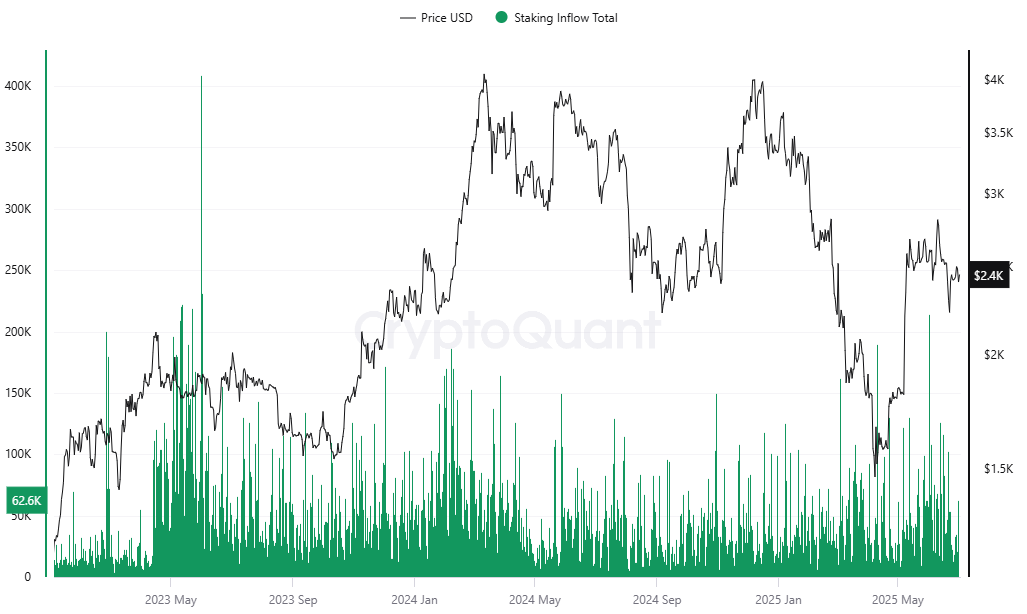
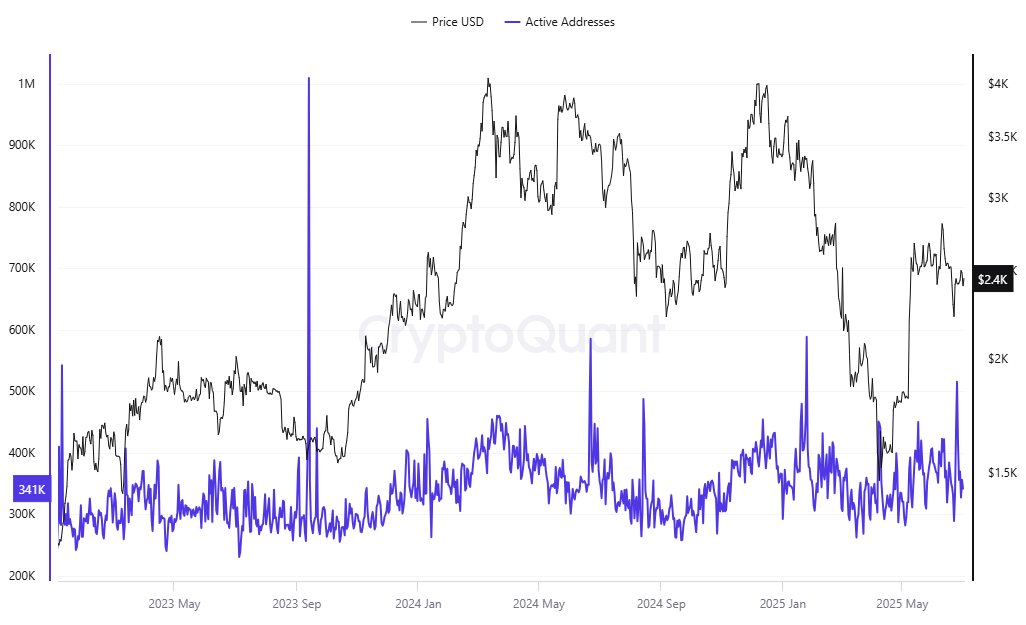
View original →Ethereum's current stagnation reflects a standoff between whale accumulation and retail passivity. Persistent ~60k ETH/week staking inflows signal institutional commitment, while exchange netflows show dominant negative spikes (200k+ ETH withdrawals), absorbing sell pressure from occasional retail-driven deposits like the 100k ETH inflows recorded since 2023. Retail engagement remains tepid, with active addresses flat at 300k-400k/day; well below levels associated with bullish breakouts.
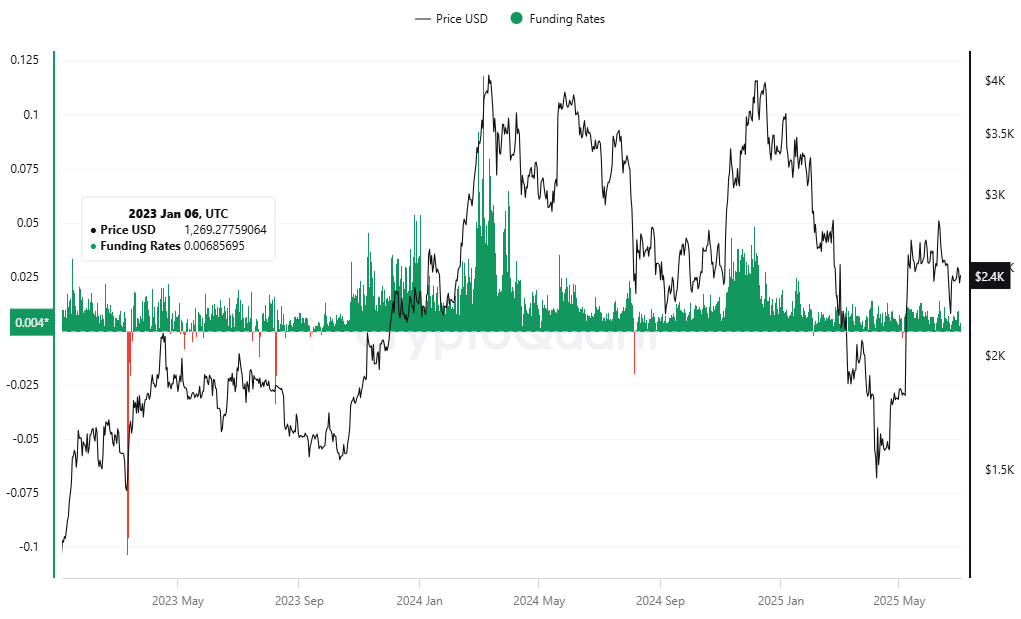
Neutral funding rates (0.004%) indicate balanced leverage demand, preventing liquidation cascades. This stability masks underlying tension: whales use exchange withdrawals to counter retail sell orders, creating a supply squeeze. The absence of address growth above 400k/day since early 2025 confirms retail’s reluctance to fuel momentum.
Resolution requires a catalyst to break the deadlock. Sustained staking inflows and whale-level accumulation set a floor, but retail participation must exceed 400k daily addresses to initiate upward volatility. Until then, ETH remains rangebound, with whale absorption mechanisms containing downside risk.

View original →BullishUSDTUSDCBTC
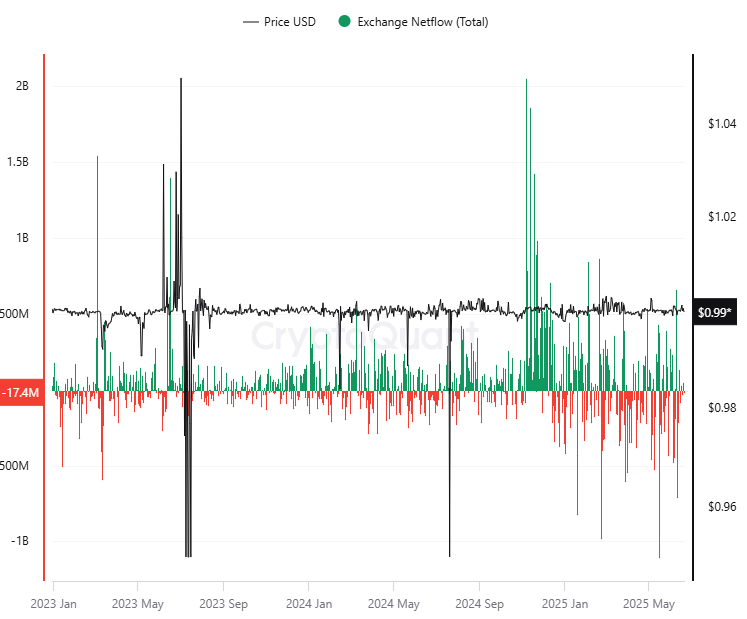
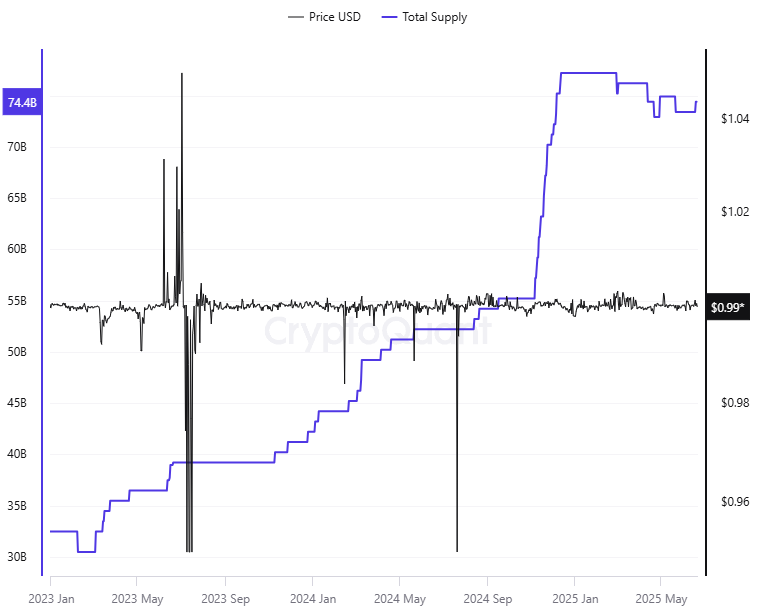
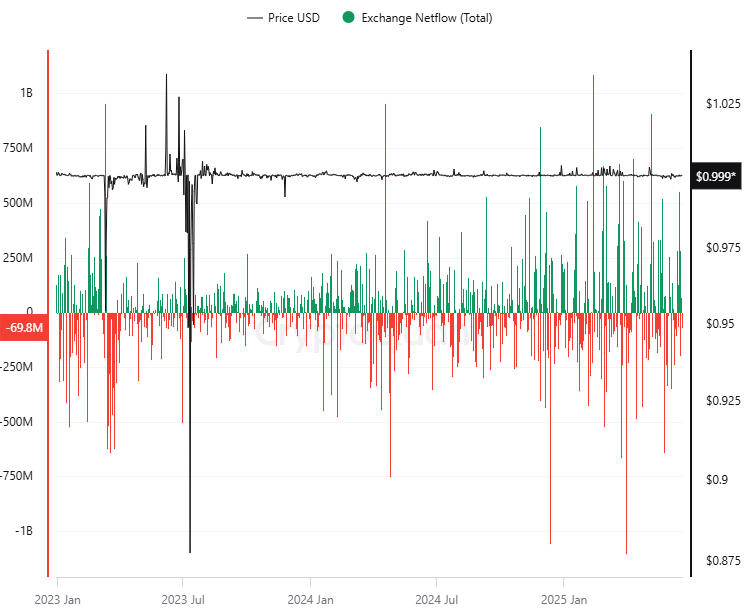
6/20/2025 Tether’s dominance is accelerating. On Ethereum, USDT supply growth remains strongly positive, signaling continuous new minting (+$12B YTD). Critically, USDT exchange netflows are also positive, confirming this fresh supply is being injected directly into trading venues; fueling liquidity for BTC and ETH pairs. This dual expansion cements Tether’s grip on crypto’s liquidity infrastructure.
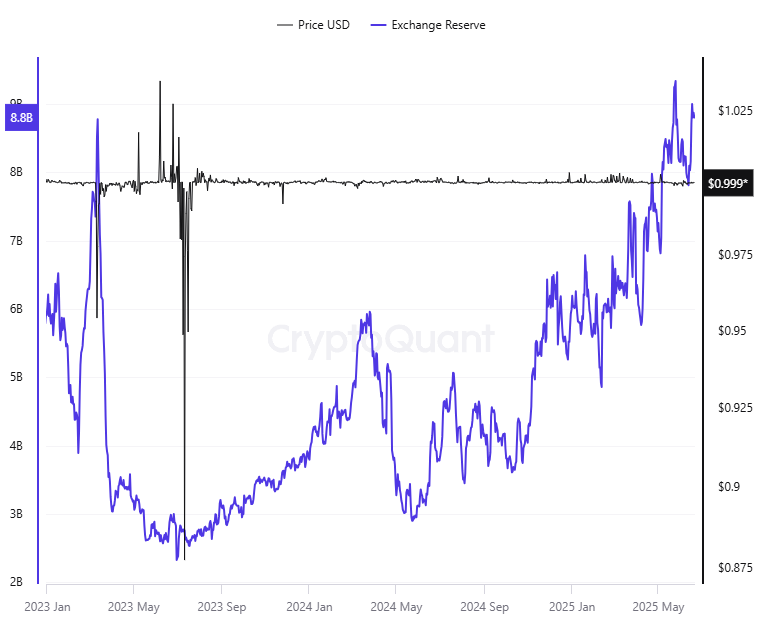
Meanwhile, USDC tells a different story. Though its exchange reserves recently surpassed 2023 levels, this masks a strategic retreat: USDC netflows are persistently negative, indicating institutions are withdrawing coins faster than deposits arrive. This divergence, USDT flooding exchanges while USDC leaks out, creates a hidden risk: Tether now commands 78% of stablecoin liquidity, concentrating power and leaving altcoins starved for diverse stablecoin depth.

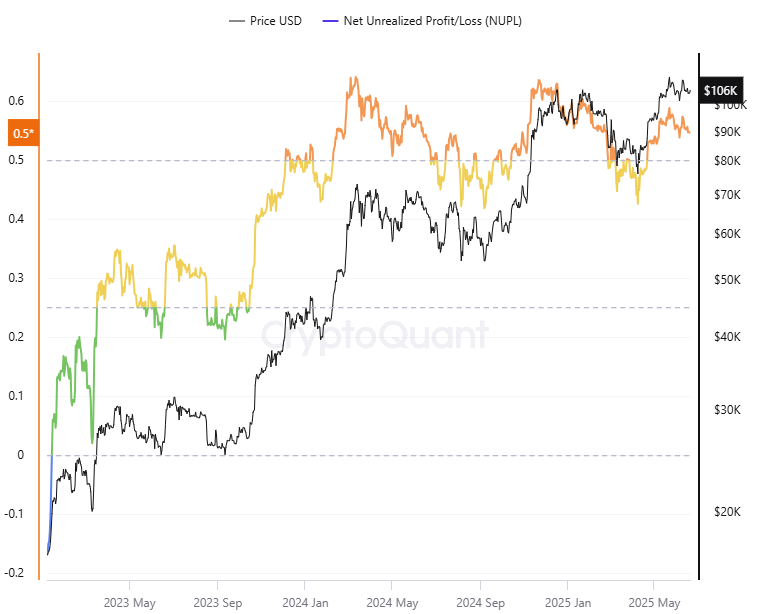
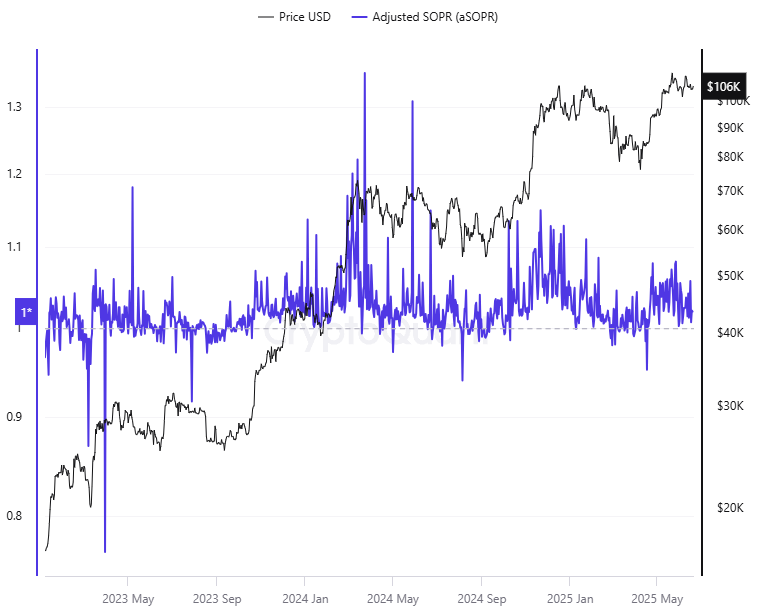
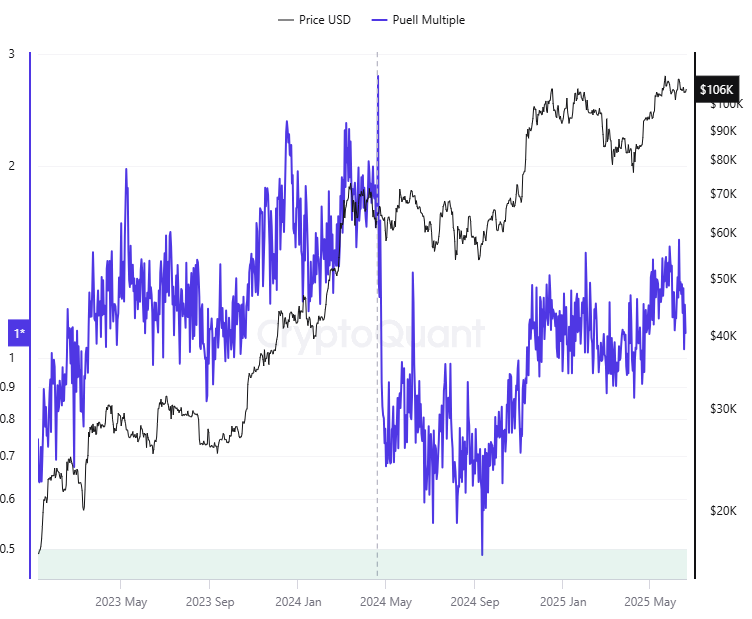
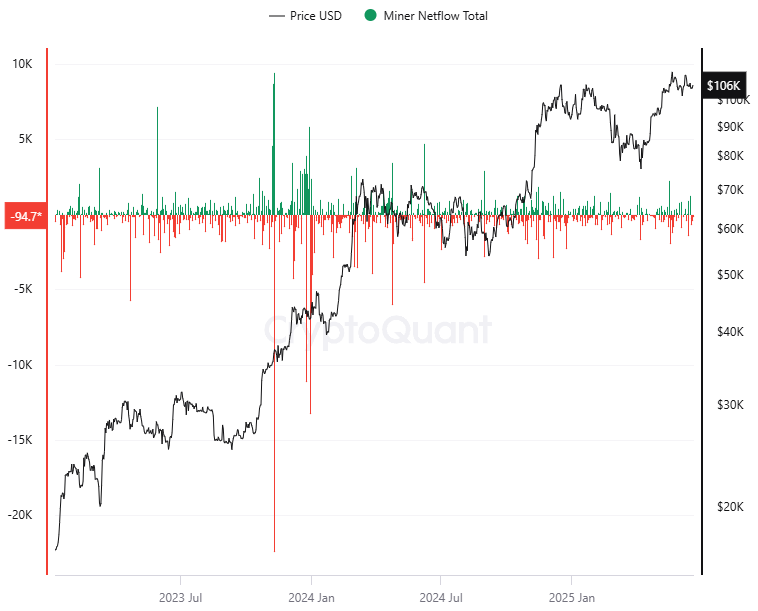
View original →Bitcoin’s defense of the $60,000 support level reveals strategic accumulation, not panic. Miners are net withdrawing BTC from exchanges (negative netflow), signaling confidence despite recent volatility. With the Puell Multiple at approx. 1.0, they remain profitable and show no signs of distressed selling; a stark contrast to capitulation events. Simultaneously, NUPL’s 0.55 reading places the market in the "greed" zone, indicating broad unrealized profits.
Investors exhibit disciplined profit-taking, not fear. The aSOPR hovering slightly above 1.0 confirms measured profit realization, avoiding panic-driven loss-selling. This combination, miner accumulation, stable profitability, and controlled greed, suggests institutional players are using the $60k dip to build positions. For now, data signals a bullish consolidation, not a breakdown.

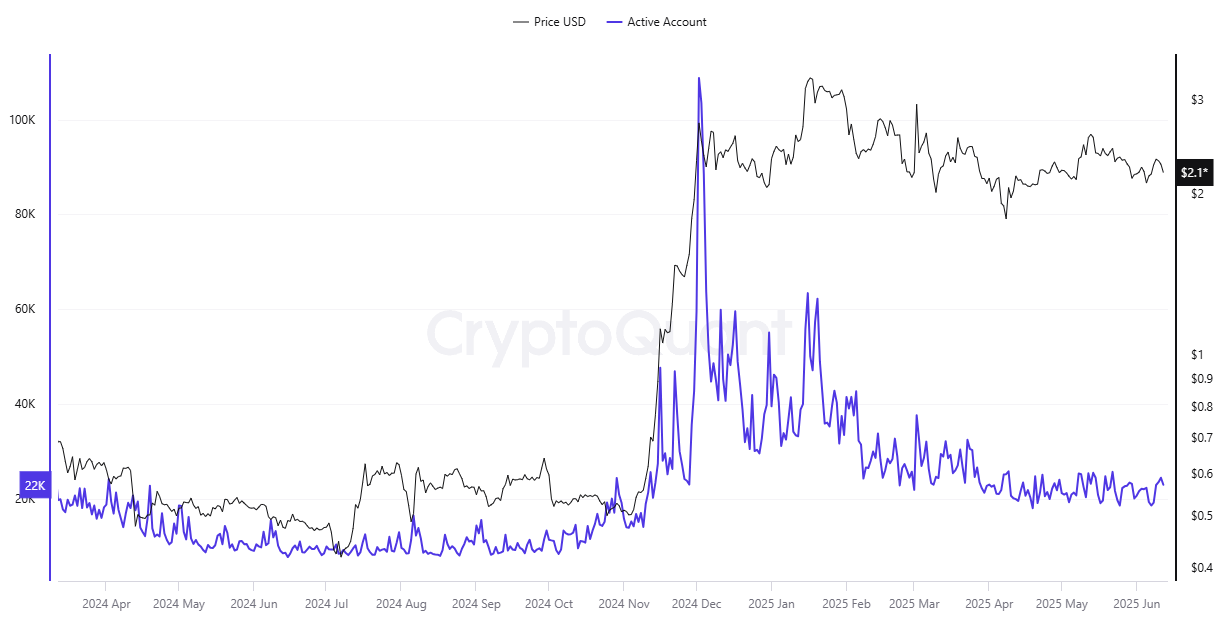
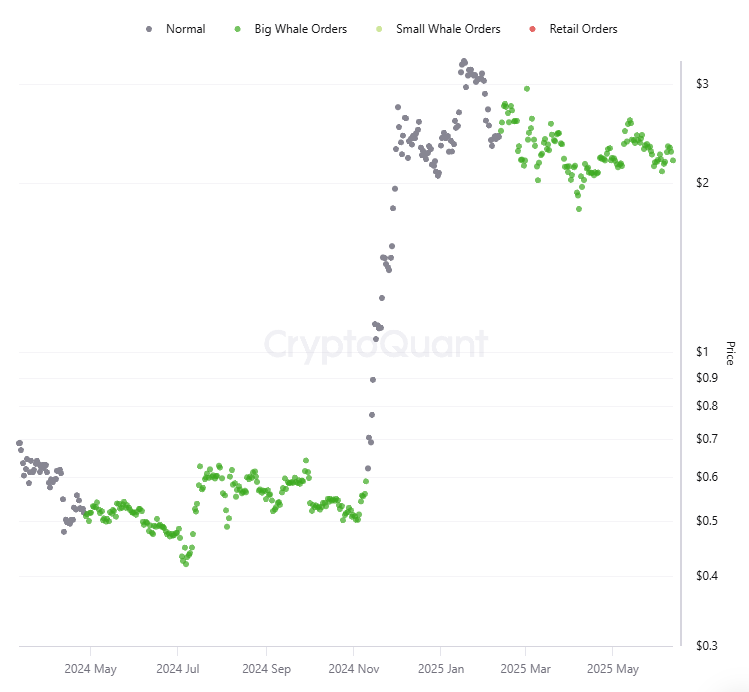
View original →XRP's recent price and volume surge presents a nuanced picture on CryptoQuant. Initially, the rally showed clear signs of retail FOMO. Active Addresses spiked significantly with price increases, then quickly fell as the market stabilized, a textbook pattern of individual investors rushing in and then disengaging. This retail impulse was further underscored as Spot Average Order Size revealed that normal investors drove the price up, reflecting smaller transaction sizes typical of the broader retail market.
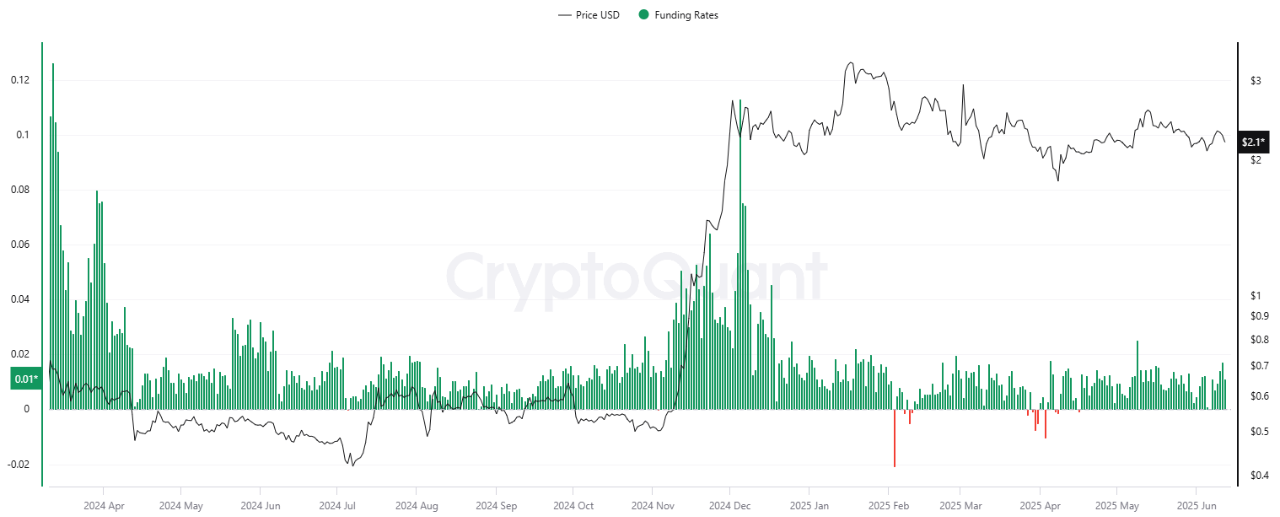
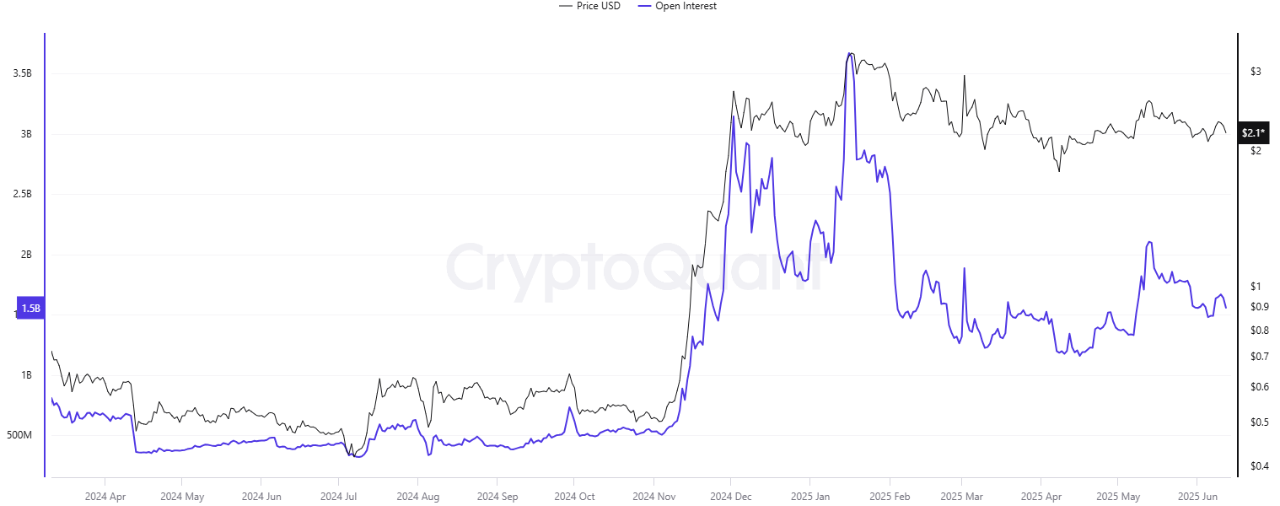
However, the narrative isn't purely retail-driven. Post-pump, larger players appear to be providing a supportive layer. The Funding Rate in derivatives markets remains positive at pre-hike levels, suggesting persistent bullish sentiment from leveraged positions. Similarly, Open Interest, though down from its peak, stays significantly higher than before the surge, indicating sustained speculative capital. Crucially, Spot Average Order Size also indicates that whales keep the price up, implying that after the initial retail push, larger entities are stepping in to either accumulate or defend price levels.
In essence, XRP's recent market action is a two act play. Retail investors sparked the initial, rapid ascent. Now, however, larger players are playing a critical role in maintaining price stability and providing underlying support, moving the market beyond a simple, fleeting retail-driven pump.

View original →Bearish4/30/2025
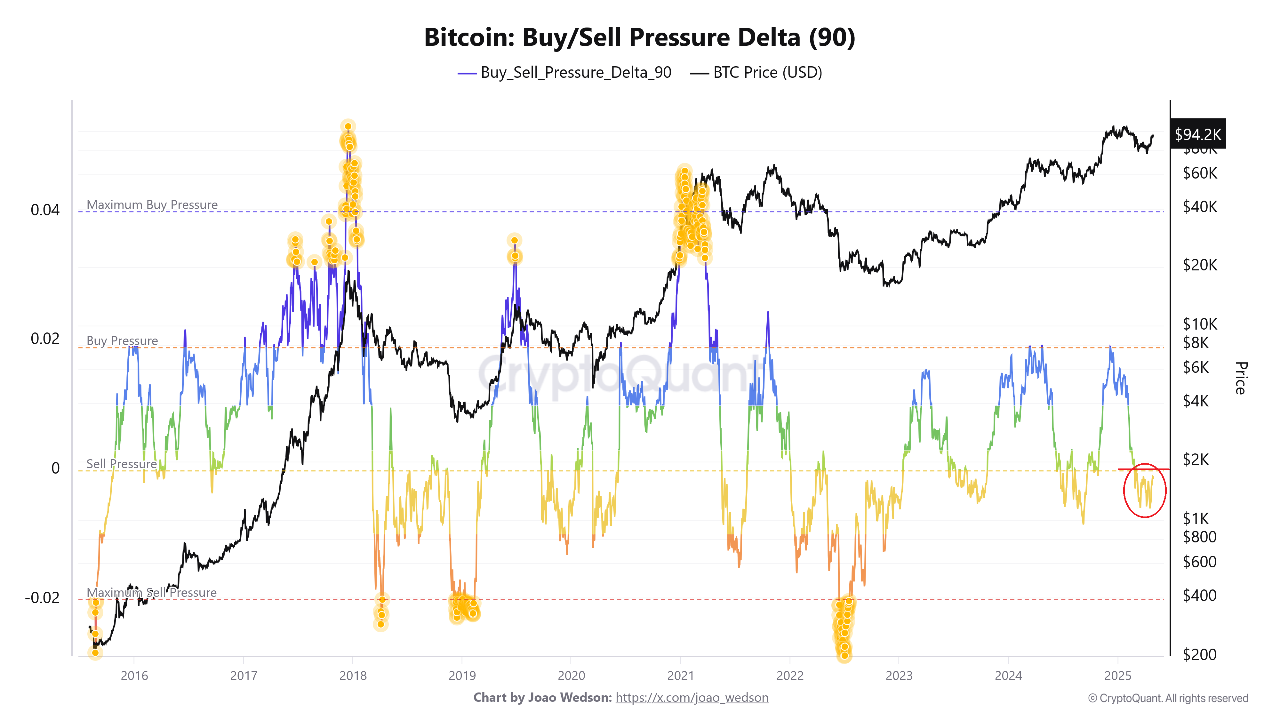
The Buy/Sell Pressure Delta is a powerful tool for identifying market extremes, helping traders strategically time their entries and exits. When the indicator shows high positive values, it often signals buyer exhaustion, suggesting a potential selling opportunity before a market correction. Conversely, low or negative values indicate seller exhaustion, presenting a buying opportunity as the market prepares to recover. On 6th March 2025, the indicator signaled the start of a sell pressure phase, marking a shift in market sentiment. By 18th March, the most significant sell pressure signal of the year emerged, highlighting a potential peak in selling momentum. Currently, the market remains at equivalent levels, reinforcing the possibility of a selling opportunity. Traders should monitor these signals closely, as sustained sell pressure could precede a downward correction. This indicator’s ability to capture sentiment extremes makes it invaluable for anticipating reversals. While no tool guarantees absolute precision, the Buy/Sell Pressure Delta provides actionable insights when combined with broader market analysis. As always, risk management remains crucial—confirming signals with additional indicators can enhance decision-making. The current setup suggests caution for buyers and a potential advantage for sellers, but market conditions can shift rapidly

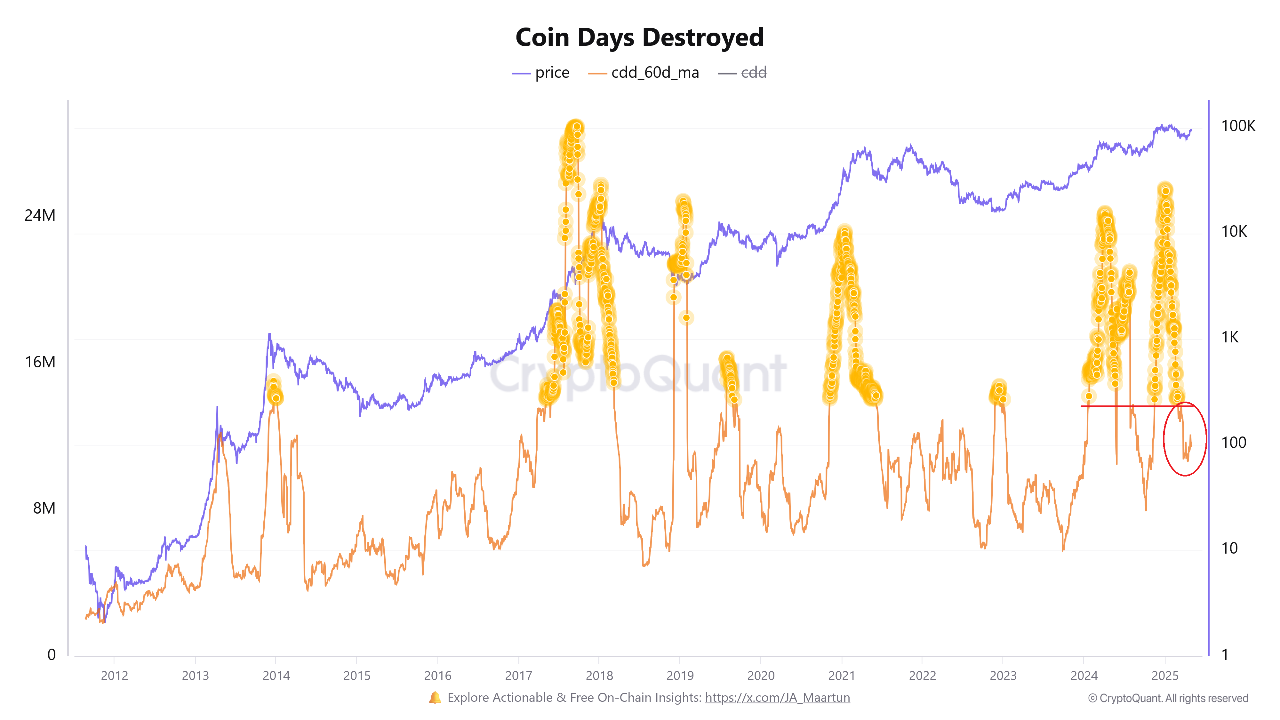
View original →The extended period of heightened activity among Bitcoin's long-term holders has finally normalized, according to the latest Coin Days Destroyed (CDD) 60-Day indicator. After elevated readings since mid 2024, the indicator began normalizing around March 15, 2025, before dropping to significant lows by March 27. The CDD metric, which weights transactions based on coin dormancy, had been signaling unusual behavior from Bitcoin's patient investors for nearly a year. Unlike standard volume, CDD gives greater weight to coins held long-term, making it a crucial sentiment barometer. The initial surge began January through July 2024, followed by a cooling period. Activity resumed with greater intensity from November 2024 through February 26, 2025, reaching levels not seen since 2021's market peak. This suggested long-term holders, who typically view Bitcoin as a store of value, were unusually active. The mid-March normalization represents a significant market shift. The drop to lows on March 27 indicates that these holders have largely completed their repositioning or profit-taking activities. This transition coincides with the market's move into sideways trading, suggesting a correlation between long-term holder activity and broader market directionality.
Historically, extended CDD elevation periods have preceded important market transitions. The return to baseline activity could signal the redistribution phase has concluded, potentially setting the stage for a new market cycle. With fewer long-term holders moving coins, supply dynamics may stabilize, reducing selling pressure. For traders, this suggests monitoring for signs of accumulation, as periods of low CDD following extended high CDD have sometimes preceded new accumulation phases before the next significant market move.

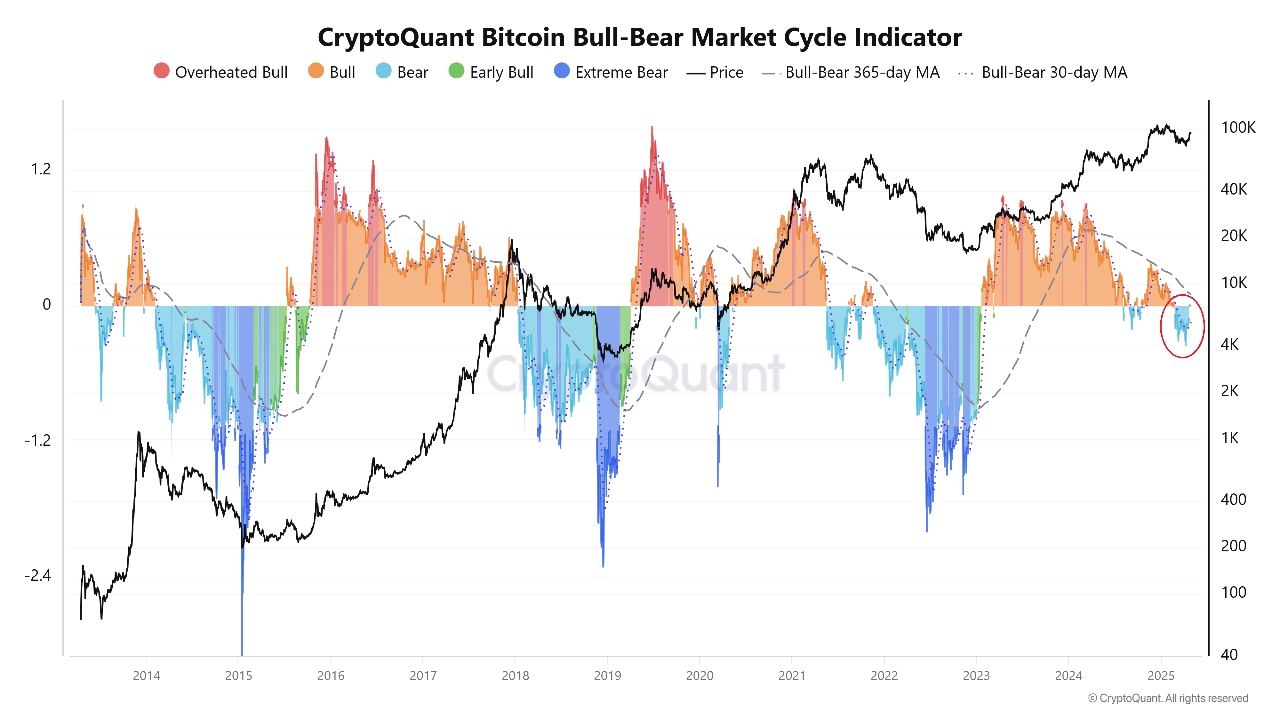
View original →My crypto market predictions made in February 2025 have materialized as anticipated, with Bitcoin firmly shifting into bearish territory over recent months. The CryptoQuant Bitcoin Bull-Bear Market Cycle Indicator, a crucial metric for gauging market sentiment and momentum, plunged to -0.2742 on April 10, 2025, confirming the cooling period I had forecasted.
However, the landscape has begun showing subtle but noteworthy changes in late April, as the indicator marginally crept into positive territory around April 20th with a reading of 0.0031. While technically above the zero threshold, this minimal positive value hardly constitutes a definitive trend reversal, instead suggesting a stabilization phase may be underway. The market appears to be establishing a sideways trading pattern characterized by diminished volatility and equilibrium between buying and selling pressures. This consolidation typically follows periods of directional movement and often precedes the next major market cycle shift. The barely positive reading indicates tentative bullish sentiment without strong conviction, as substantial directional shifts would typically require readings consistently above 0.1 or below -0.1. Trading volumes have remained relatively stable without the dramatic spikes characteristic of decisive market movements, while price action has settled into a narrower range compared to the volatile swings observed in February and March.
Traders should recognize these sideways movements as potential accumulation or distribution phases that precede more definitive directional moves. Long-term investors might consider dollar-cost averaging during this uncertainty, while short-term traders face challenging conditions with limited trending opportunities. Risk management remains crucial as false breakouts become increasingly common in such environments. The coming weeks will likely provide greater clarity on whether this slight positive shift represents a major change.

View original →

