Perhaps the most important question right now is whether this rise has created an inflection point for Bitcoin.
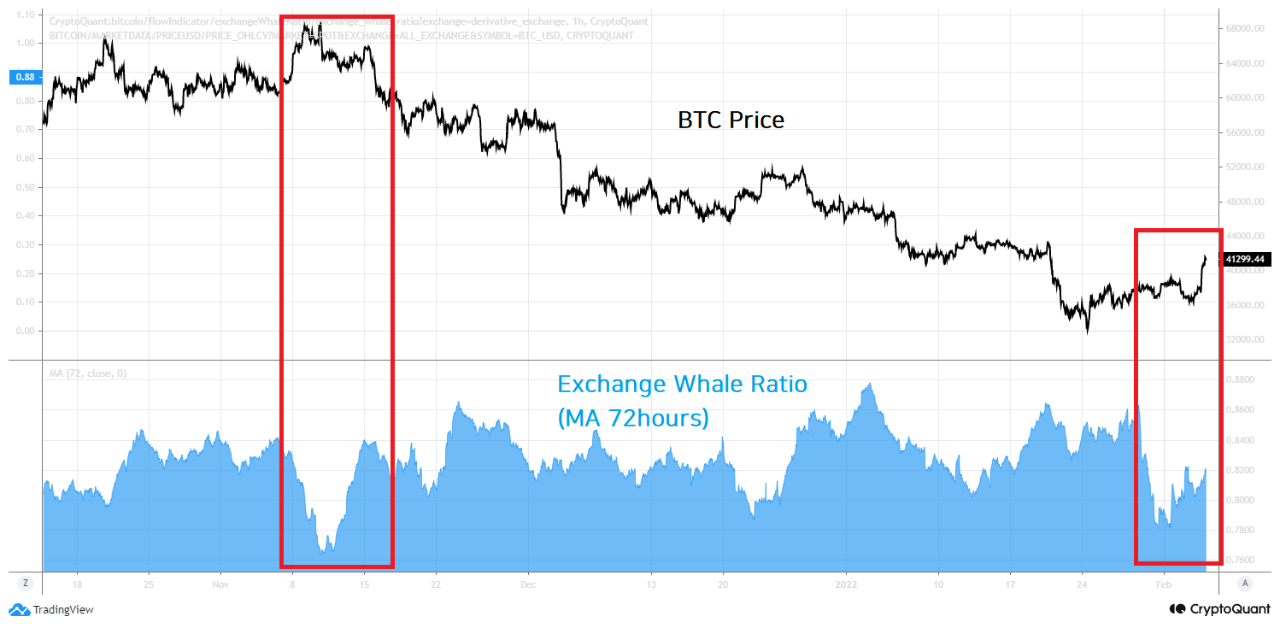
Fig 1) The reason for Exchange Whale Ratio(72h MA) valley tends to be an inflection point is that it could suggest an entity change of the leading whales. However, it's not enough to confirm inflection point.
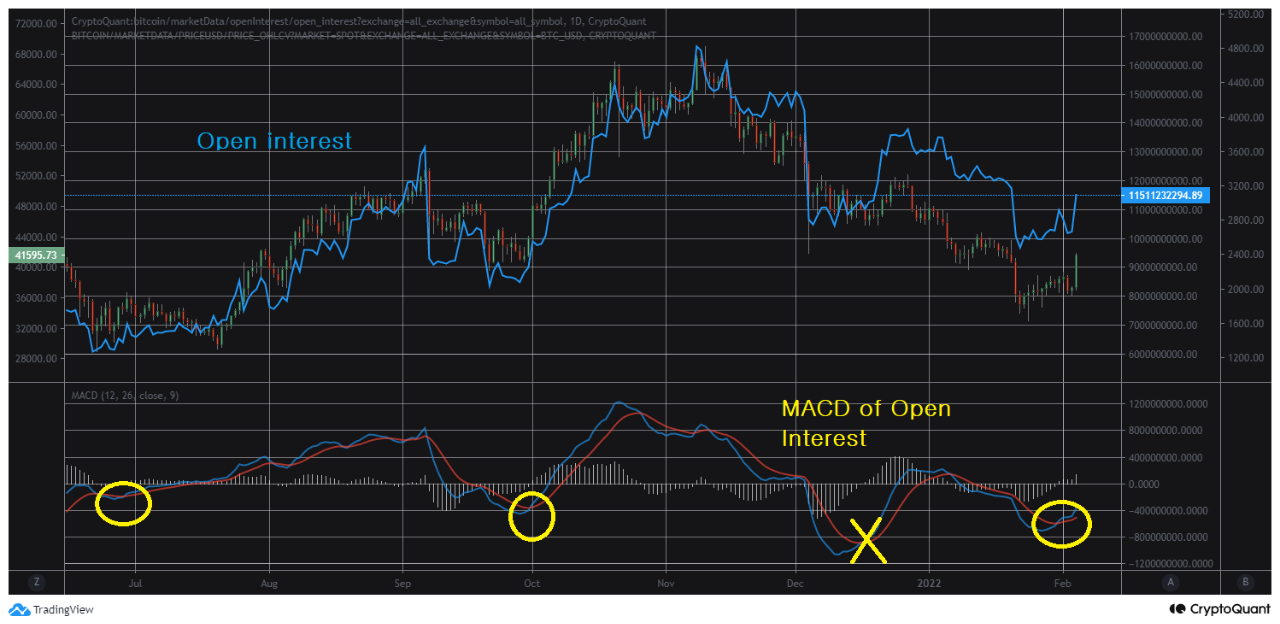
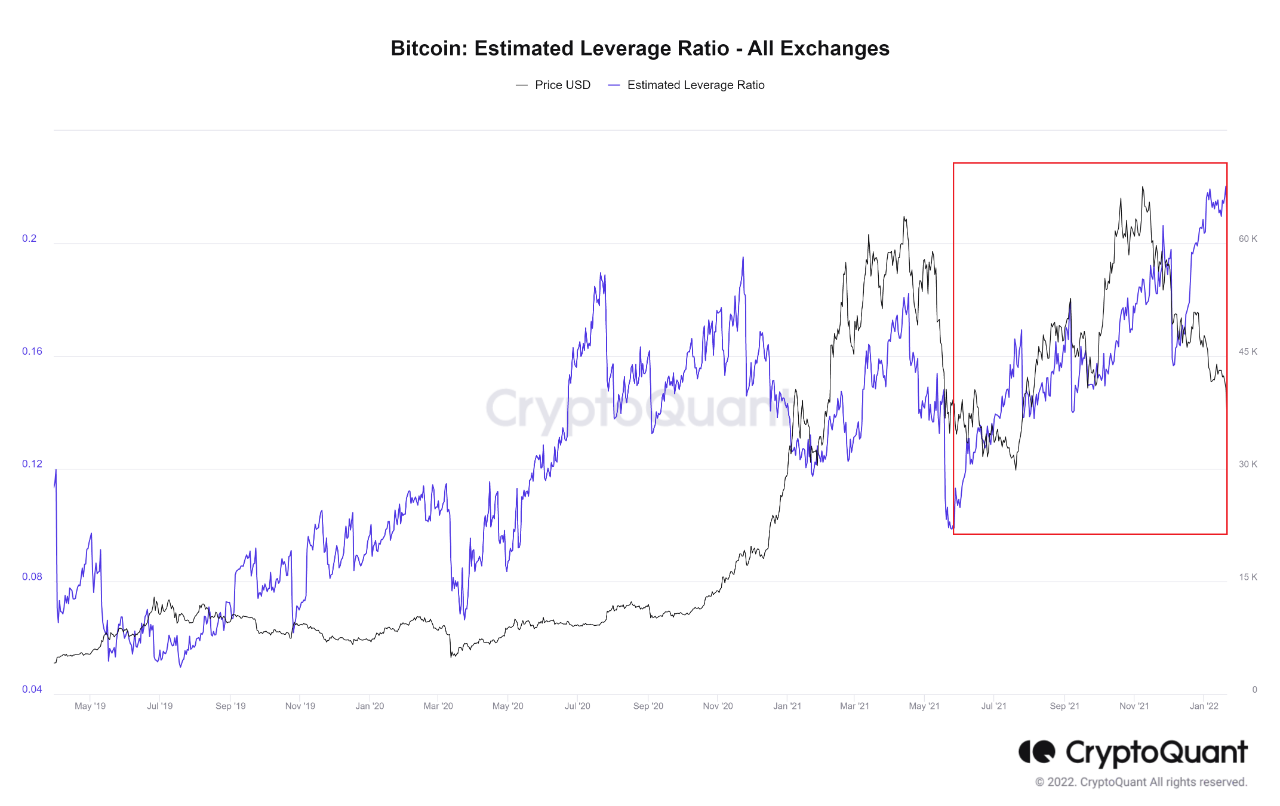
Fig 2) The increase of open interest is aligned with the level of interest in the market so OI tends to move similar direction to the price change, so predicting the bottom with the MACD golden cross was a good fit, before DEC 2021. However, this trend was broken in December, and the OI tends to increase continuously though decreasing reserve, which also increases the leverage rate, making it difficult to identify an inflection point through OI.
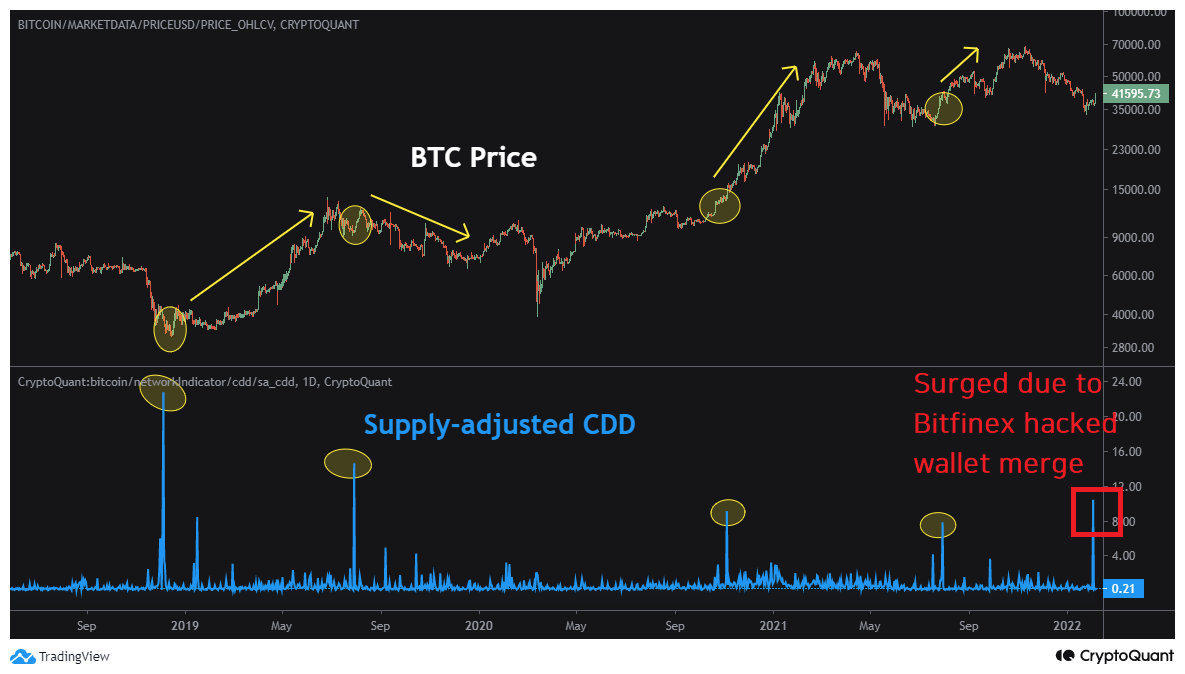
Fig 3) Surged CDD is also not a clue of inflection point. Because it is related to a special event.
Unlike in the past, on-chain indicators that can be viewed as inflection points provide uncertainty.

View original →Bearish(Nuanced)1/22/2022
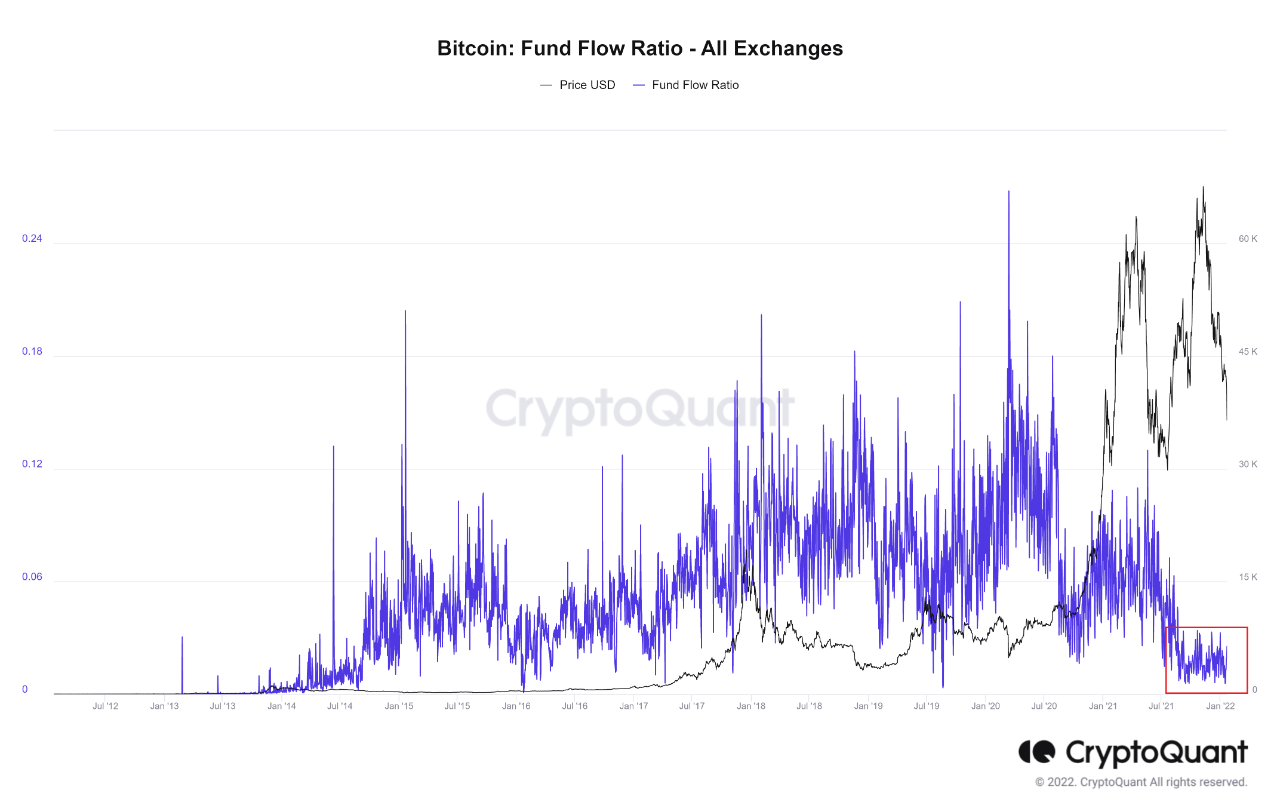
Fig 1) The current fund flow ratio is close to its lowest level since 2017. Exchange flows occupy only a small portion of the liquidity in the network, and it is difficult to understand the intention of the big hand rearrangement outside the market. It is also related to the insignificant impact of exchange in/outflows.
Fig 2) We cannot expect the high leverage of the market to decrease despite of price drop. Open interests remaining in the market is mainly handled by big and smart hands. Therefore, the usefulness of data other than exchange internal values is decreasing.
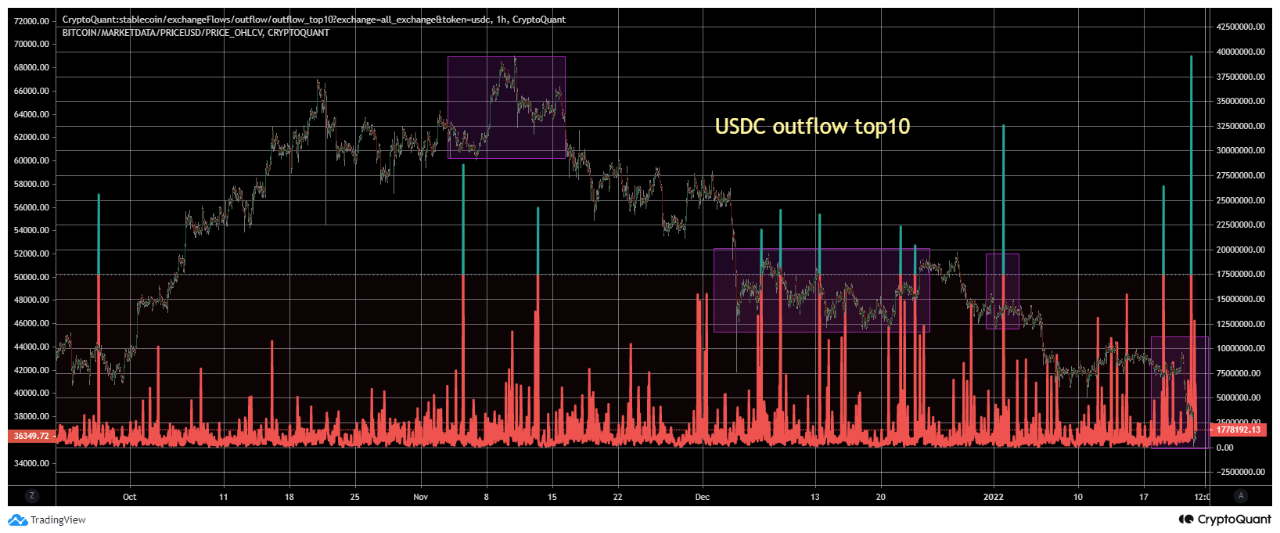
Fig 3) Among stablecoins, USDC's Top10 outflow appeared frequently with the decline of this cycle. Stablecoin Top10 outflow also appears significantly at the 'end of the decline', so it often implies an inflection point. But now continuous outflow high value is more related to the progress of the decline. So paying attention to this value to judge whether the decline continues or not can be an approach.

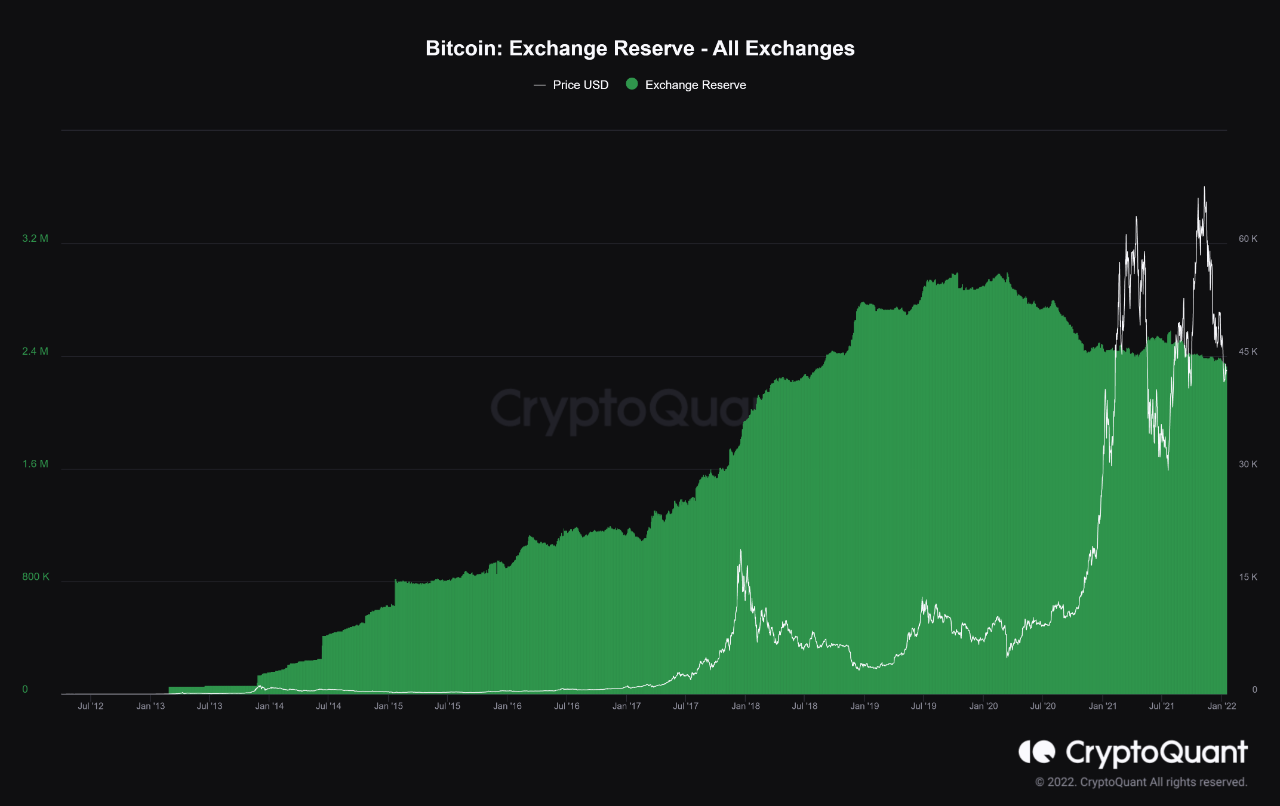
View original →In general, people think that whales are collecting BTC when the Exchange Reserve decreases and accept it as a bull market sign. Also when Exchange Inflow increases, whales come to sell BTC, and if it decreases after then, people would think that the decline has entered a lull.
However, compared to the past, such simple predictions are becoming more likely to be erroneous.
The yellow line in the first figure is the application of SMA 30days to the BTC Exchange Inflows. The amount of BTC inflows these days is even less than in 2016.
However, the current BTC Exchange Reserve is significantly higher than in 2016. A similar amount exists on the exchange as in mid-late 2018.
So, the current BTC inflow amount is less than in the past few years, but the Reserve is not that low. Therefore Inflow signals can be sufficiently diluted with whales' action done in the exchanges with existing reserves. We need to be careful to handle inflow signals, esp. free channel signals.


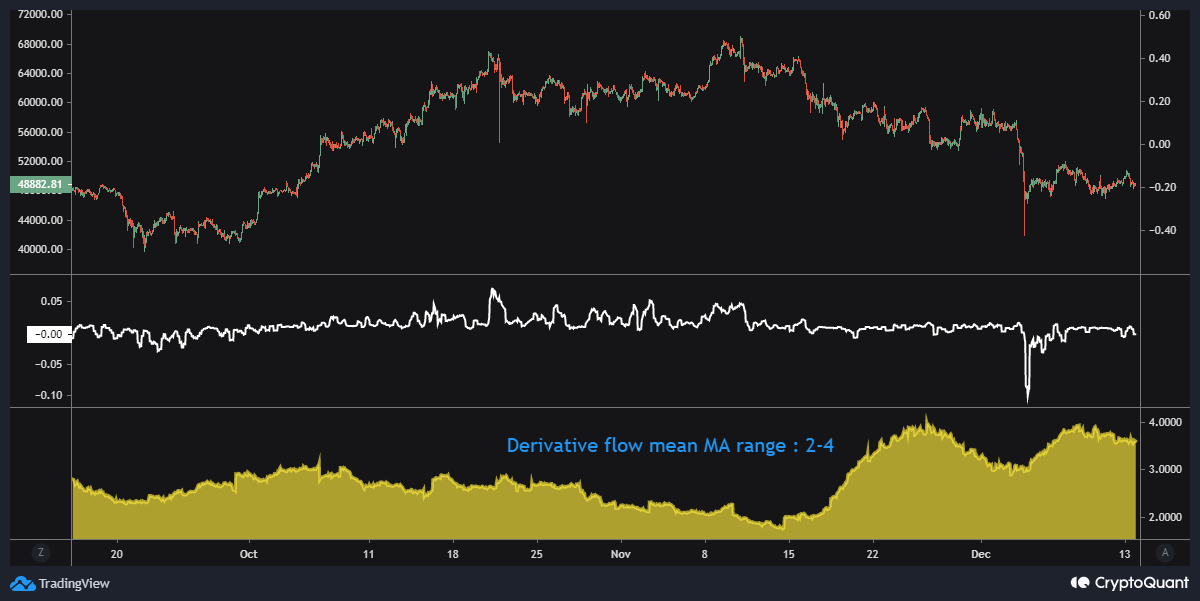
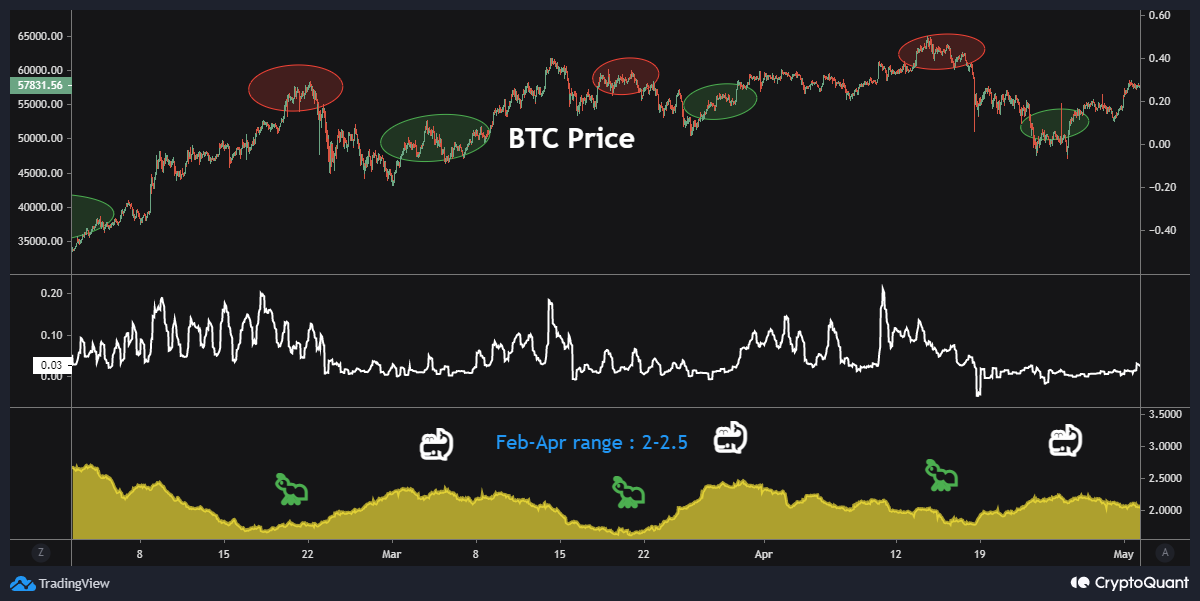
View original →Fig 1) The inflow mean from the all exchanges to the futures exchanges in late September - November is about 2-4 in the 168h MA value.
Fig 2) But if we look at the February-April value of the same graph, we can see the range of 2-2.5. In other words, the share of whales moving to the futures exchange during rapid market price fluctuations in September-December compared to February-April is higher. So current high leverage has a high proportion of smart money.
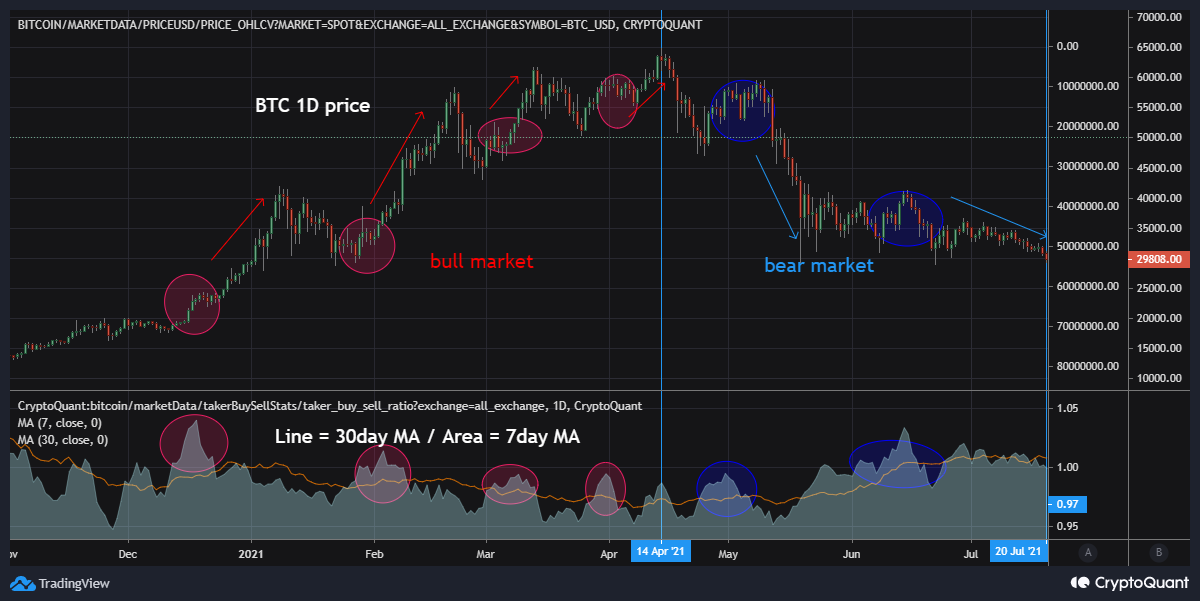
Fig 3) The 7-day area and 30-day line of the Futures taker buy-sell ratio are shown below. In the bull market, when the 7-day line rises above the 30-day line, the price rises as a result, and in the bear market, it falls.
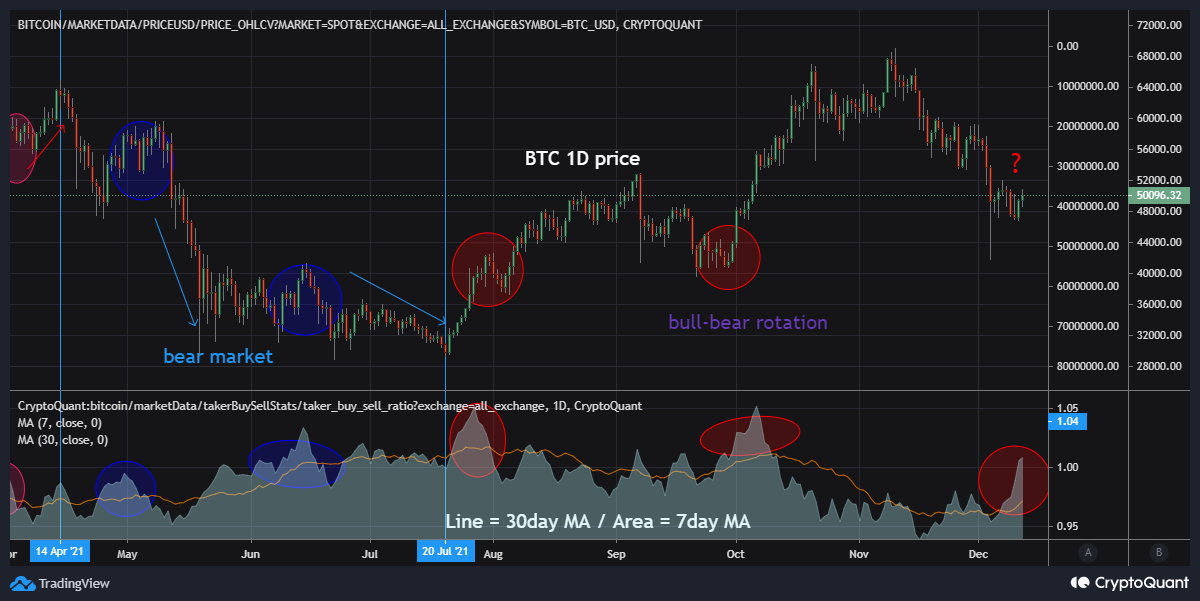
Fig 4) After mid July, I defined this as a bull-bear rotation market. After the 7-day line rises significantly above the 30-day line, the price rises, but when it rises slightly afterwards, the price declines. These significant rises appear at intervals of about 70 days. And now is the time!

View original →Bearish(Nuanced)BTC
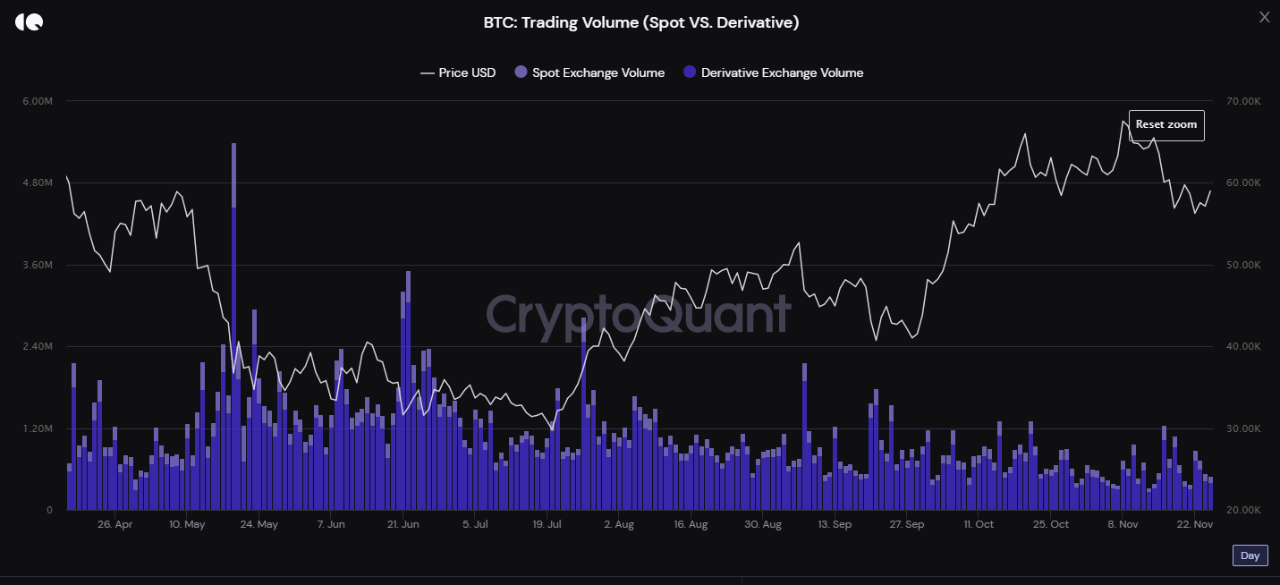
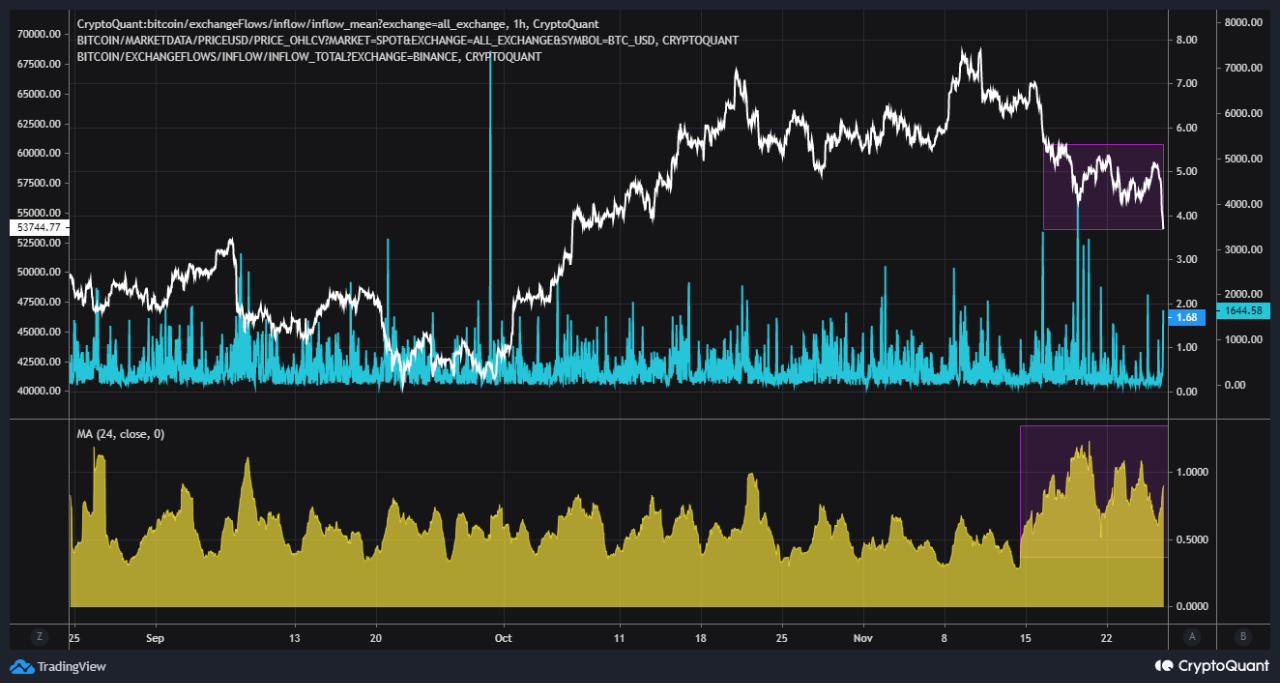
11/26/2021 Bitcoin fell sharply without a large trading volume and large liquidation volume. In fact, there is not much good data to explain why decline was large today. All I can say is that Inflow Mean these days has been significantly larger than several months. This can be checked by 72h MA below(second pic). Although the total amount of deposit is not large, those who deposit a large amount densely occupy a large proportion. While the market is generally quiet, a few large hands shake the market. In this case, it is difficult to talk about how far up or down it will go. Patience is needed to wait for the reversal of the atmosphere. If the Inflow Mean and Exchange Whale Ratio stabilize, the mood could be reversed.

View original →Bearish(Nuanced)BTC
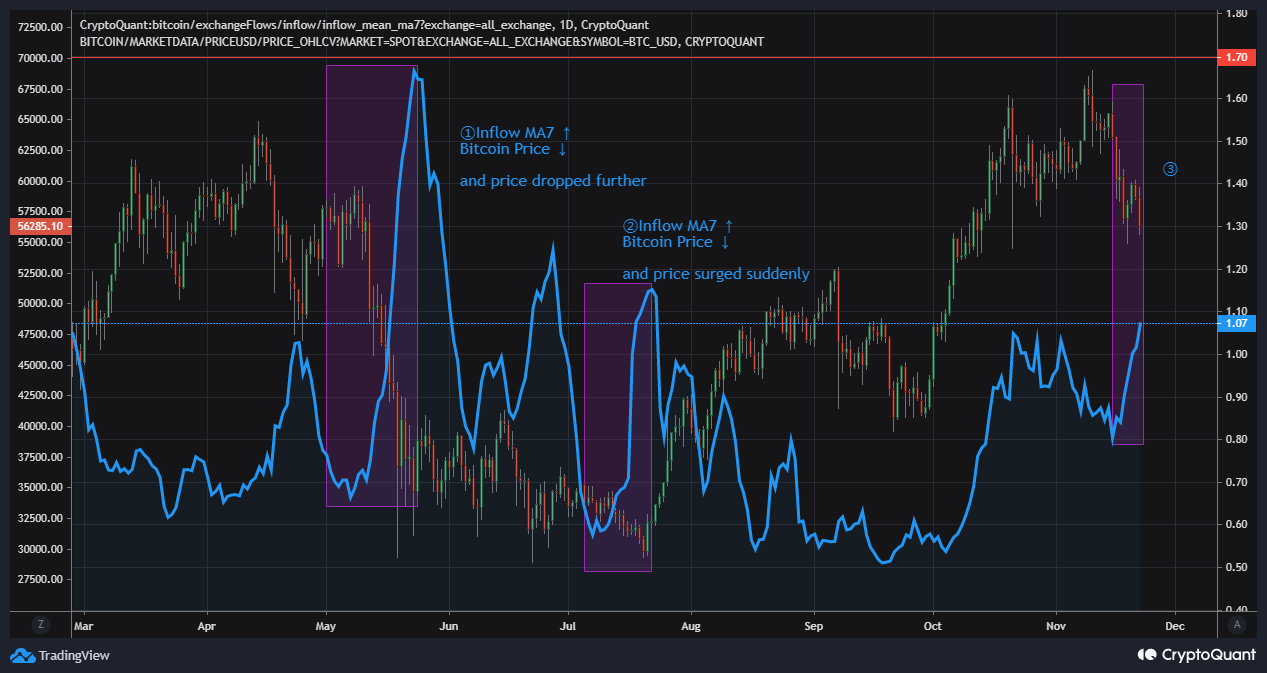
11/23/2021 Fig 1) The surge in 1D inflow MA7 often occurs during market turmoil, and esp the sharp rise that occurs when the price falls is considered as an indicator of whales' anxiety. It can happen both when the decline continues, like in May, and when it rebounds, like in July. Currently it's in an ambiguous section.
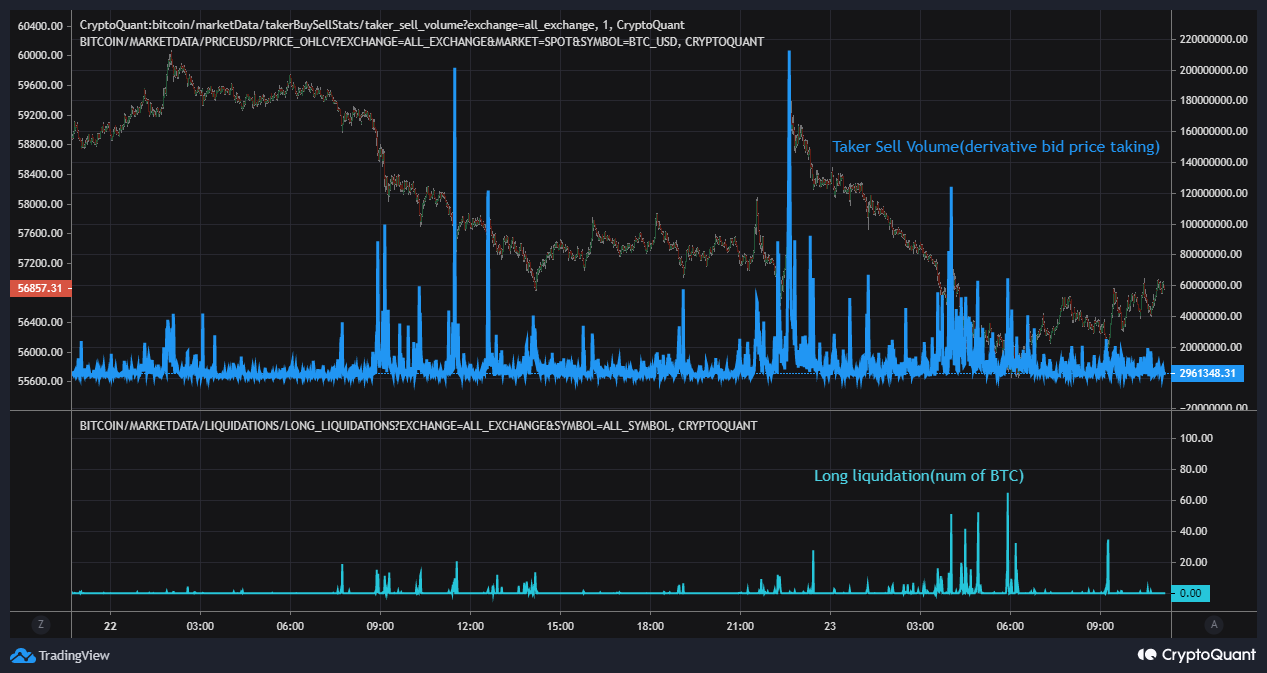
Fig 2) Conservatively, it is better to prepare for the possibility of further declines. There was still no critical point in futures 1min sell volume or long liquidations.

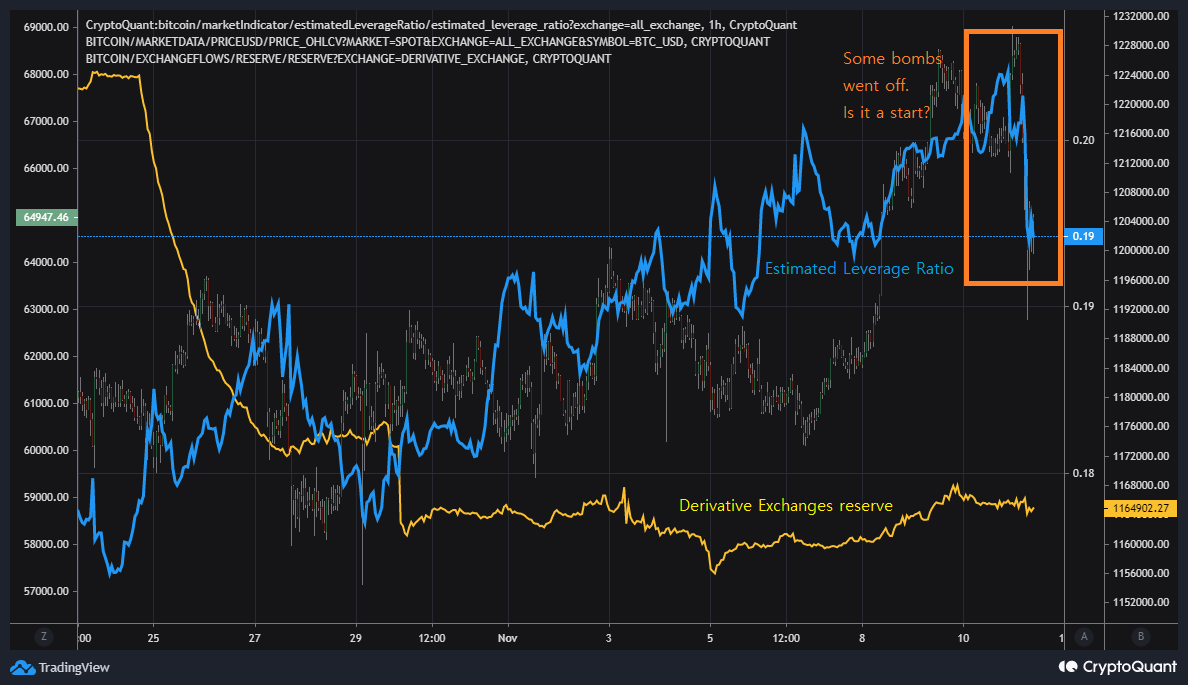
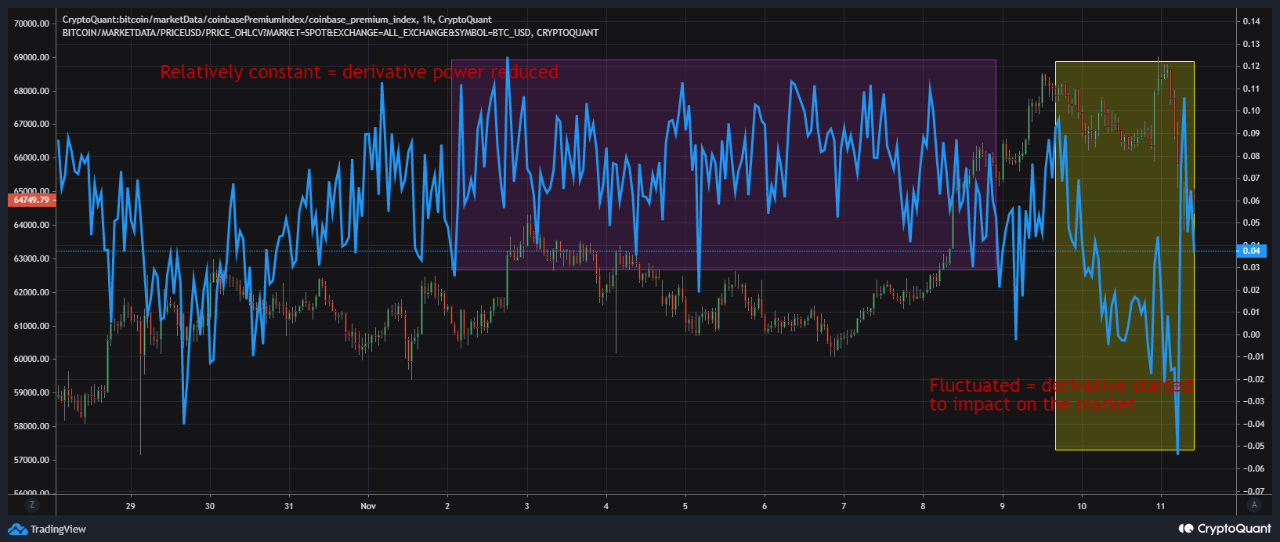
View original →Fig 1) Bitcoin rose sharply with too high leverage, so it looked like a 'climbing with bomb' situation. That leverage suddenly started to break with Evergrande issue. If the price go down further, attempts may be made to liquidate high-lev longs, so caution is required.
Fig 2) Coinbase Premium is relatively stable in markets when spot-driven market, but fluctuates in markets where futures have a large impact. This might be a starting point that futures lead the price movement again.

View original →Bearish(Nuanced)BTC
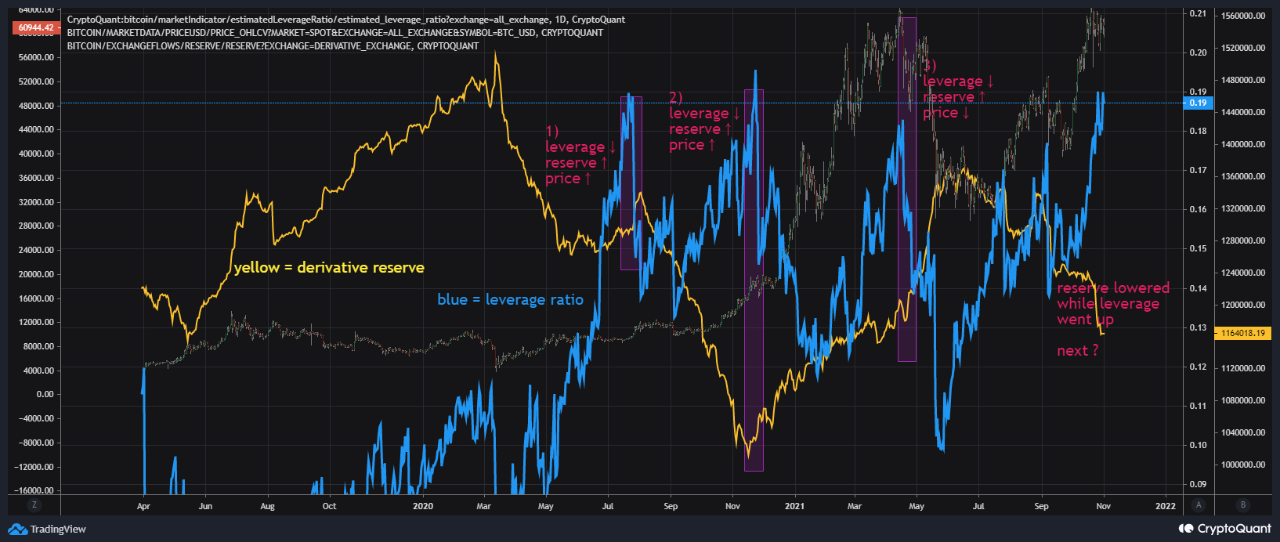
11/2/2021 As can be seen from the figure, Jul 2020, Nov 2020, Apr 2021 and now are all high leverage situations, but not the same situation. When the reserve increases, the denominator of the leverage ratio formula increases, so the value tends to decrease. But now, as reserve decreases, leverage increases. Reserve becomes more and more futures-intensive. A high volatility market is expected, aiming for a large liquidation. The long accumulation is severe now, so be careful.

View original →Bearish(Nuanced)BTC
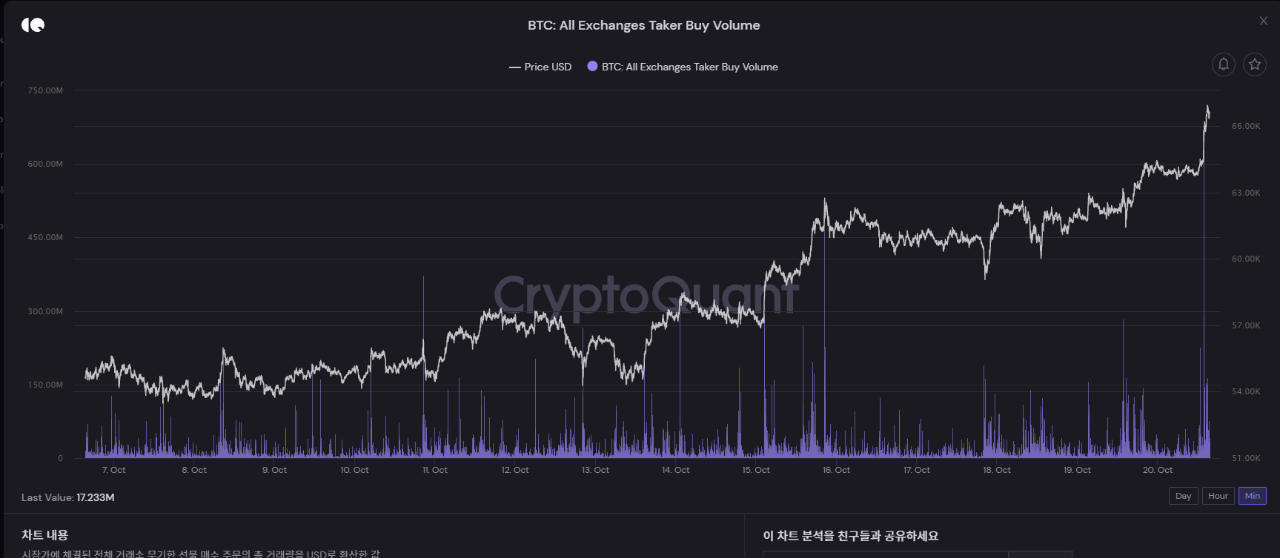
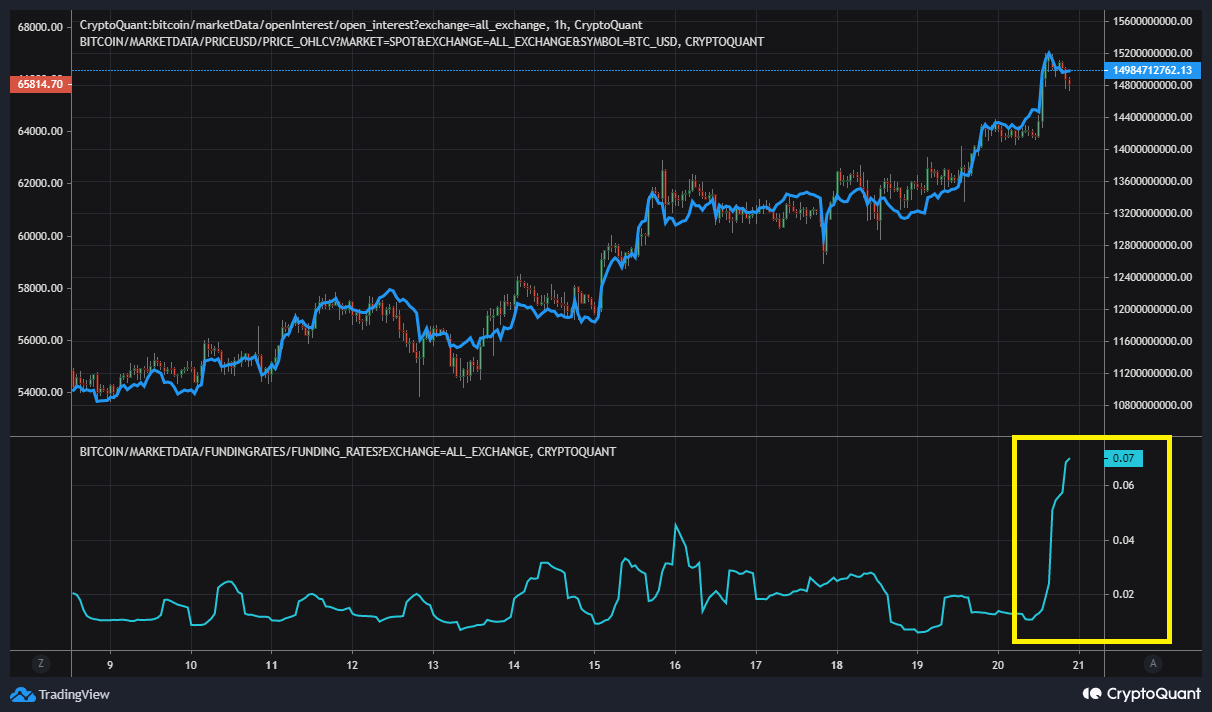
10/20/2021 At the beginning of the big uptrend at 13:40~14:50 on Oct 20 UTC, it was seen that the taker buy volume that occurs is about 0.6B$. It is difficult to see such a large Taker buy volume, not seen in the Dec 2020 ~ Apr 2021 also. The current bull market is different from the end of 2020. Bitcoin price moved as a way to use the stored power in one shot. In this rise, the Bitcoin funding rate has also risen significantly, so there is a possibility that the big rise will stop in the short term.

View original →Bearish(Nuanced)ETH
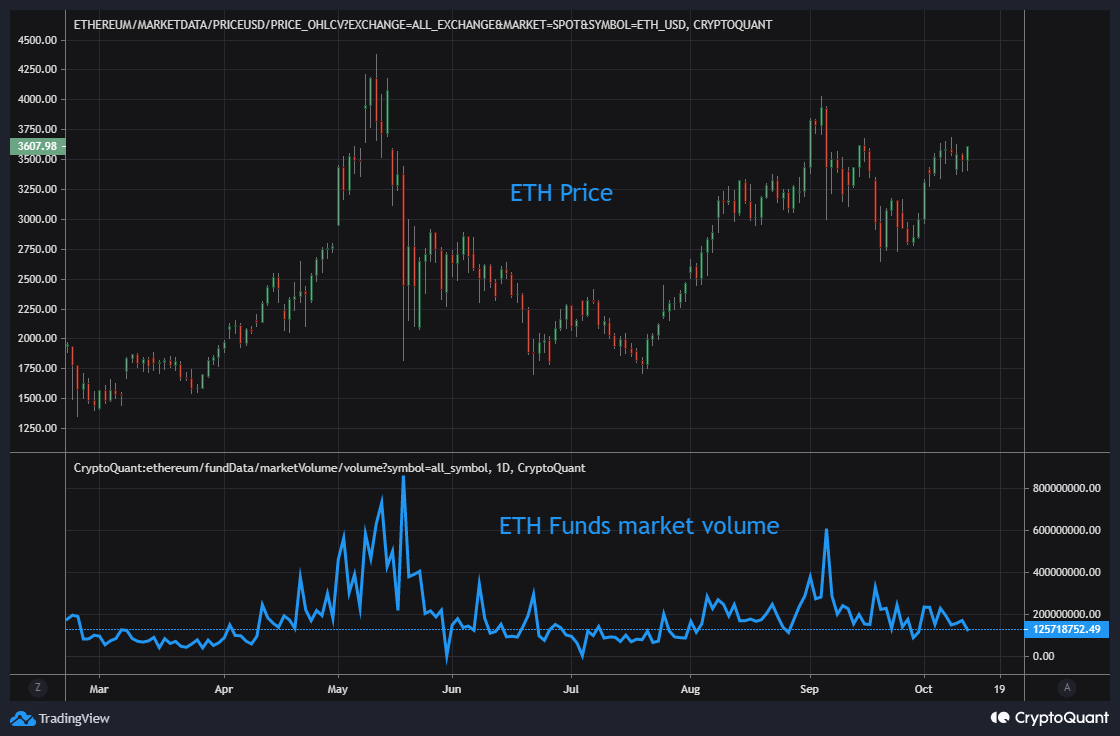
10/14/2021 Fig 1) ETH prices have peaked this year when the market volume of ETH Funds(entry for institutional and investors) has risen. As there is currently no such movement, I think the long-term price outlook for ETH is good.
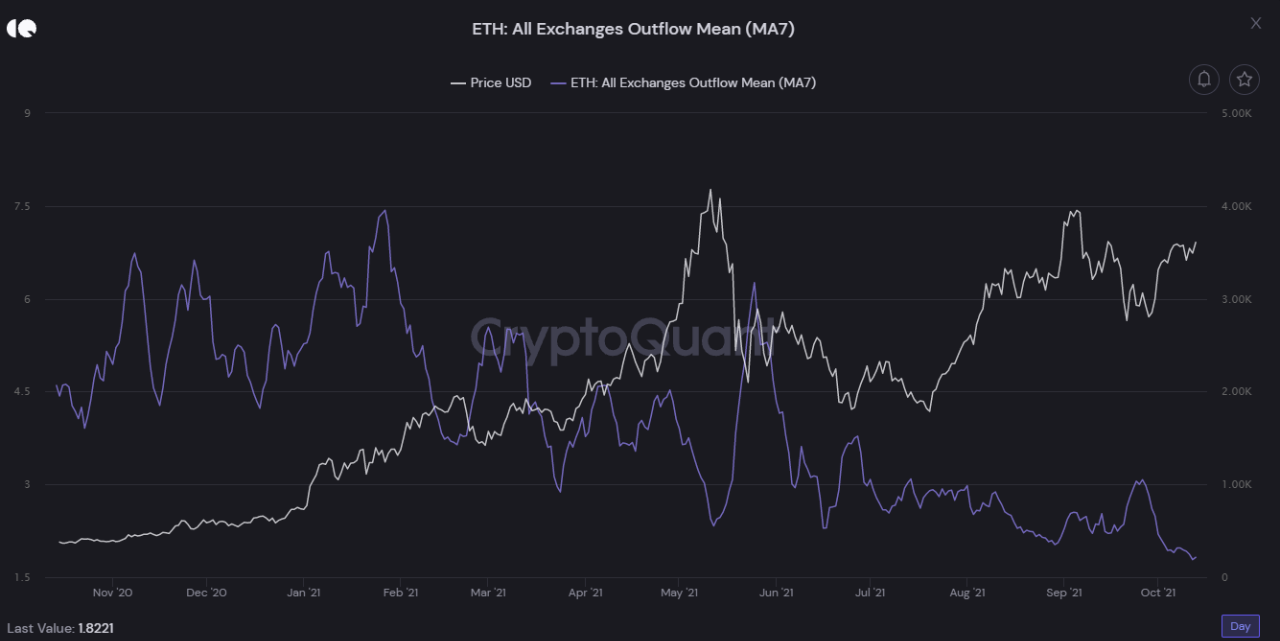
Fig 2) However, boring ETH Outflow MA7 on the exchange lowers the chances of a big upside shortly.
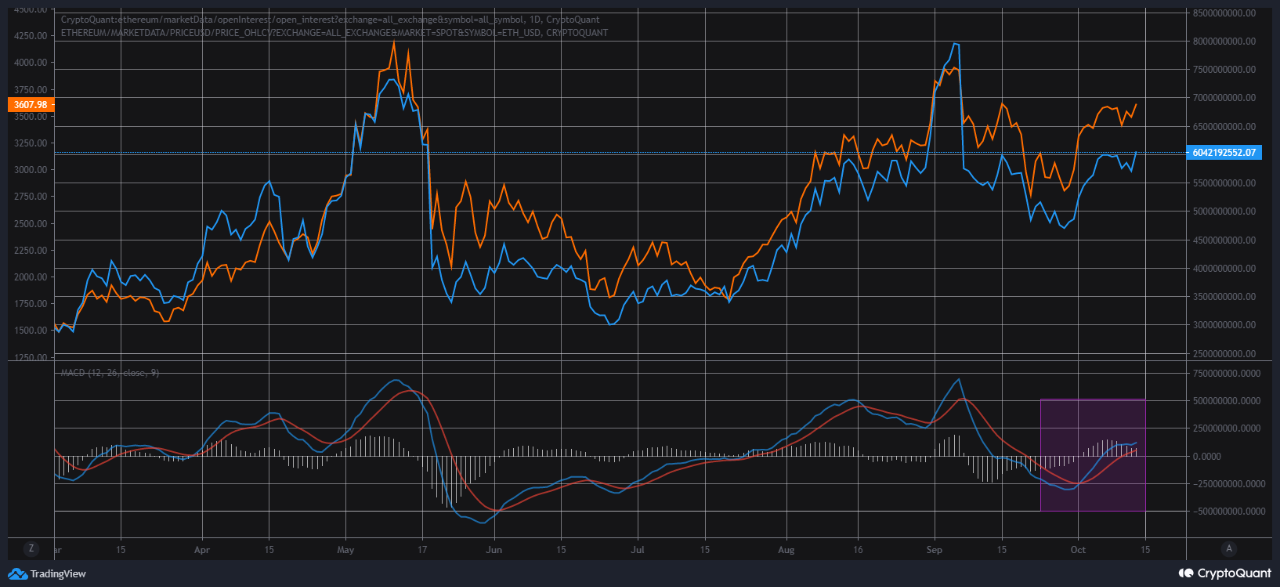
Fig 3) Applying the KOSTAS OI to ETH and looking at the open interest MACD value, the moving average gap goes to close. It is unfavorable to say that it is ahead of a big rise.

View original →

