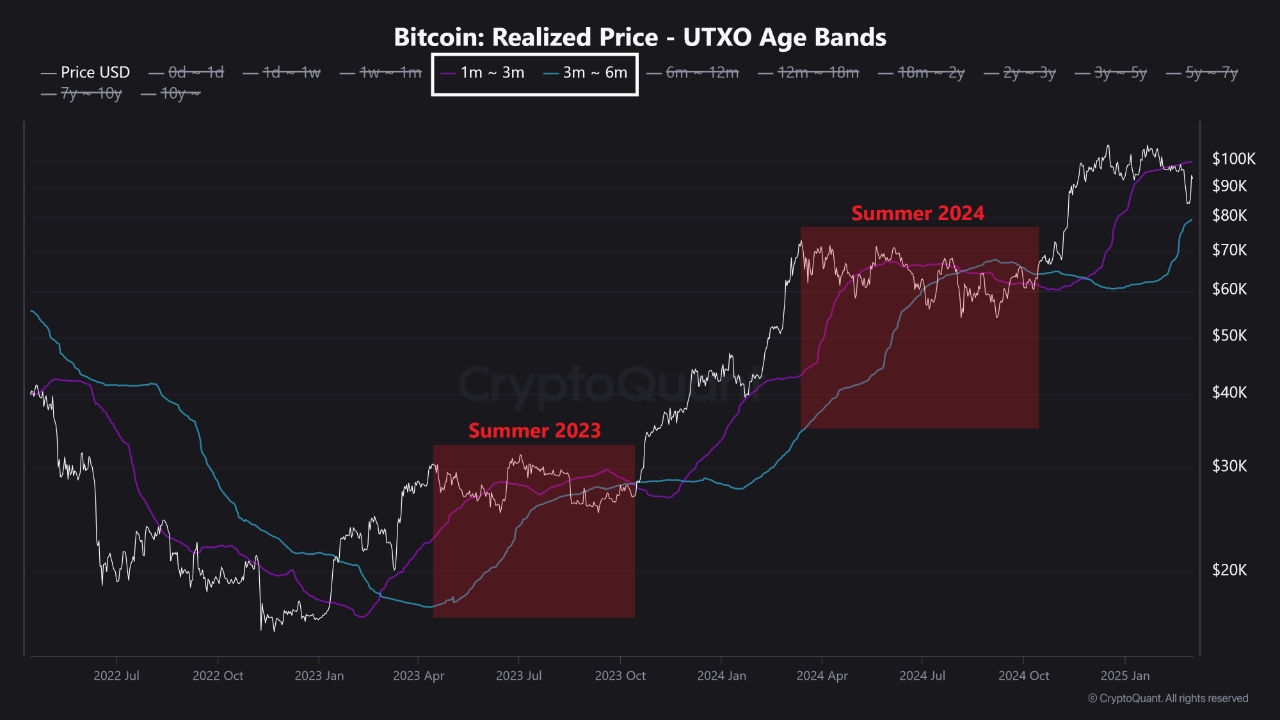
Bitcoin is currently shaping its third corrective pattern within its ongoing bullish cycle that began in early 2023, as indicated by the UTXO Age Bands for the 1-3 month and 3-6 month bands.
During the summers of 2023 and 2024, Bitcoin entered multi-month corrective phases, each lasting approximately six months. Throughout these periods, the 3-6 month band trended upwards, closing the gap with the 1-3 month band. This movement historically acted as a resistance zone, where Bitcoin initially faced rejection before breaking through and igniting its next bullish rally.
If history repeats itself, the current correction could persist for another 2 to 3 months, with BTC ranging between $80K and $100K. In this scenario, a decisive breakout above $100K could mark the end of the corrective phase, potentially paving the way for a rally toward $130K.
Market participants should closely watch the structural dynamics of the premium bands, as a confirmed break above resistance could signal the next parabolic leg of Bitcoin’s bull market.

View original →Bullish(Nuanced)BTC
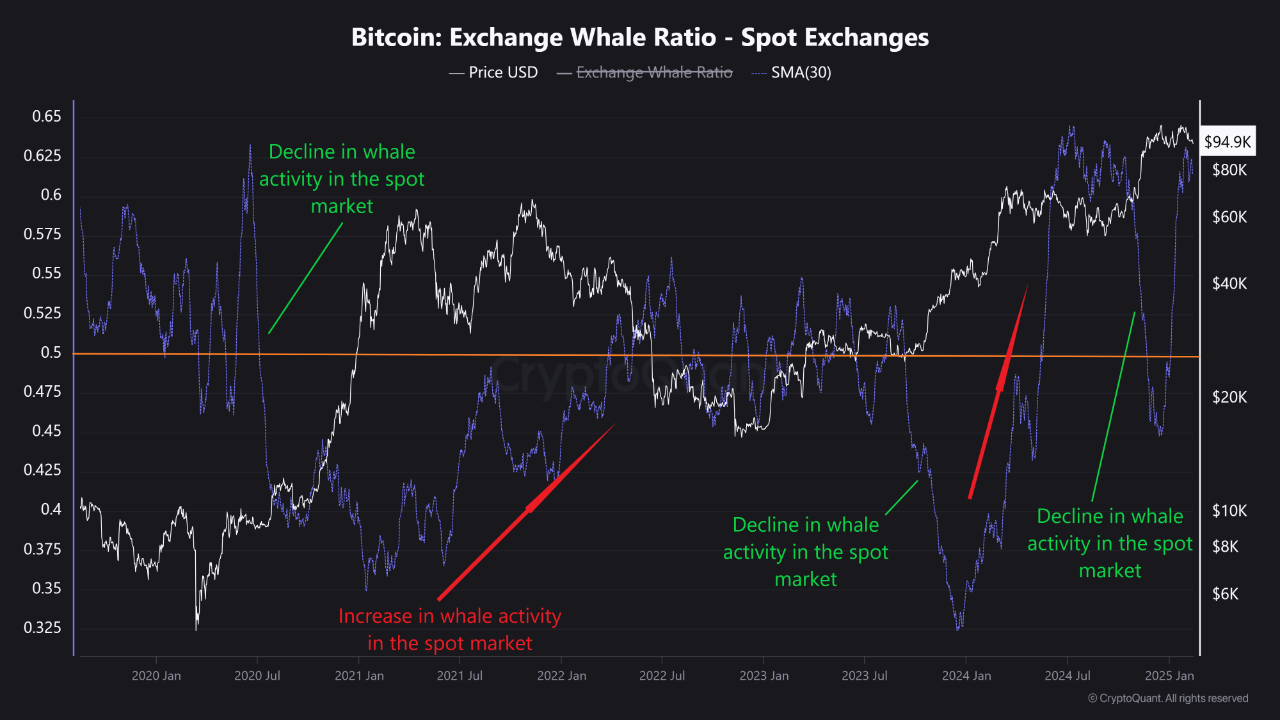
2/12/2025 The Exchange Whale Ratio—calculated by dividing the top 10 inflows to spot exchanges by total inflows—is currently at a multi-year high. Since late 2024, this metric has experienced a robust upward surge, though its momentum has slightly moderated over the past two weeks without a definitive reversal.
Historical trends indicate that a downturn in whale deposits on spot exchanges often precedes a bullish Bitcoin rally. Given the substantial influence these market participants exert on Bitcoin’s price dynamics, market observers are closely watching to see if they will reduce their asset inflows to exchanges. Should this metric reverse its current trajectory, it may signal the onset of a broader market recovery.

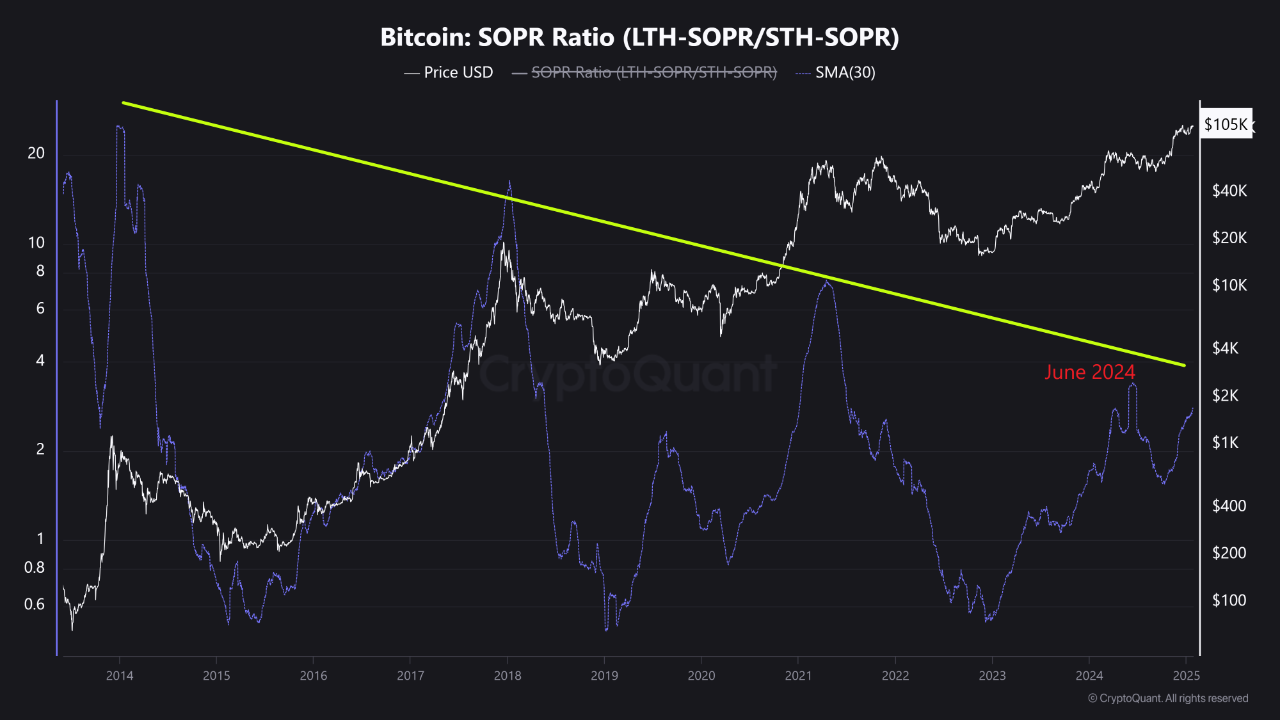
View original →In previous Bitcoin bullruns, the SOPR Ratio (LTH SOPR/STH SOPR) saw a significant increase alongside the parabolic rise in prices. However, why has this metric seen much slower growth in the current bullrun, even when the cryptocurrency is trading above $100,000, yet remains lower than it was in June 2024?
To answer this question, we must revisit the definition of this metirc. According to CryptoQuant, Higher value of the ratio means higher spent profit of LTH over STH
As more cycles occur in the market, Bitcoin matures, and investors tend to distance themselves from speculative activities. It could be said that they develop a deeper understanding of Bitcoin's value. On the other hand, the entry of institutional players has shifted the dynamics. In fact, the flow of capital to exchanges has decreased, as Bitcoin investors are now adding it to their portfolios as a valuable asset and are unlikely to sell anytime soon.
Given these conditions, the scenario strengthens that we will face new cycles of Bitcoin. In these new cycles, speculative activities will decrease, and Bitcoin will be held as a valuable asset for much longer.

View original →Bearish(Nuanced)BTC
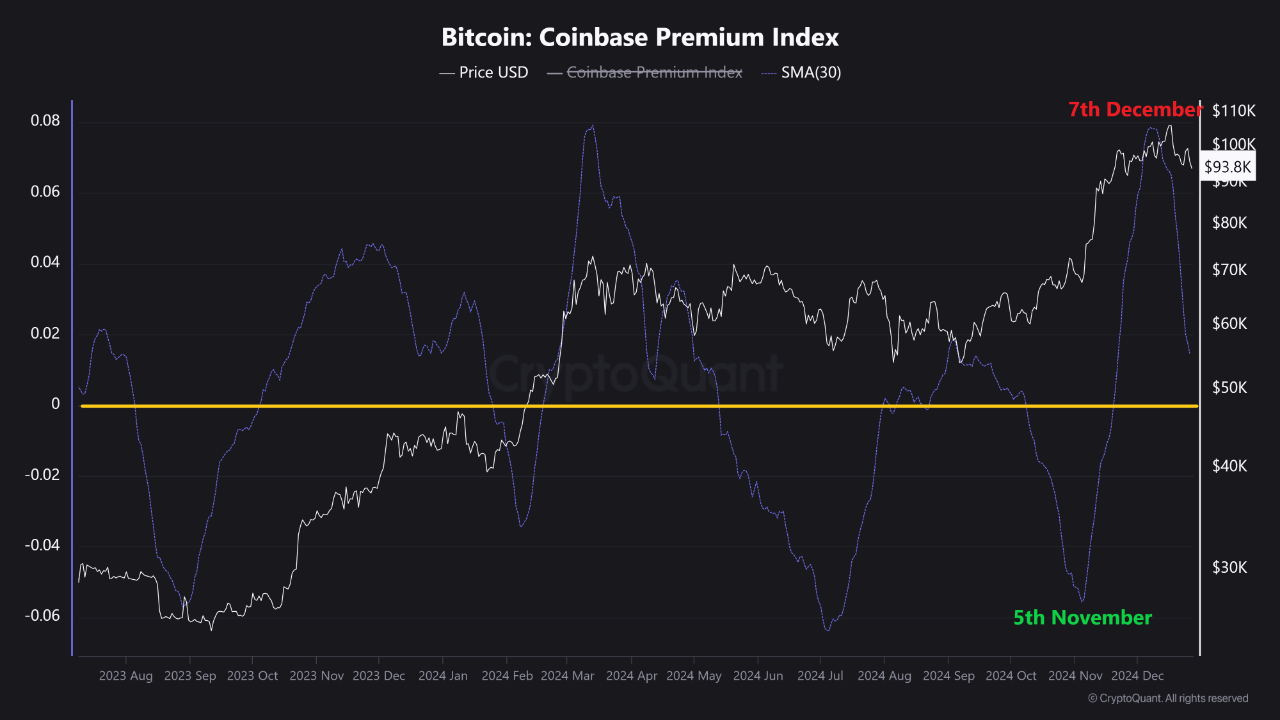
12/27/2024 After Trump's election win on November 5, Bitcoin's price surged past $100,000, supported by a rising Coinbase Premium Index, which measures The pertcent difference between Coinbase Pro price (USD pair) and Binance price(USDT pair). This increase indicated strong demand from U.S. investors.
However, since December 7, the Coinbase Premium Index has been on a decline, coinciding with a drop in Bitcoin’s price to below $94,000. This shift is likely influenced by a combination of factors, including the seasonal effects of the Christmas holidays, where trading activity tends to slow down, and liquidity challenges in the market. Reduced market participation during the holiday season, alongside limited cash flow, has likely contributed to the price decline.

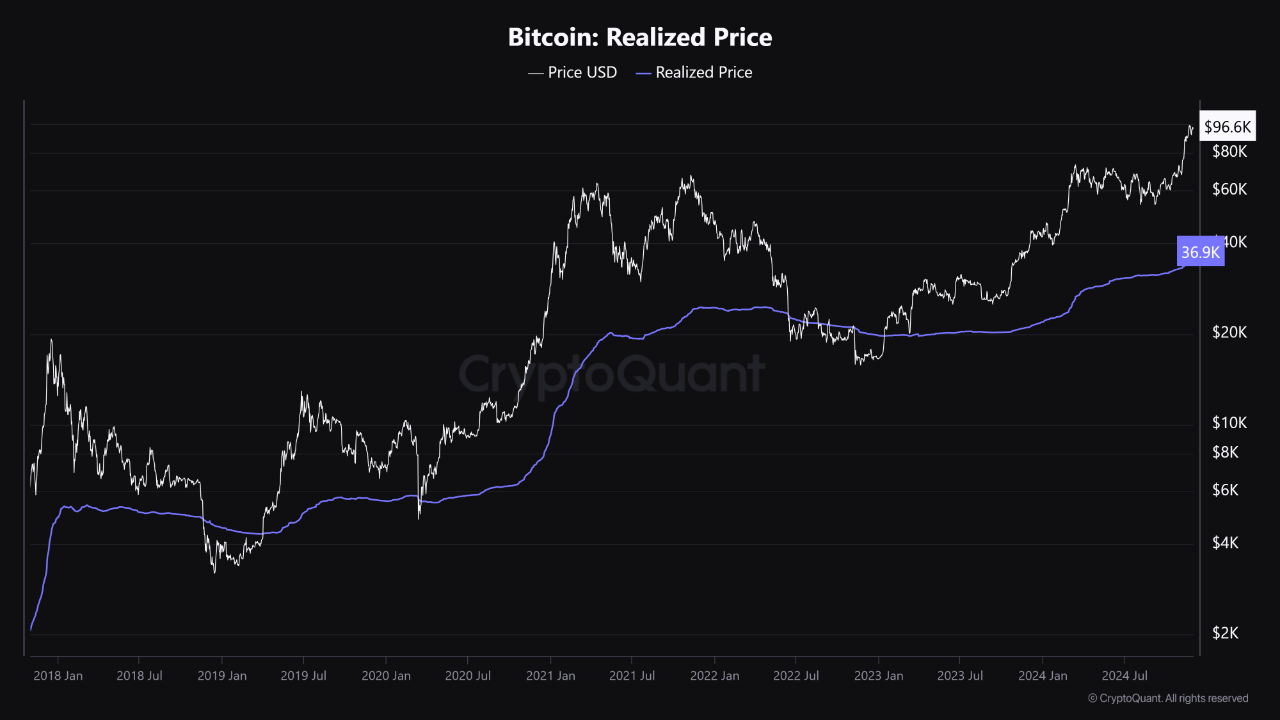
View original →Bitcoin’s price has surged from ~$60,000 to ~$100,000 in recent months, pushing the Realized Price from ~$31,000–$32,000 to ~$37,000. This gradual increase highlights several key insights:
1- Capital Inflows: Higher Realized Price reflects new participants entering the market at elevated levels, signaling growing confidence in Bitcoin.
2- Stronger Cost Basis: The rising average acquisition cost strengthens market support during corrections.
3- Reduced Selling Pressure: Long-term holders appear to be holding, reducing sell-side liquidity.
While the widening gap between Market Price and Realized Price might signal short-term overheating, history shows that similar gaps occurred during previous bull runs without halting price growth.
The gradual rise in Realized Price reflects stronger cost basis and sustained confidence, but cautious monitoring is advised to gauge the sustainability of this rally.

View original →Bearish(Nuanced)XRP
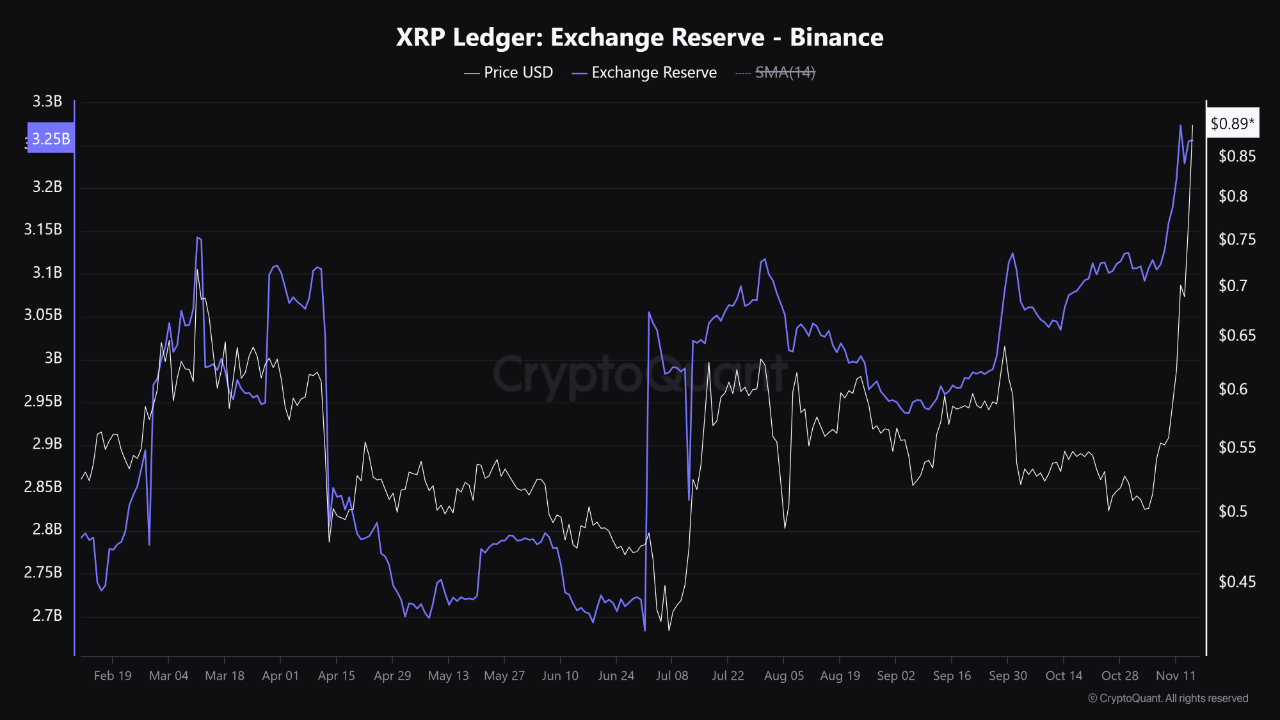
11/16/2024 Ripple (XRP) has successfully broken the $1 barrier for the first time in three years, propelling it to the 6th position among the top 10 cryptocurrencies by market capitalization, surpassing Dogecoin.
Simultaneously, with Ripple's price surge, the exchange reserve (Binance) has reached an all-time high of over 3.255 billion coins. Historically, an increase in exchange reserve has often been associated with higher selling pressure. Therefore, investors should remain cautious at these levels, as profit-taking might occur.

View original →Bullish(Nuanced)BTC
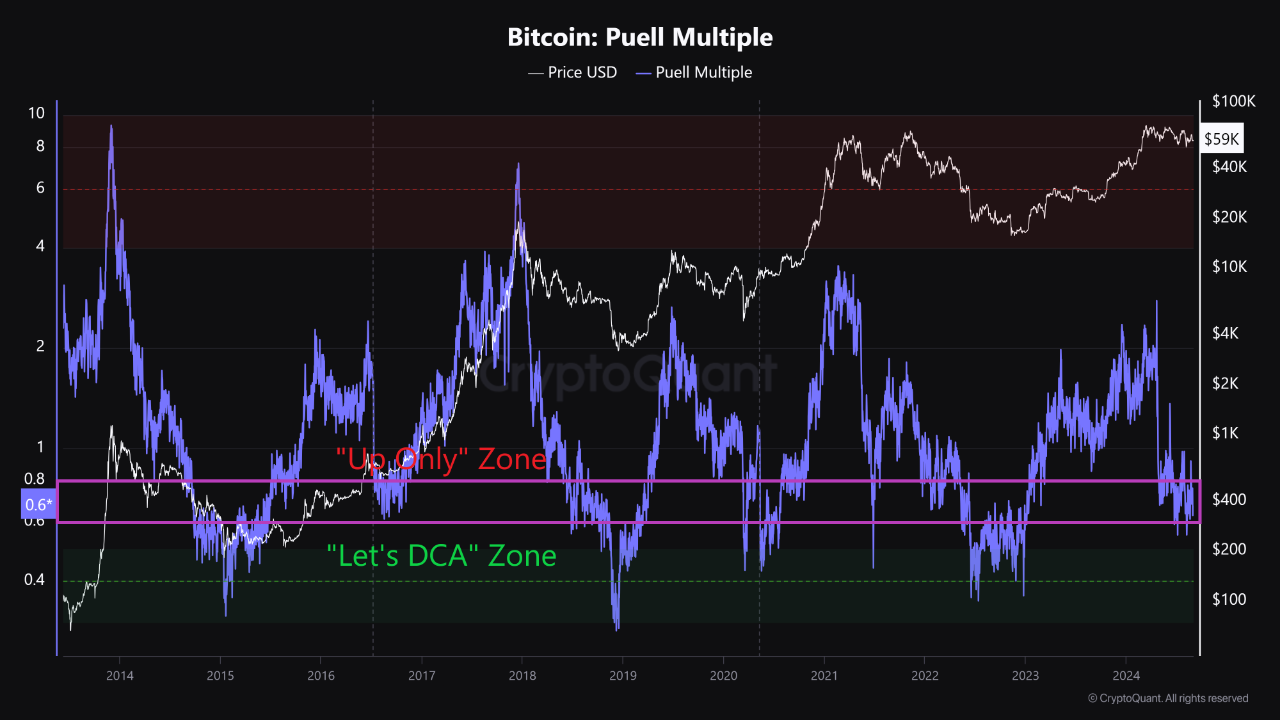
8/31/2024 Historical data indicates that the range between 0.6 and 0.8 on the Puell Multiple index can be characterized as a "Decision Zone." Analysis of the last decade's trends reveals that when the index falls below the 0.6 threshold, it often represents an ideal opportunity for Dollar-Cost Averaging (DCA) strategies. Conversely, a breakout above the 0.8 level has historically been associated with bullish market behavior, frequently propelling the price towards new all-time highs (ATH).
At present, the Puell Multiple index is fluctuating between these two critical levels. If historical patterns hold, a bearish scenario where the index drops below 0.6 could once again signal a favorable buying opportunity for investors.

View original →Bearish(Nuanced)8/15/2024
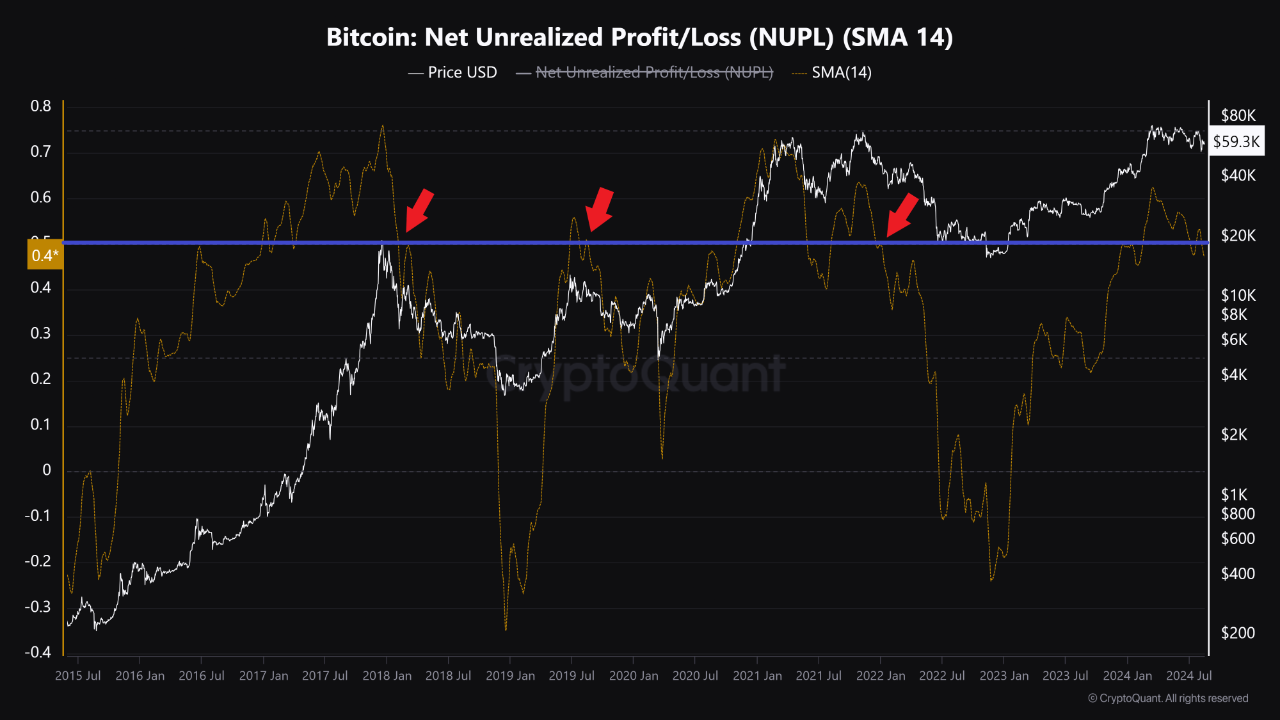
The NUPL metric is currently positioned near a critical level. Historically, the 0.4 level has served as a significant point of support and resistance.
Data shows that a breach below this level often marks the onset of a substantial downward trend. If the index continues its downward movement, it’s reasonable to anticipate that the bears could take full control of the market. In such a scenario, the price could drop to around $40,000.
However, it’s important to note that the current decline has not yet reached a severity that would definitively indicate the end of the upward trend.

View original →Bearish(Nuanced)BTC
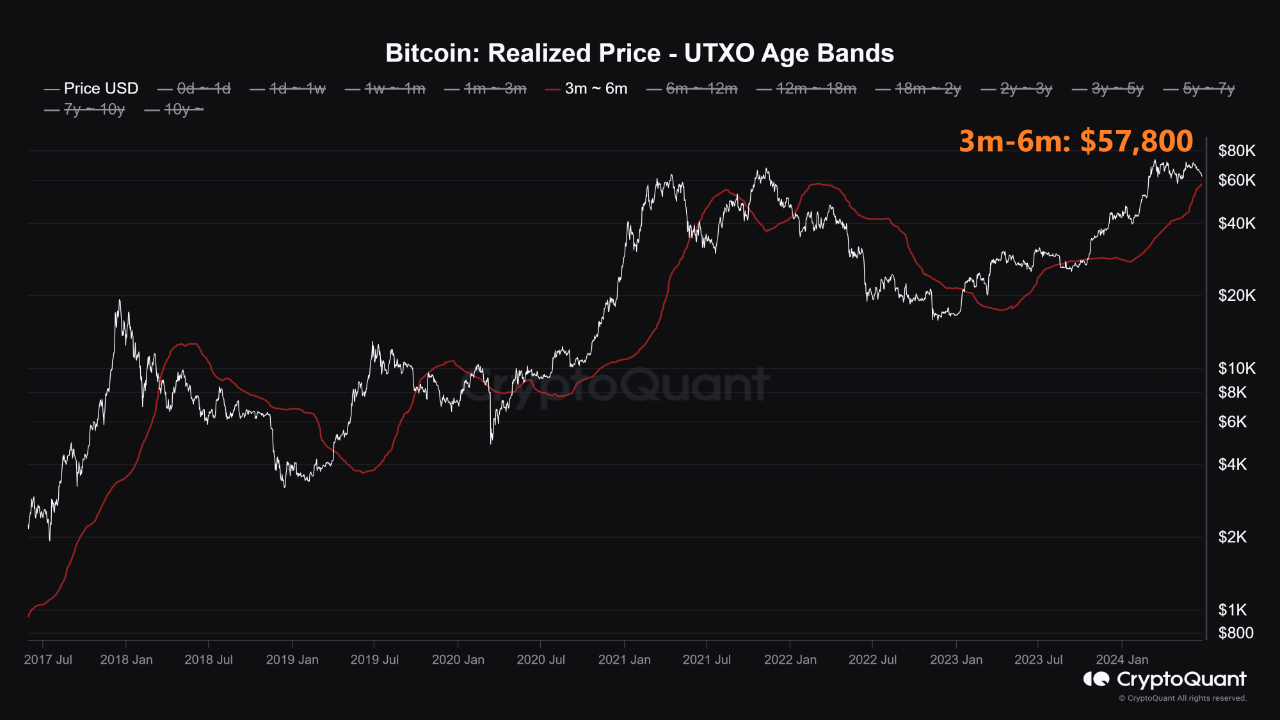
6/24/2024 One of the most significant on-chain metrics for analyzing the behavior of short-term holders, who predominantly act as speculators, is the Realized Price-UTXO Age Bands. Historically, this metric has effectively served as support and resistance within the market. When combined with technical levels, it provides more robust insights.
Currently, the price of Bitcoin has fallen below this metric. By incorporating the static technical support level around $60,000 into our analysis, it becomes evident that Bitcoin still has potential for further correction. Furthermore, the 3-month to 6-month band is nearing this technical support level, potentially reinforcing its strength, similar to the behavior observed in September.
At present, the correction appears to be healthy. However, should bearish momentum persist, the subsequent substantial support level is anticipated to be around $50,000.


View original →Bearish2/5/2024
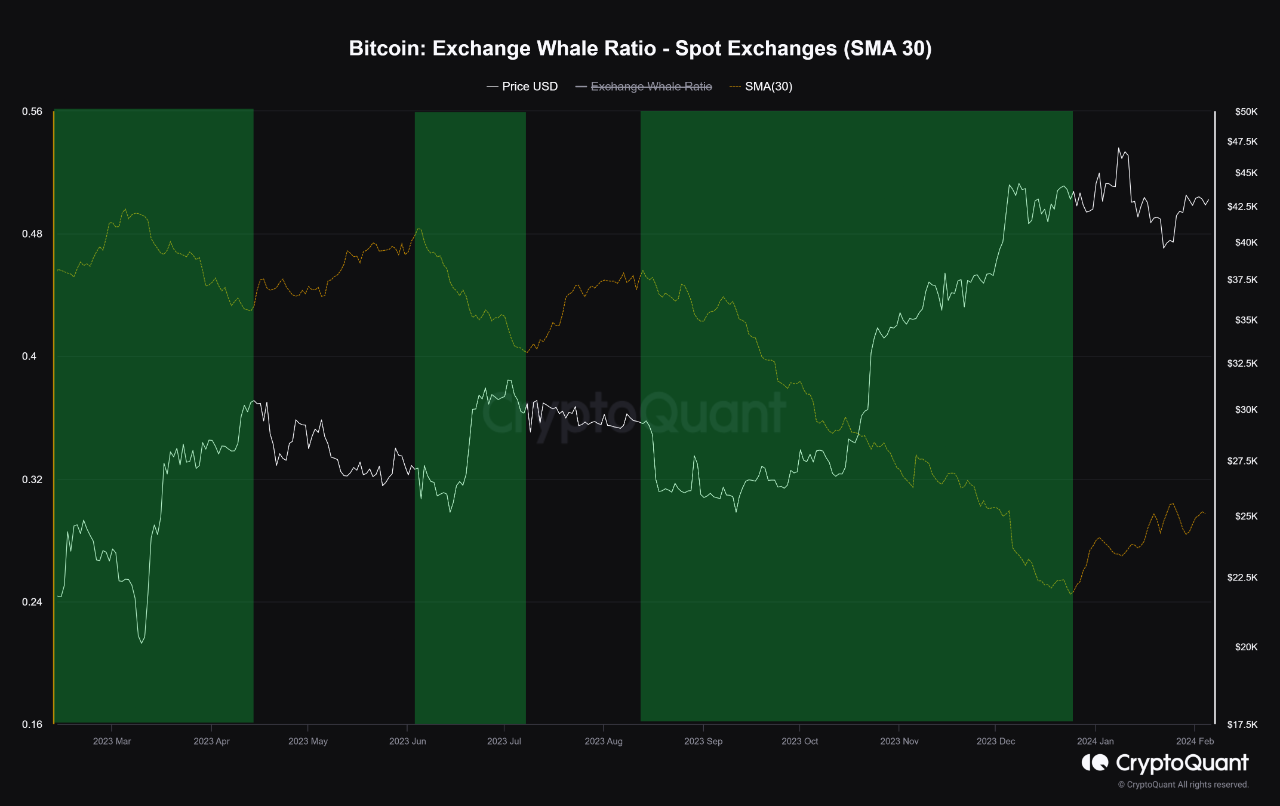
The late-2023 rally has been accompanied by whales withdrawing Bitcoin from spot markets. If we look at the previous year's historical pattern, we can see that every time whales deposited less coins into spot exchanges, the price increased, and every time whales deposited more coins than the total inflow to the exchanges, Bitcoin has undergone correction.
This indicator is now on an upward trend, which might lead to future price declines.

View original →

