Bullish(Nuanced)BTC
3/26/2022 BTC is moving upwards, towards the strong & psychological resistance at ~45K-46K.
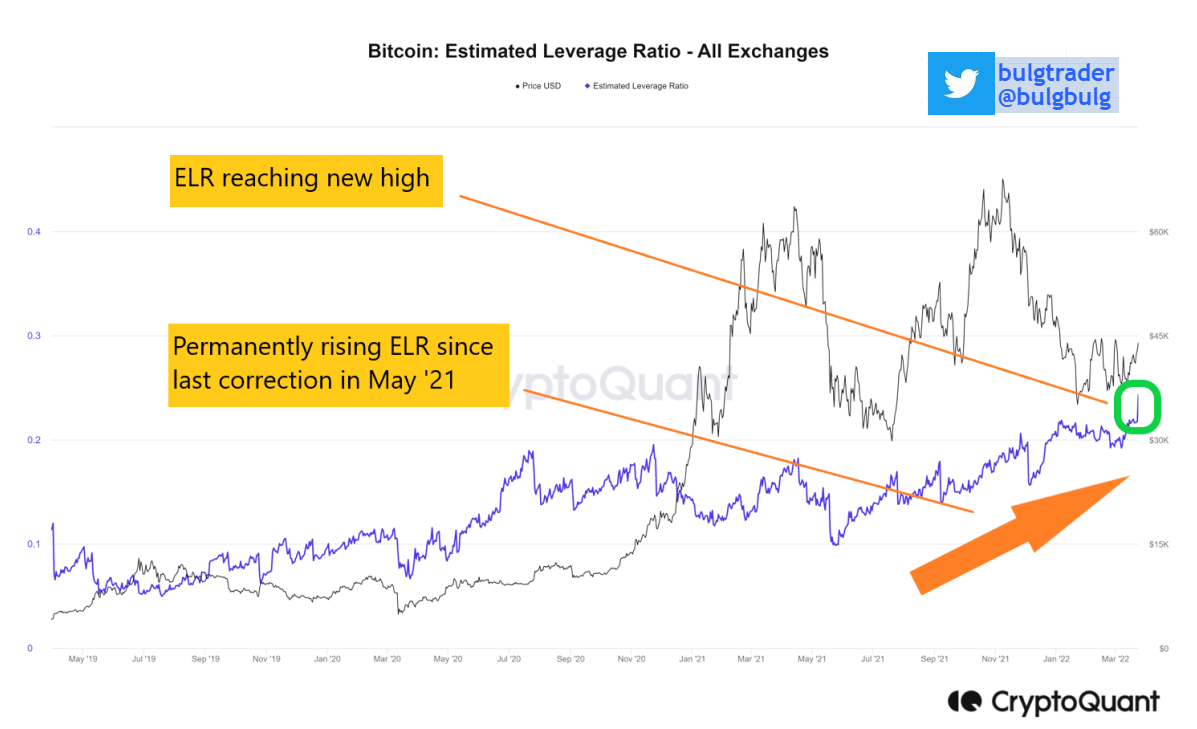
Data is showing that with this uptrend, the Estimated Leverage Ratio (ELR) reached 0.243, hitting a new high.
ELR is permanently rising since last correction in May '21!
The ELR is defined as the ratio of open interest divided by the reserve of an exchange and indicates how much leverage is used by users on average. With the high leverage risk the traders take, there is a very positive sentiment of the investors & a strong confidence in BTC.
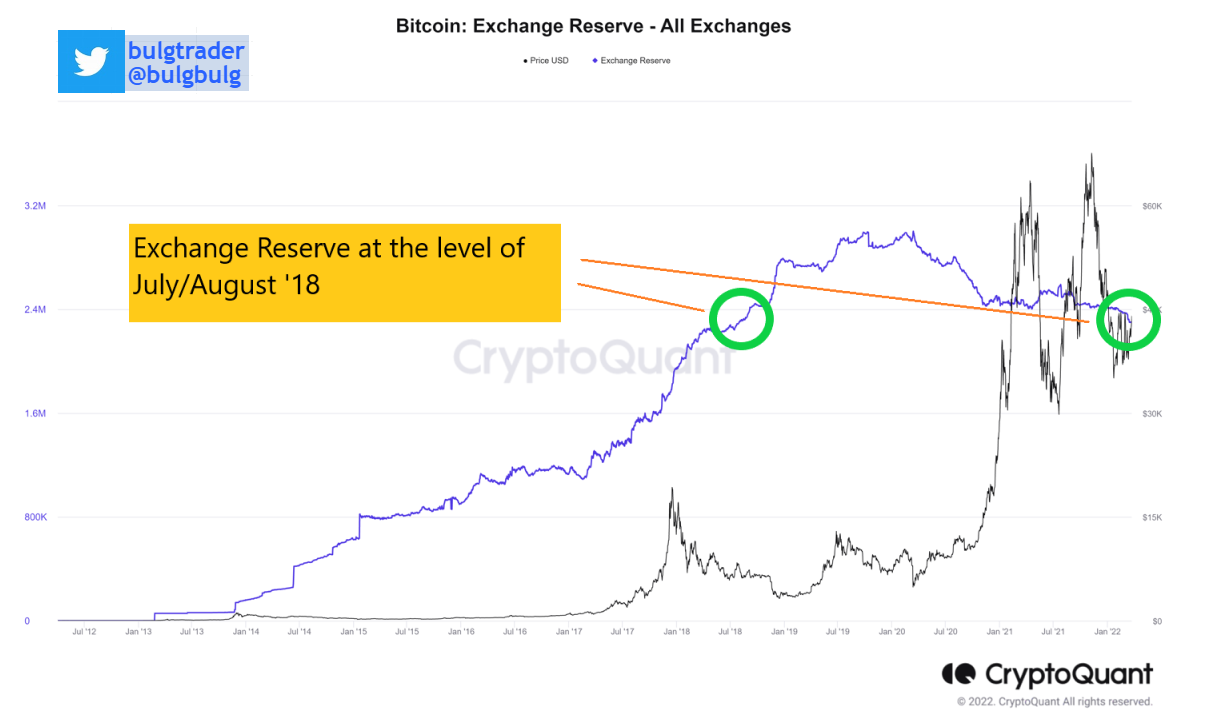
One of the triggers for a rising ELR is the decreasing exchange reserves, which was at about 2,305,000 BTC on 24.03.2022.
To make this number tangible, this is the level of July/August '18!
This trend shows an increasing storage of BTC for long term.
It seems, despite war, BTC has shaken off the Covid impacts.
But there are enough levers so that negative effects on BTC can prevail again. Everyone should therefore expose themselves to volatility in both direction.

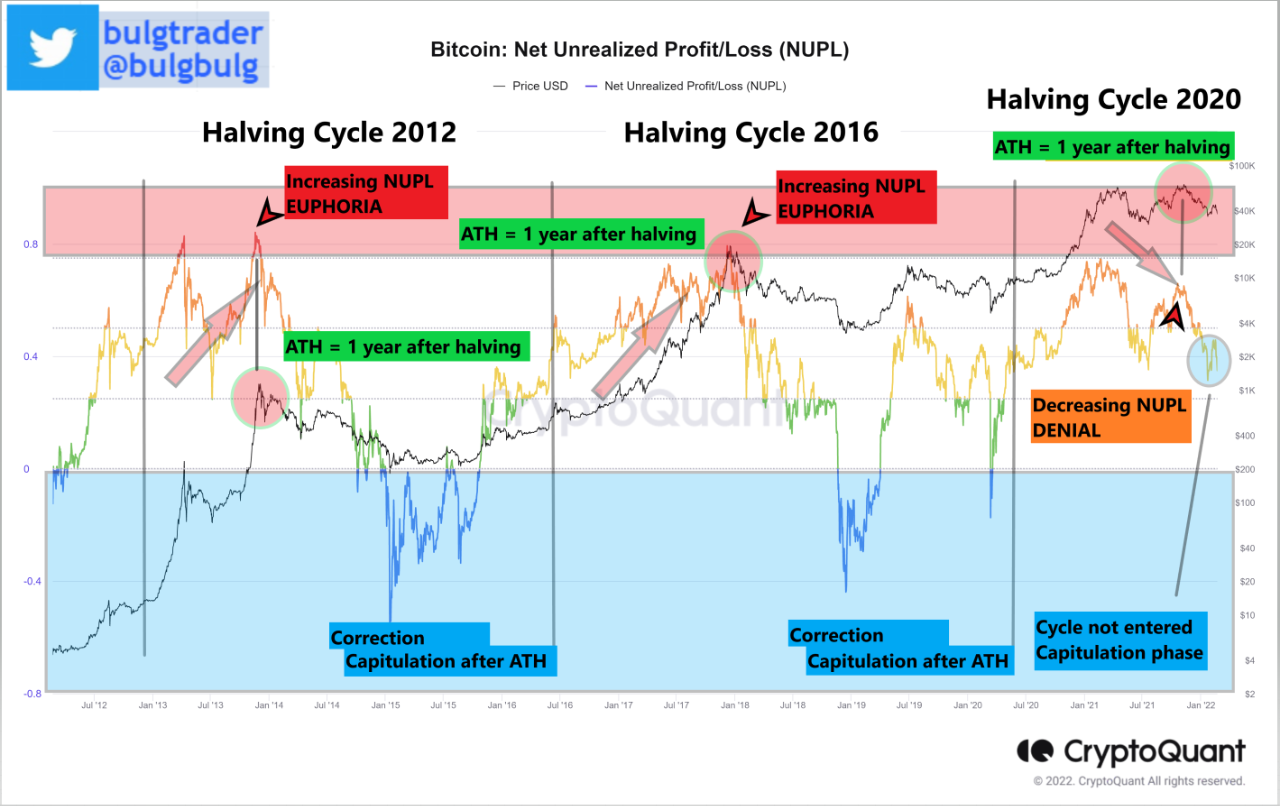
View original →NUPL can be used to describe different periods of the BTC cycles, especially it shows the sentiment to identify periods for selling/buying, means taking profit/entering the market.
The informative value is higher by applying the halving cylces, technically speaking cycles 2012, 2016 and 2020.
Thresholds
<0.0
0.0
0.25
0.5
0.75
following categories are applied on this thresholds (same order)
Capitulation
Hope - Fear
Optimisim - Anxiety
Belief - Denial
Euphoria - Greed
Common:
ATHs were reached in the subsequent year of the halving.
Means ATH = halving year + 1
2012 & 2016:
• sentiment increased to "Euphoria" and with that ATHs reached
• Price correction with „Capitulation“
This cycle shows up a different behaviour:
• ATH with no „Euphoria"
• NUPL descreasing & on the way to Capitulation?
• till now there was no capitulation phase
•
Conclusion:
Relying on cycle behaviour and the uncertainty in the market&geopolitical tensions, is this just the beginning of the bear market?

View original →Bullish(Nuanced)BTC
2/15/2022 It is clear that LTH (Long-Term Holders) that have held steady for this long would continue to hold till new all-time highs.
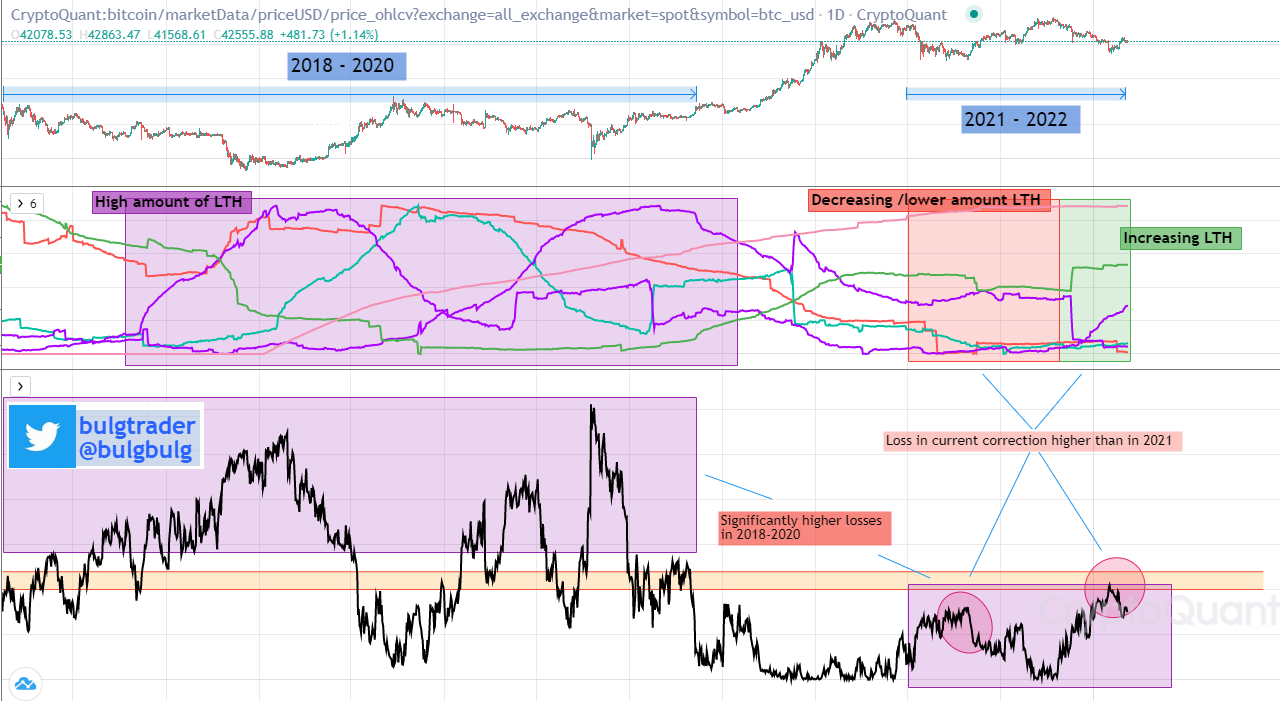
This QT concentrates on the LTH & UTXOs in loss and showing the correlation to highlight their behaviour and expectation.
In the chart following LTH timeframes are visible:
12m-18m, 18m-2y, 2y-3y, 3y-5y, 5y-7y, More than 10y
2018-2020:
>UTXO: high losses up to ~60%.
>Distribution of the LTH: high amount holding
>With the price rise & being in profit, LTH started to sell.
Current corrections 2021-now:
>UTXO: losses are not that high like before, max ~22%
>Furthermore, the losses in 2022 are a bit higher than in 2021.
>Distribution of the LTH: '21 has signficantly less LTH to 2018-2020 & bit less to `22
>Especially it has to be highlighted that with this correction the amount of LTH is again increasing compared to 2021!
Conclusion:
>HODLing is driving the UTXO-loss metric
>Increasing amount of LTHs indicates that there is expectation for new ATHs!

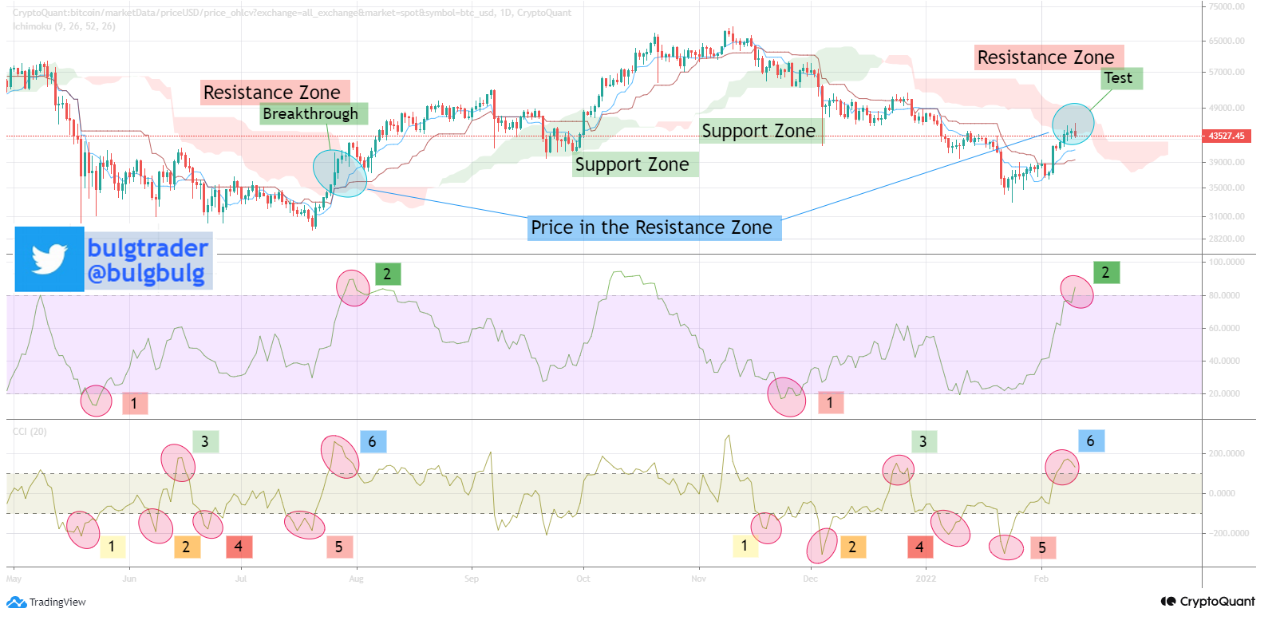
View original →The focus of this Quicktake is on comparison of techincal indicators between the last years correction (May-July '21) and the current one.
>>
"CCI Commodity Channel Index"
The comparison with the CCI is showing in the last years correction 4 oversold and 2 oversbought signals.
For better representation, the signals are serially numbered according their occurence in the timeline.
Comparing the CCI with current correction shows the same amount signals and the same serialization.
>>
"MFI Money Flow Index"
In the last years correction, had one oversold and one overbought signal. Here like at the CCI comparison, the occurences of the signals are serialized.
The same signals in the same order occur in the current correction.
>>
"Ichimoku Cloud"
For simplification the lines are faded-out, so only the clouds are visibile.
The last correction tested only one time the resistance zone with a final breakthrough.
This is the last indicator which is currently not fulfilled (test of resistance).

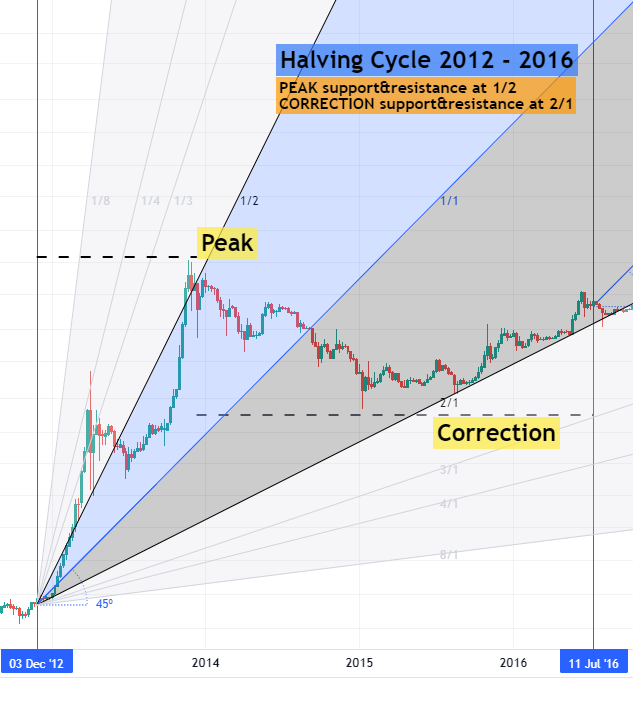
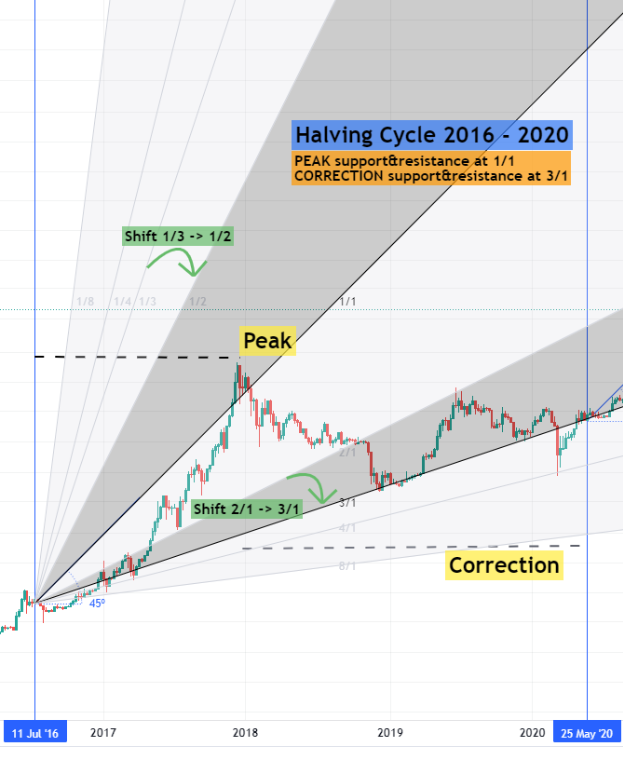
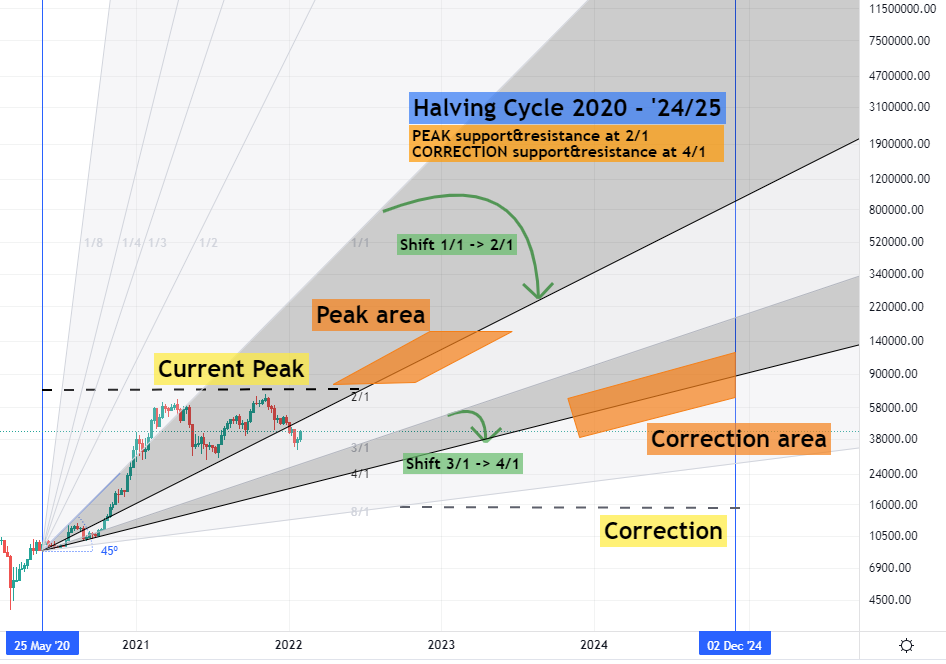
View original →In this QT, the three halving cycles up from 2012 till now are compared regarding their cyclical behaviour. The comparison is based on GANN Fans with the aim to get an indication for current cycle & price movement.
Gain insight from the charts & comparison:
>>Each cycle has one Peak and a correction phase
>>Each cycles' PEAK is reached in a shifted FAN to the previous cycle
>>Each cycles' correction phase reached in a shifted FAN to the previous cycle
Charts:
>>Halving Cycle 2012-2016
..PEAK reached in Fan 1/2
..Correction phase until end of cycle went alongside Fan 2/1 as support
>>Halving Cycle 2016-2020
..PEAK reached in Fan 1/1
..Correction phase found support & resistance until end of phase in Fan 3/1
>>Halving Cycle 2020-'24/25
..Current PEAK in Fan 2/1
..Assuming cycle PEAK not reached & should be found alongside 2/1
Correction phase could find support & resistance in Fan 4/1

View original →Bearish(Nuanced)BTC
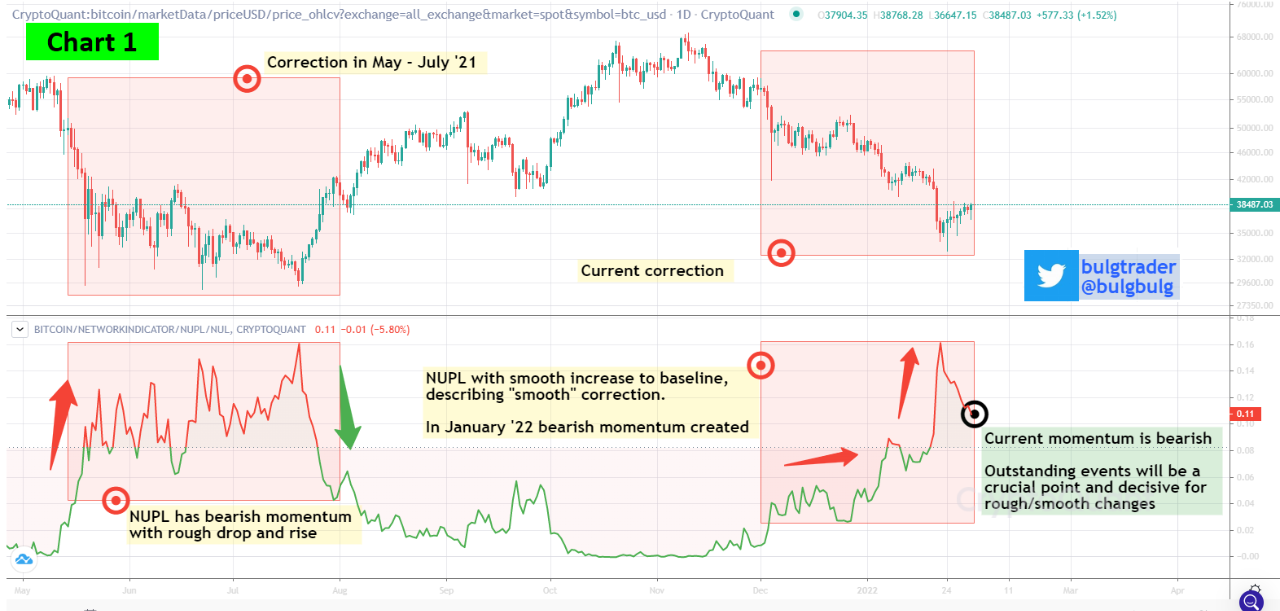
2/1/2022 This Quicktake is showing a possibility how to evaluate current market momentum with NUPL used/interpreted in a different way.
As every upward move of BTC brings great excitement to the community, there is an imperative to describe the market momentum.
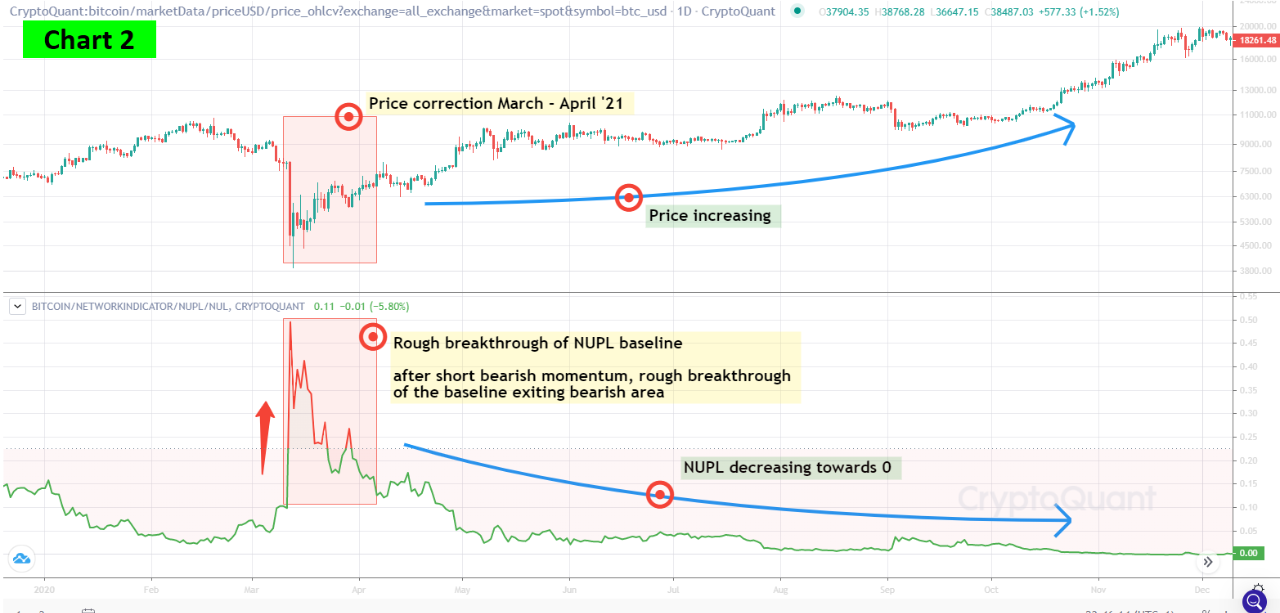
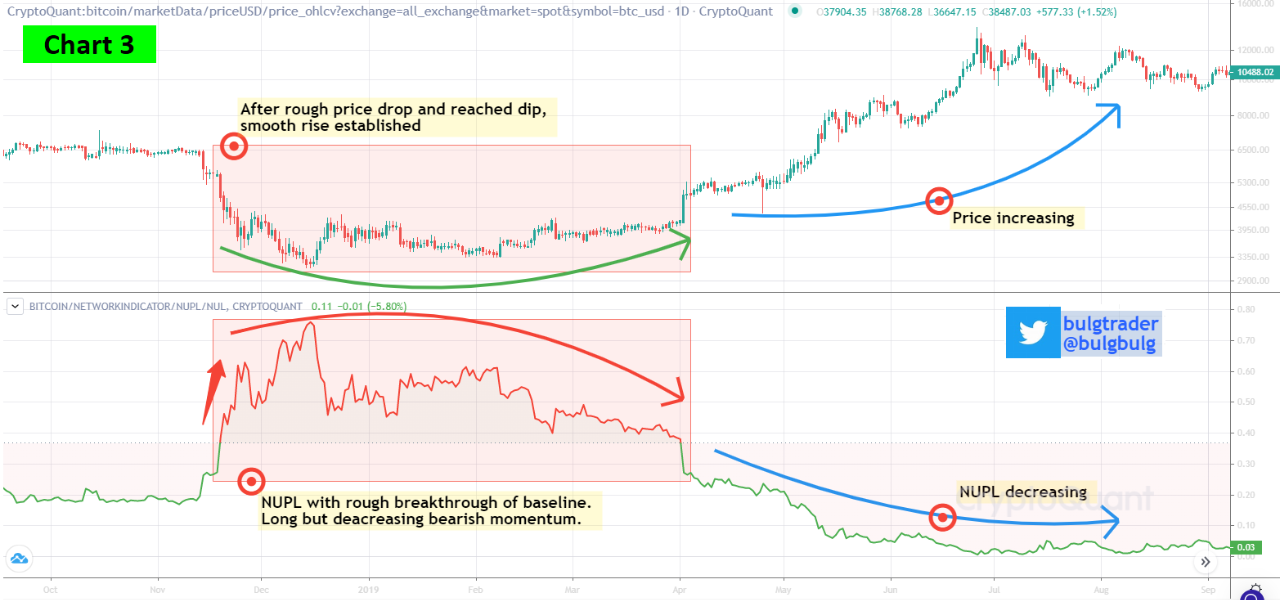
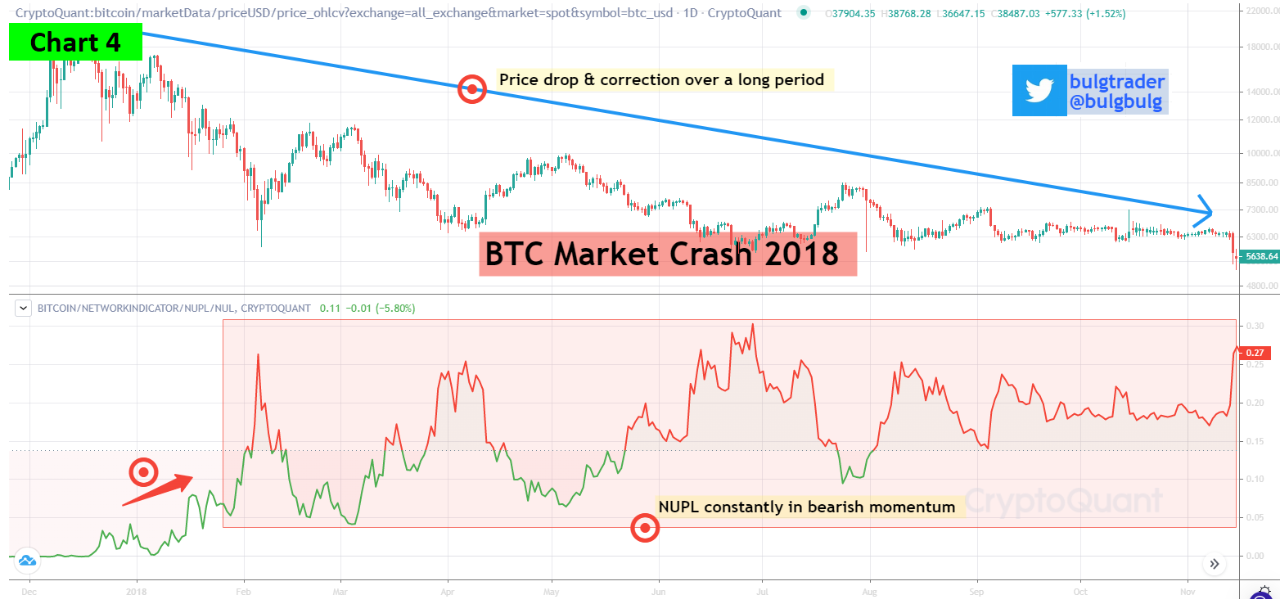
For this purpose I use the NUPL only in the positive codomain. With appropriate timeframe and baseline, evaluation is unbiased and authoritative.
Conclusion: Market still has bearish momentum. Potentially on the way for exiting this momentum, but a further price drop from this range is not off the stove.
In comparison with the correction in March '21, which had a clear bearish momentum, this one is more smooth and became in Jan '22 bearish!
Values near zero: bullish momentum
Values above baseline: bearish momentum
Described in 4 charts incl. BTC market crash in 2018!
Chart 1: March -July '21 & current timeframe
Chart 2: March - April '20
Chart 3: Novembre '18 - April '19
Chart 4: Decembre '17 - Novembre '18 -> BTC market crash

View original →Bearish(Nuanced)BTC
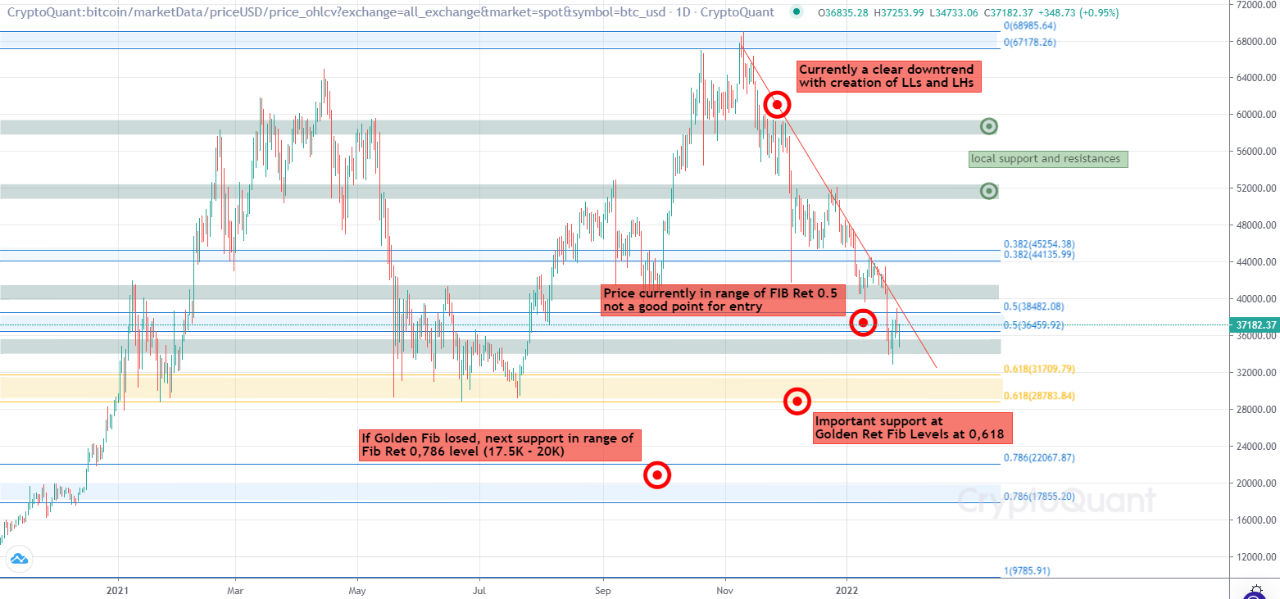
1/28/2022 This macro view on daily basis analysis BTC based on Fibonaccio Levels, with the aim to classify important levels, clarify possibilities and give an indication about possible trading points.
On macro view, BTC is currently in downtrend drawing new LHs and LLs, which could pave the way for possible investigation of lower price areas and supports.
The price is currently in the FIB Ret Level 0,5. For trading this level is
not a good entry point as no indication is available for price direction.
Currently price is near to test closer support range at 34K-35.5K.
The most important level is the "Golden Fib Ret Level" in the range 0,618.
No ifs and buts: If this Golden Fib Ret level is lost, next Fib Ret Level is in 18K - 22K.
There is "nothing in between".
So in respect of further on-chain analysis which should be considered as well,
BTC can make new LLs if local support gets lost.
It should be took into consideration that the bottoming could continue on short-term / max. mid-term.

View original →Neutral1/27/2022
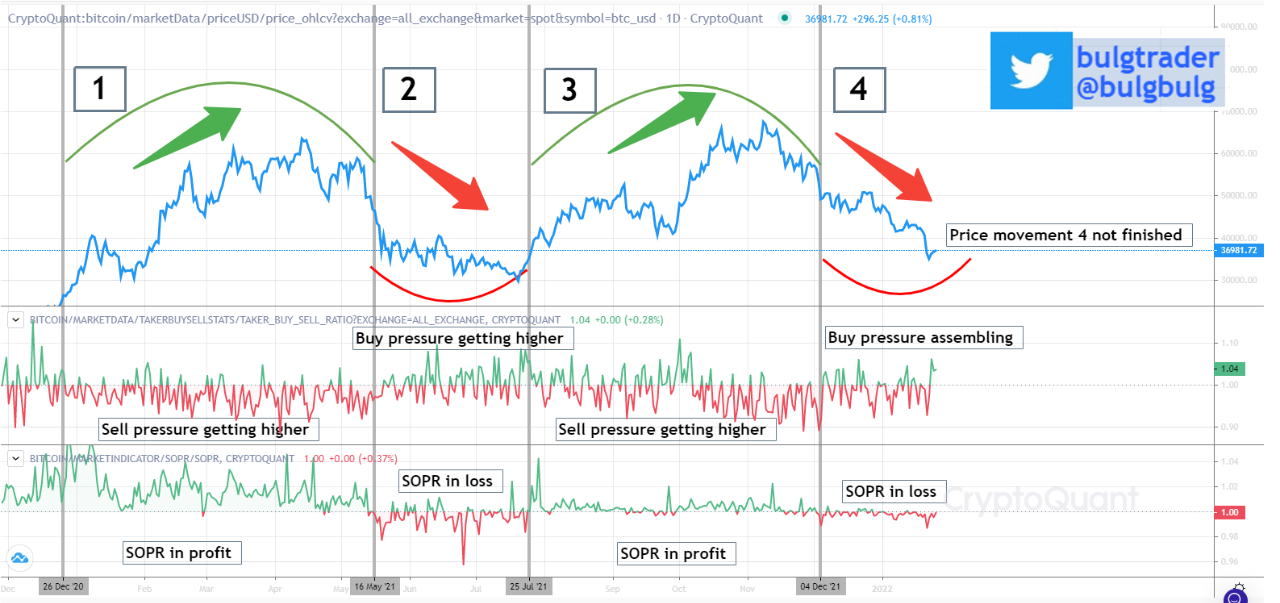
This correlation could give an indication about the price movement.
This Quicktake shows how a correlation can be set up and how it can help to position oneself.
SOPR:
It shows whether or not each moved coins are being sold in profit or not.
Taker Buy/Sell Ratio:
A Taker buy or sell enables transaction of a financial asset instantly at the current best available price. It can indicate buy / sell pressure
Price movements are based on several internal&external factors.
Taker Buy/Sell Ratio can be seen as a behaviour pattern, SOPR as outcome.
1:
Price increasing
SOPR -> Sells in profit
Taker Buyer/Sell Ratio -> Sell pressure getting higher
2:
Price decreasing
SOPR -> Sells in loss
Taker Buyer/Sell Ratio -> Buy pressure getting higher
3:
Price increasing
SOPR -> Sells in profit
Taker Buyer/Sell Ratio -> Sell pressure getting higher
4:
Price increasing (movement not finished)
SOPR -> Sells in loss
Taker Buyer/Sell Ratio -> Buy pressure assembling

View original →
Price direction & movement is currently dependent from external influence.
The FED announcement could but must not mean an enduring change of course.
At the end it could end in a side movement & chopping, as all the problems like inflation, political tensions are still valid.
But for the first it will give a direction in short & mid-term. And this direction will squeeze shorts or longs.
Negative news will increase selling pressure, positive ones buying pressure.
Indicators & Models have to sit out for now. None of them will give a right prediction.
Potentially a snapshot of the positioning of the traders could offer valuable clues.
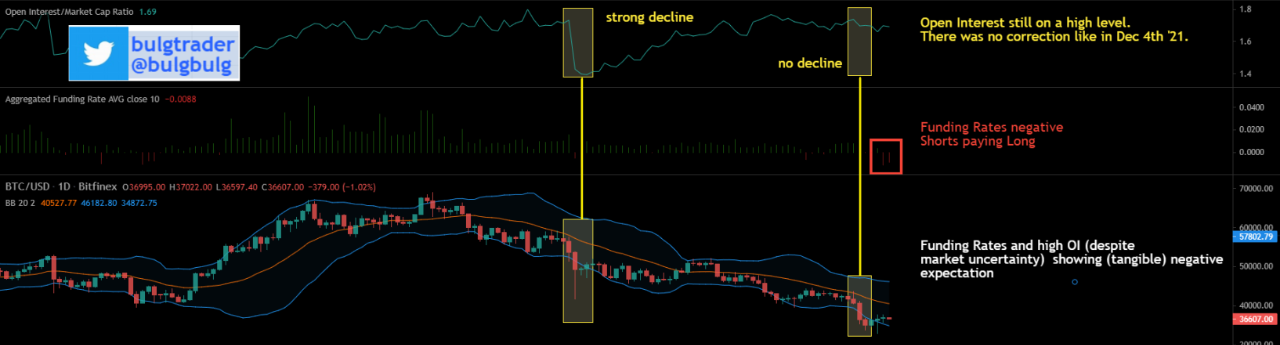
Despite the uncertainty what will come, the Open Interests persevere on a high level. Compared with the correction in Dec. '21, this time there was no decline of OIs.
The view onto the Funding Rates is revealing, that more traders are expecting a negative FED outcome.
How do you position yourself?

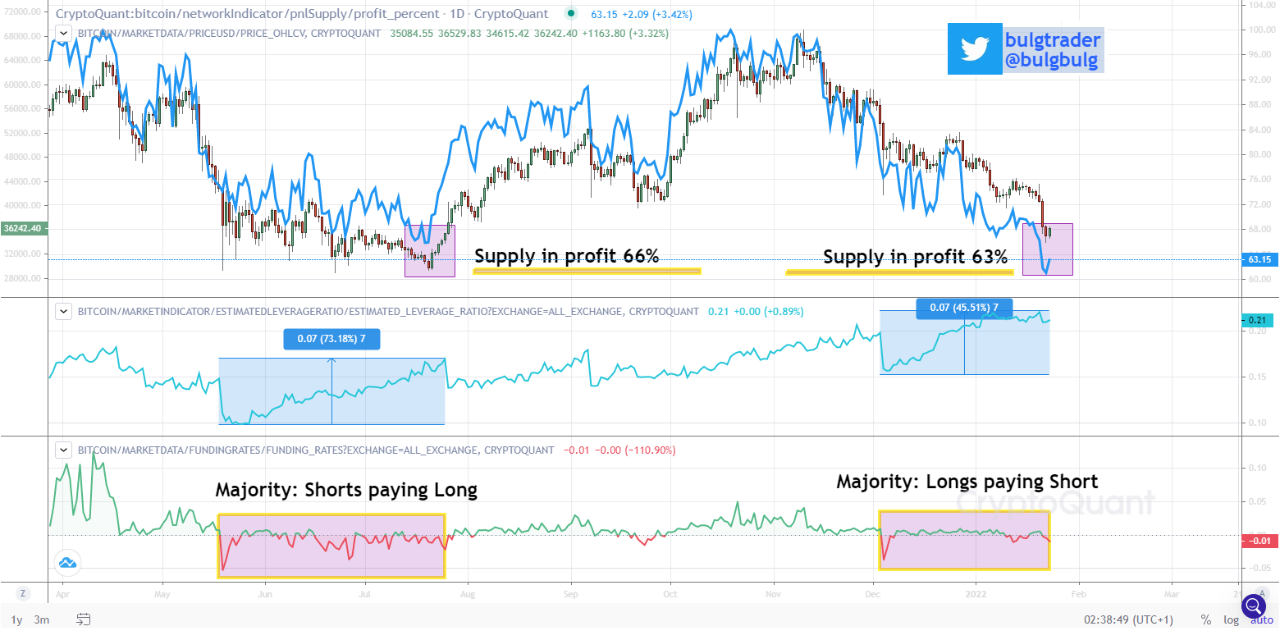
View original →Investor/trader behaviour&sentiment between the last price drop in May-July '21 and current one
After the dip of the correction last year, 66% off circulating supply were in profit.
The estimated leverage ratio rised about 73%
The funding rates were negativ, the majority of investors/trades were short
In the current correction, 63% of the supply are in profit
The estimated leverage ratio rised about 46%
The funding rate are positive, longs are paying shorts
During the last price correction, the investors/traders felt up to take more risks, and the sentiment was negative. The expectation was a drop of greater extent.
This experience tempted the investors/traders in this current price correction to be positiv and to go long, data&comparisons let them assume that the dip is reached and the price is on the brink of a rise, albeit the willingness to take more risk is clearly less.
Important: current price correction the price movement for now is undetermined

View original →

