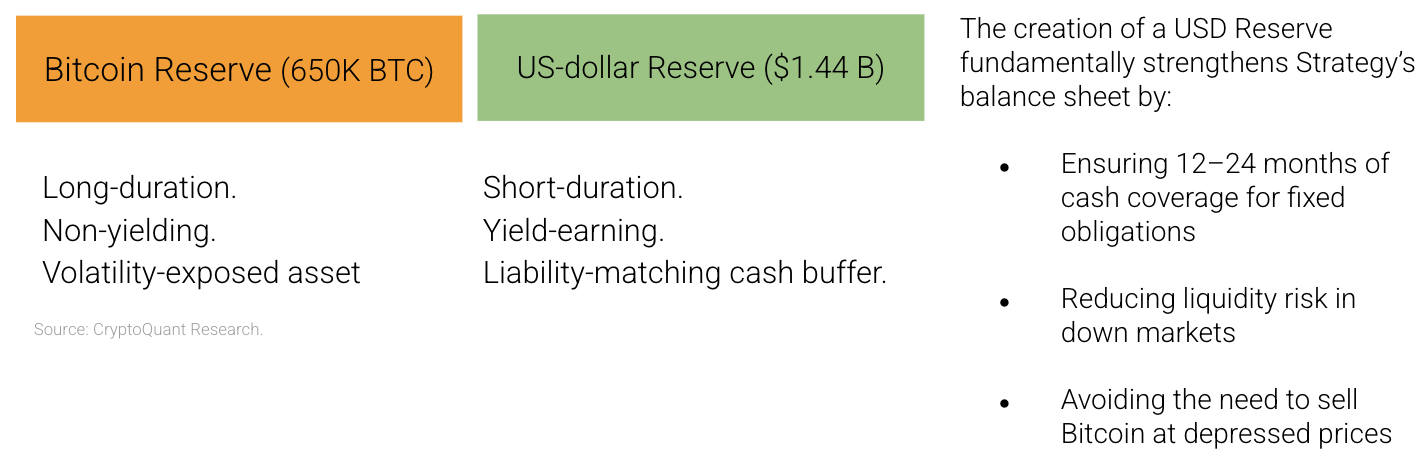
Strategy (MSTR) has announced a major shift in how it manages its balance sheet. The company raised over $1.44 billion through common equity issuance to build a US dollar Reserve dedicated to paying dividends on preferred stock and servicing interest obligations for at least 12 months, with a stated goal of extending this cash runway to 24 months. Importantly, Strategy also disclosed that it may sell Bitcoin or Bitcoin derivatives as part of its risk-management options.
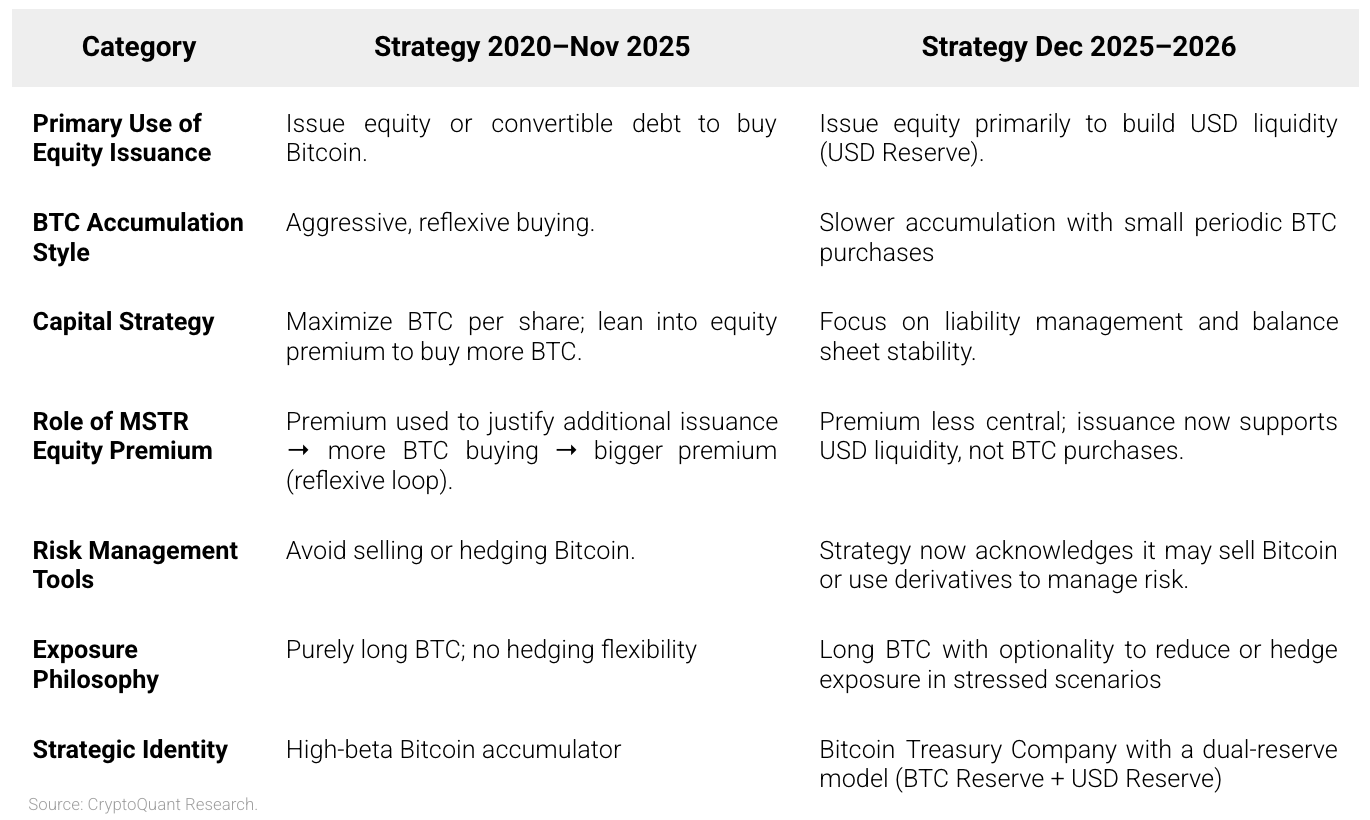
* This represents a structural pivot from its historical 2020–Nov 2025 playbook of issuing equity and convertibles to buy more Bitcoin. The new approach introduces a more mature corporate treasury framework: a dual-reserve model consisting of long-duration Bitcoin holdings and short-duration US dollar liquidity that reduces the risk of forced BTC sales during market downturns.
* The shift carries material implications for the Bitcoin market. On one hand, Strategy’s reduced marginal Bitcoin buying softens a powerful demand channel that amplified previous bull cycles. On the other hand, the US dollar Reserve and newly disclosed hedging/sale capability significantly reduce the probability of distress-driven Bitcoin selling, which is ultimately supportive of long-run market stability.
# On-chain | Market Activities
1. Strategy announced the creation of a dedicated US dollar reserve of more than $1.44 billion, funded entirely by at-the-market (ATM) issuance of new MSTR common stock.
The reserve is explicitly intended to cover: 1. Cash dividends for Strategy’s preferred stock classes (around $700 million per year), 2. Interest on its outstanding convertible bonds, and 3. Short-term liquidity needs in the event capital markets tighten.
This reserve is managed separately from the firm’s Bitcoin Reserve, making Strategy a dual-reserve entity for the first time.
2. Strategy has made a tactical shift in its Bitcoin accumulation model as Bitcoin may experience a weak 2026, after starting a bear market last month. The company no longer treats its Bitcoin exposure as untouchable across all market conditions. It is still the center of their long-term thesis — but management is now acknowledging that maintaining the BTC stack requires having the flexibility to defend it via cash buffers, hedging, and selective monetization in distressed scenarios.
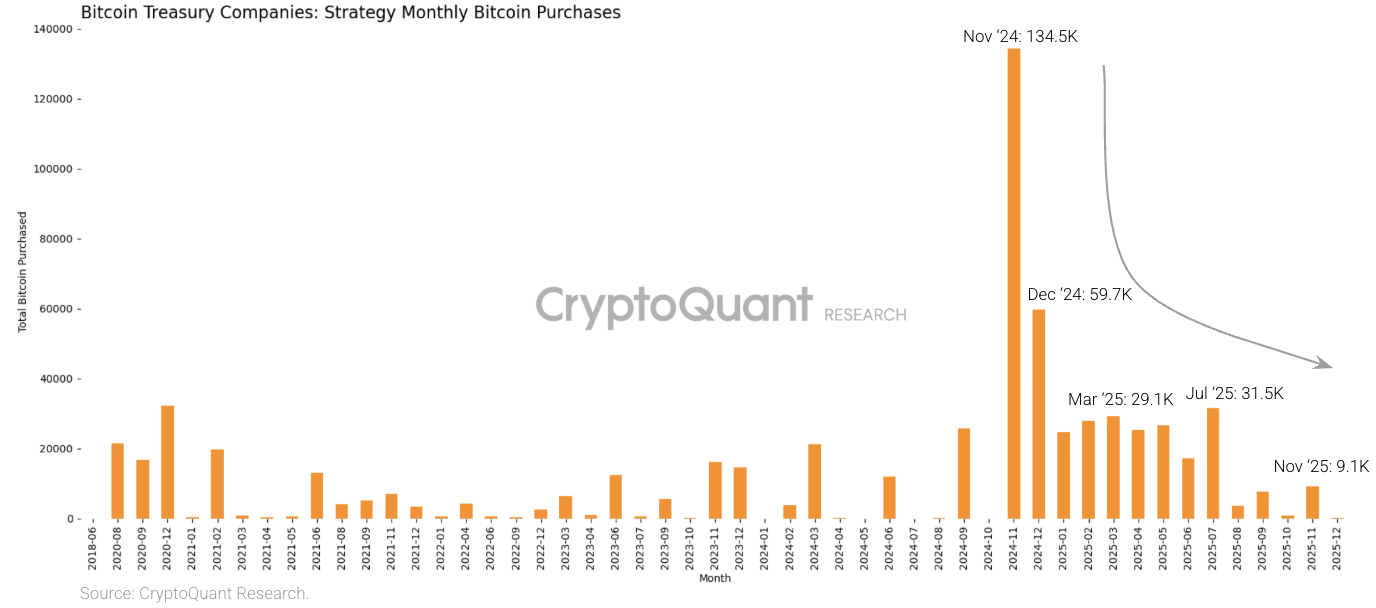
3. Indeed, Strategy’s monthly Bitcoin purchases have been decreasing throughout 2025. Monthly purchases declined from a record 134K BTC in November 2024 to 59.7K in December 2024, 31.5K in July 2025, and just 9.1K BTC in November 2025. The company has purchased 135 BTC so far in December. – [Link](https://cryptoquant.com/community/dashboard/68628914d839184a616f092d)
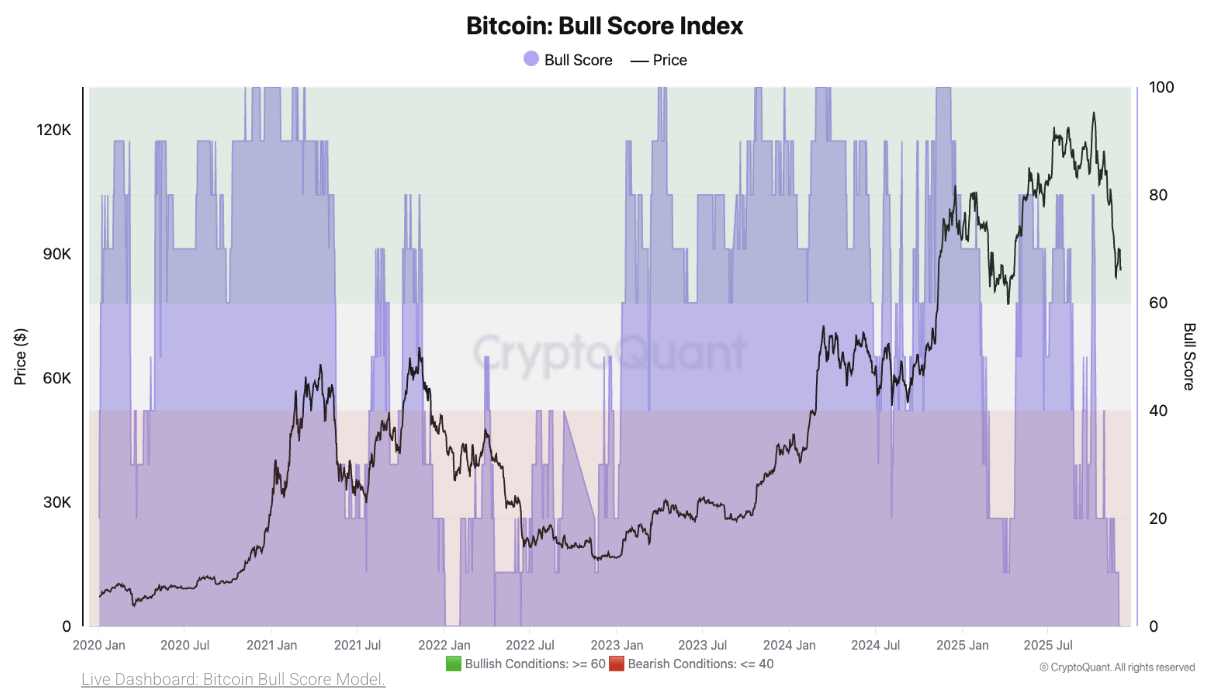
4. Strategy appears to acknowledge a non-trivial probability of a deep or extended Bitcoin drawdown. Strategy’s shift from aggressive Bitcoin accumulation to a more conservative, liquidity-focused treasury approach coincides with Bitcoin’s largest drawdown of 2025, a decline severe enough that nearly every major on-chain and technical indicator now signals the market has entered a bearish phase, as seen in CryptoQuant’s Bull Score Index dropping to zero (most bearish) for the first time since January 2022, when the previous bear market was starting. – [Link](https://cryptoquant.com/community/dashboard/67db8377a2a7203afd398632)
Establishing a 24-month USD buffer suggests an expectation that Bitcoin could trade sideways or lower for an extended period, and that capital markets may be less receptive to future stock issuance.
If you have any questions, send us an email at [research@cryptoquant.com](mailto:research@cryptoquant.com)
The information herein was prepared by Team CQ Inc. (a.k.a. CryptoQuant) and is for informational purposes only and is not intended to constitute a recommendation, investment advice of any kind, or an offer to buy or sell securities or other assets. Please perform your own research and consult a qualified advisor to see if digital assets are an appropriate investment option.
This information is not intended for distribution to, or use by, any person or entity in any jurisdiction or country where such distribution or use would be contrary to local law or regulation. Persons accessing this information are required to inform themselves about and observe such restrictions.
Digital assets are speculative and highly volatile, can become illiquid at any time, and are for investors with a high-risk tolerance. Investors in digital assets could lose the entire value of their investment. Team CQ Inc. does not provide tax, legal, investment, or accounting advice. This material is not intended to provide, and should not be relied on, for tax, legal, or accounting advice. Tax laws and regulations are complex and subject to change. You should consult your own tax, legal, and accounting advisors before engaging in any transaction.
© 2025 Team CQ Inc. All rights reserved.

View original →Following recent crypto price declines (Bitcoin hit a seven-month low of $80K) last week, large traders and long-term holders have ramped up exchange deposits. This development could put further downward pressure on prices if it continues. For example:
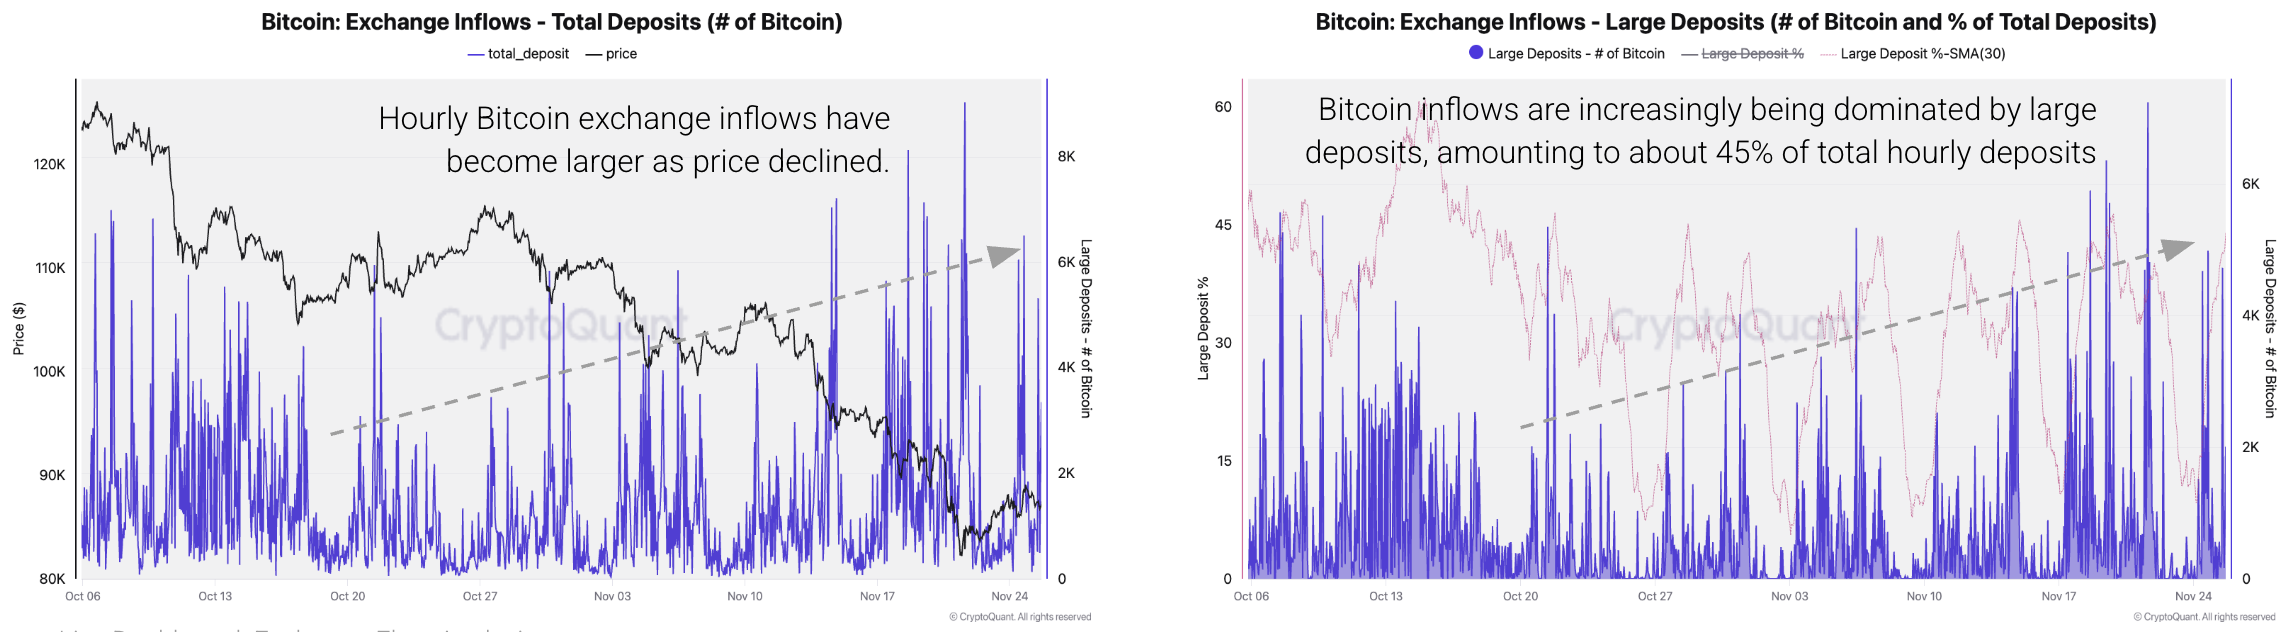
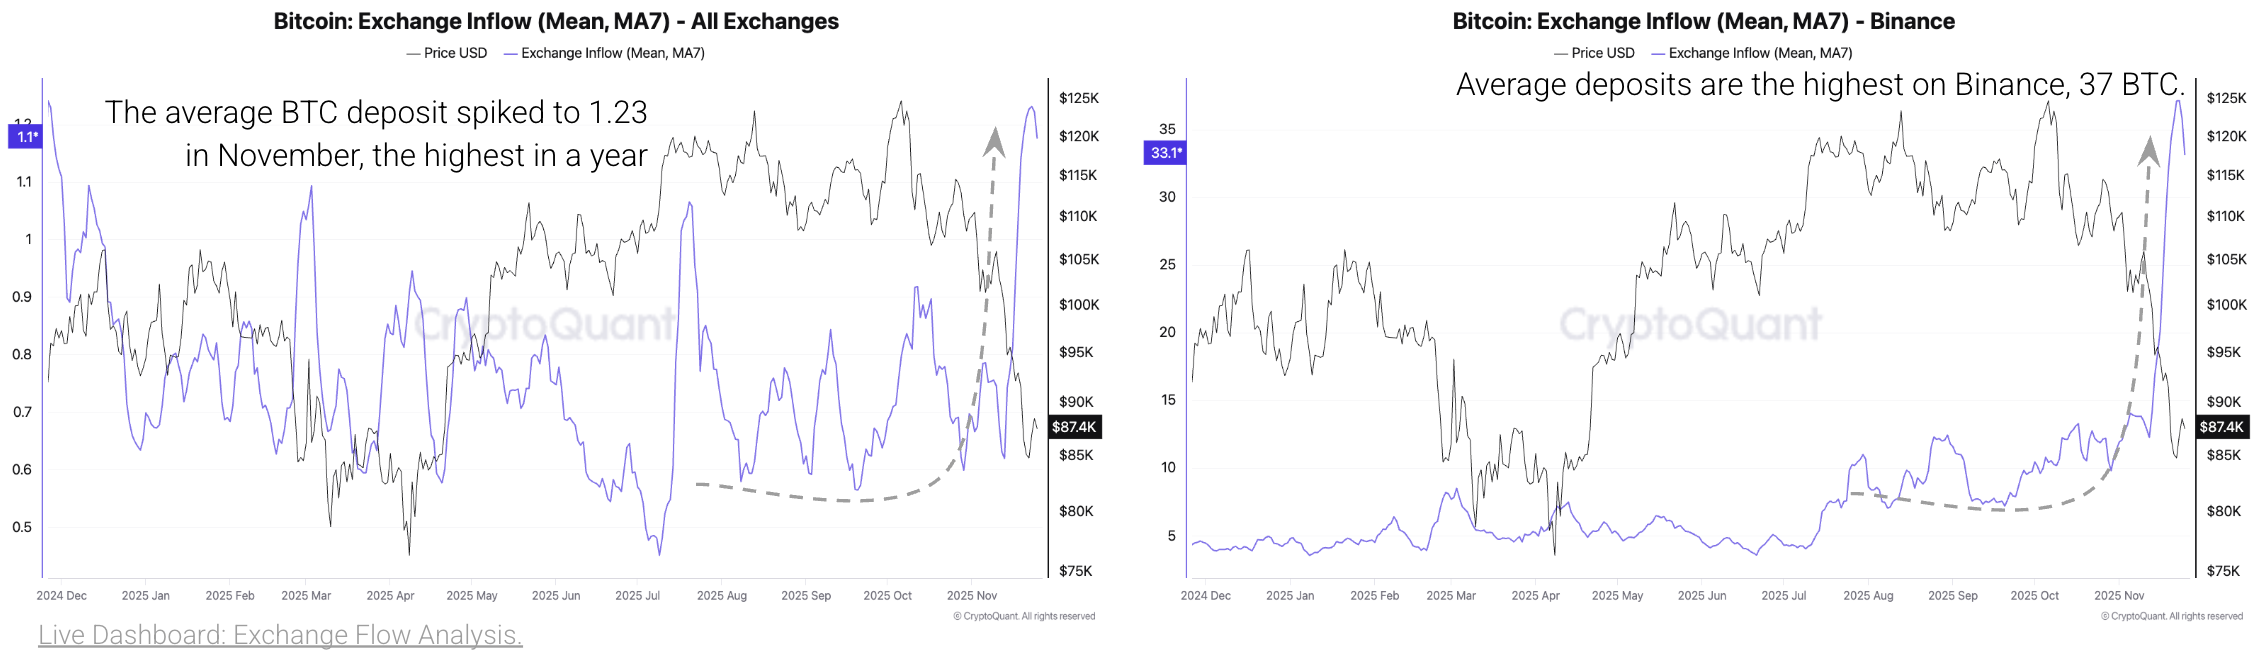
* Bitcoin exchange inflows have increased further as the price declined to seven-month lows of ~87K. The total number of Bitcoin sent to exchanges reached a high of 9K on November 21. 45% of the total Bitcoin sent to exchanges is coming from large deposits (100 BTC or more). This indicates that investors and traders continue to sell Bitcoin in the context of the current price drawdown, putting further downward pressure on the price. Indeed, the average BTC deposit value shot up to 1.23 BTC a few days ago, the highest level in a year.
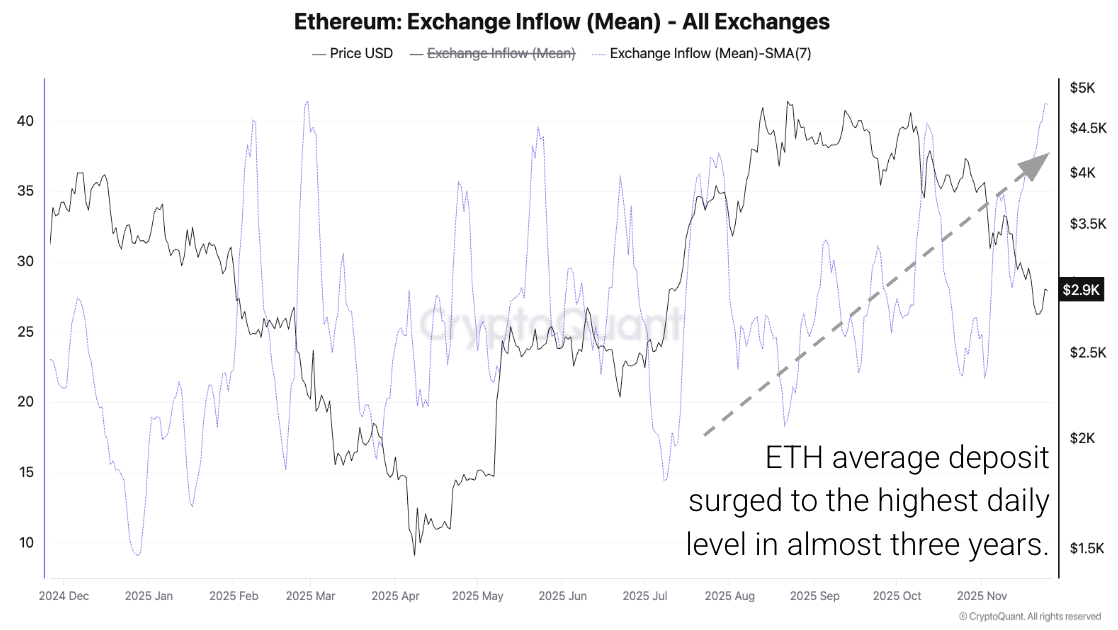
* In the case of Ethereum, exchange inflows are also increasingly dominated by large deposits, although total inflows have not spiked much. The daily average exchange deposit value has surged to 41.7 ETH, the highest level in almost three years, in the context of ETH falling to ~$2.9K.
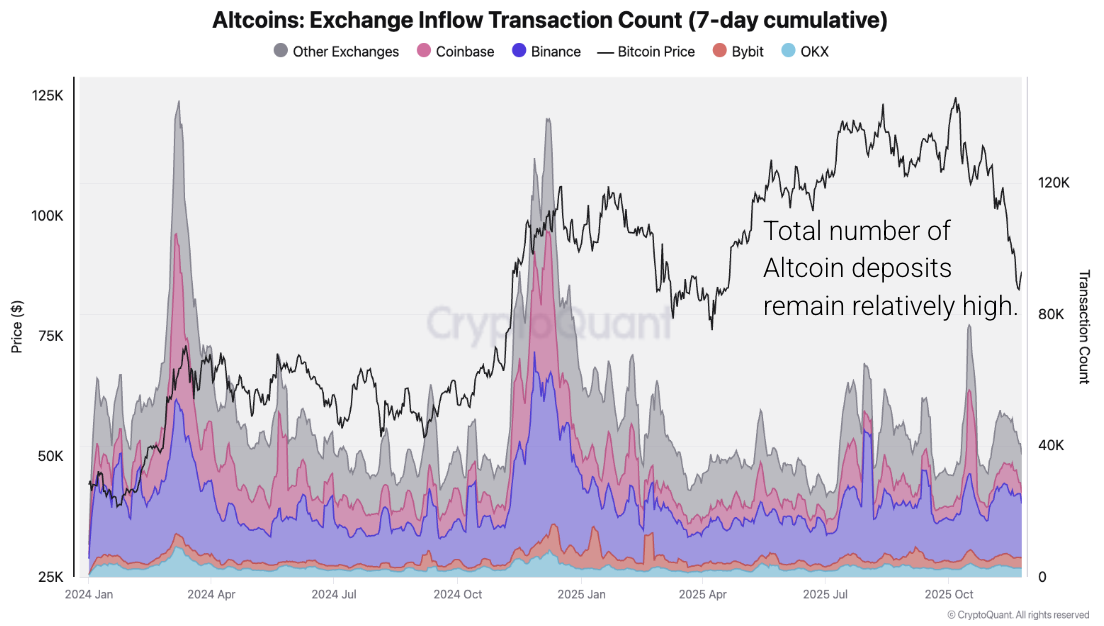
* With respect to Altcoins, the total daily number of deposits has remained relatively high. The total number of transactions sending Altcoins into exchanges remains at around 40K or more per day since July, a relatively high amount. Altocin transactions into exchanges most recently peaked at 78K on October 17.
# On-chain | Market Activities
1. Bitcoin exchange inflows have increased further as the price declined to seven-month lows of ~87K. The total number of Bitcoin sent to exchanges reached a high of 9K on November 21 as the price continued to decline. Moreover, 45% of the total Bitcoin sent to exchanges is coming from large deposits (100 BTC or more), getting as high as 7K BTC on November 21. This indicates that investors and traders continue to sell Bitcoin in the context of the current price drawdown, putting further downward pressure on the price. – [Link](https://cryptoquant.com/community/dashboard/68628914d839184a616f092d)
2. Large traders and investors are leading the current wave of Bitcoin exchange inflows. This is evident in the average BTC deposit value shooting up to 1.23 BTC in November, the highest level in a year, from 0.6 BTC just a week ago. This indicates that large deposits are leading exchange inflows, increasing the average deposit. By exchange, we see the average deposit spiking on Binance from 12 BTC at the start of November to as high as 37 BTC in the last few days. This further supports that large Bitcoin holders are using the biggest crypto exchange to lower their Bitcoin exposure. – [Link](https://cryptoquant.com/community/dashboard/68628914d839184a616f092d)
3. ETH Exchange inflows are also increasingly dominated by large deposits, although total inflows have not spiked much. The daily average exchange deposit value has surged to 41.7 ETH, the highest level in almost three years, in the context of ETH falling to ~$2.9K. – [Link](https://cryptoquant.com/community/dashboard/68628914d839184a616f092d)
4. With respect to Altcoins, the total daily number of deposits has remained relatively high. The total number of transactions sending Altcoins into exchanges remains at around 40K or more per day since July, a relatively high amount. Altcoin transactions into exchanges most recently peaked at 78K on October 17.
This situation also indicates the high exchange deposit activity for Altcoins in the context of the ongoing price sell-off. – [Link](https://cryptoquant.com/community/dashboard/68628914d839184a616f092d)
If you have any questions, send us an email at [research@cryptoquant.com](mailto:research@cryptoquant.com)
The information herein was prepared by Team CQ Inc. (a.k.a. CryptoQuant) and is for informational purposes only and is not intended to constitute a recommendation, investment advice of any kind, or an offer to buy or sell securities or other assets. Please perform your own research and consult a qualified advisor to see if digital assets are an appropriate investment option.
This information is not intended for distribution to, or use by, any person or entity in any jurisdiction or country where such distribution or use would be contrary to local law or regulation. Persons accessing this information are required to inform themselves about and observe such restrictions.
Digital assets are speculative and highly volatile, can become illiquid at any time, and are for investors with a high-risk tolerance. Investors in digital assets could lose the entire value of their investment. Team CQ Inc. does not provide tax, legal, investment, or accounting advice. This material is not intended to provide, and should not be relied on, for tax, legal, or accounting advice. Tax laws and regulations are complex and subject to change. You should consult your own tax, legal, and accounting advisors before engaging in any transaction.
© 2025 Team CQ Inc. All rights reserved.

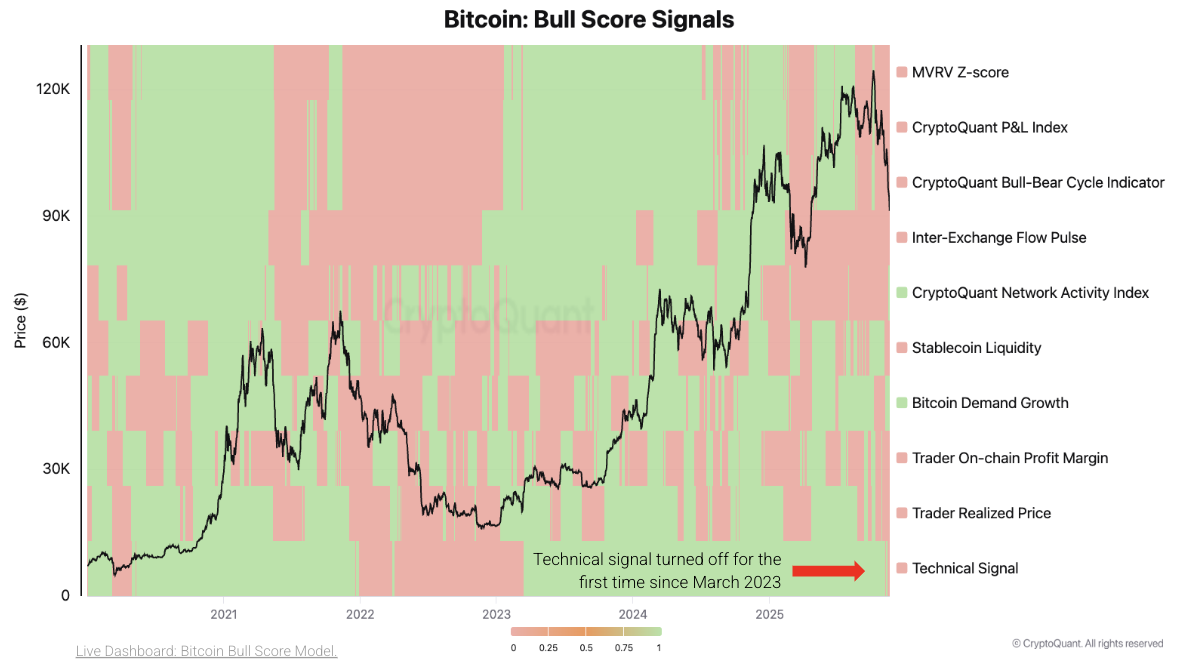
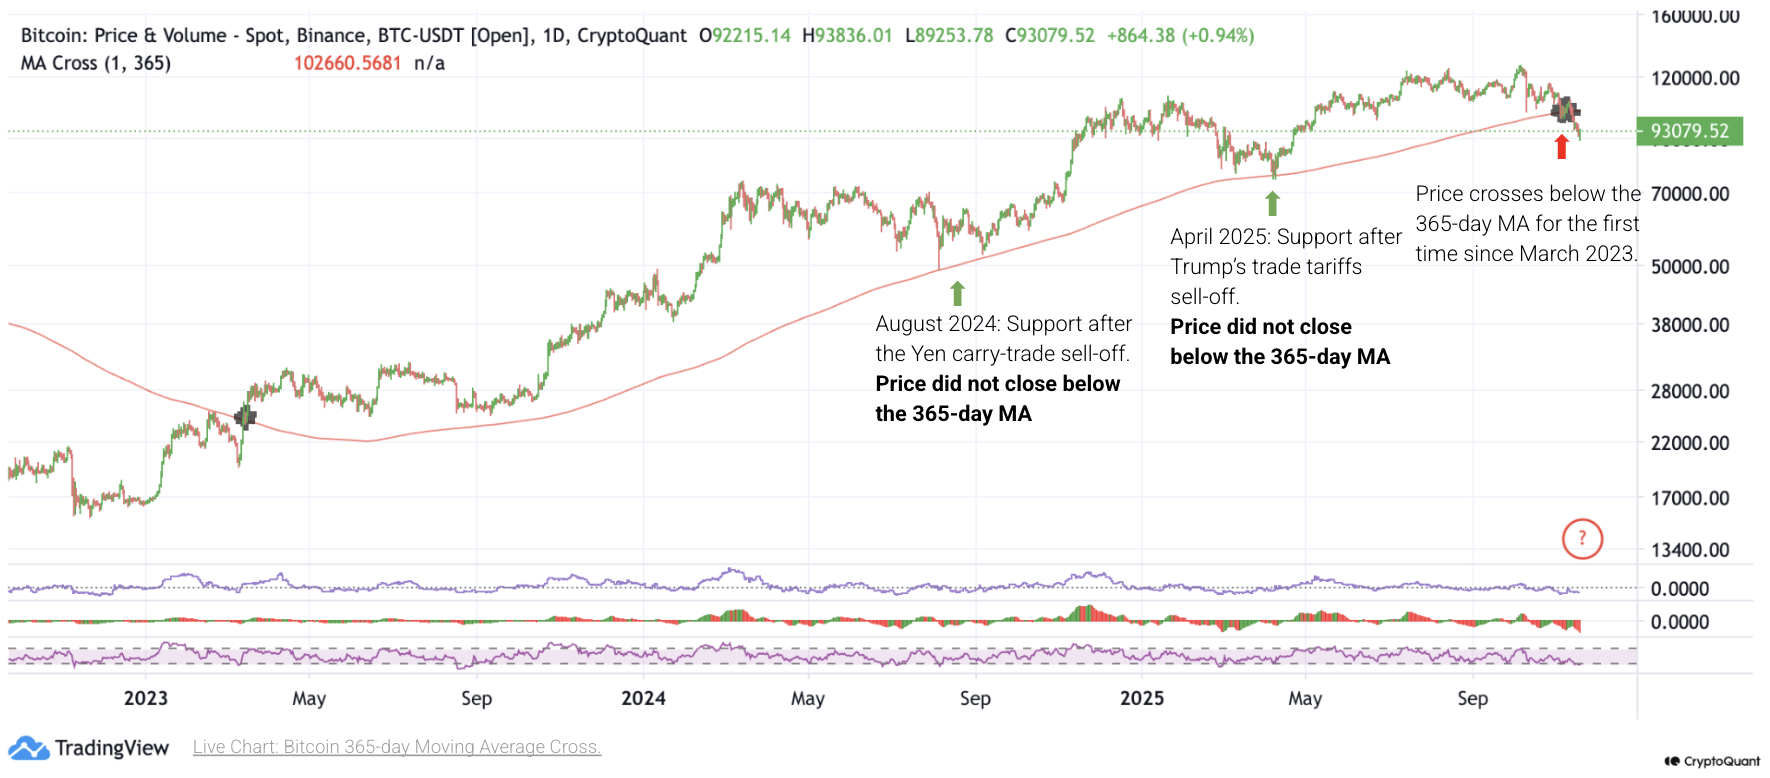
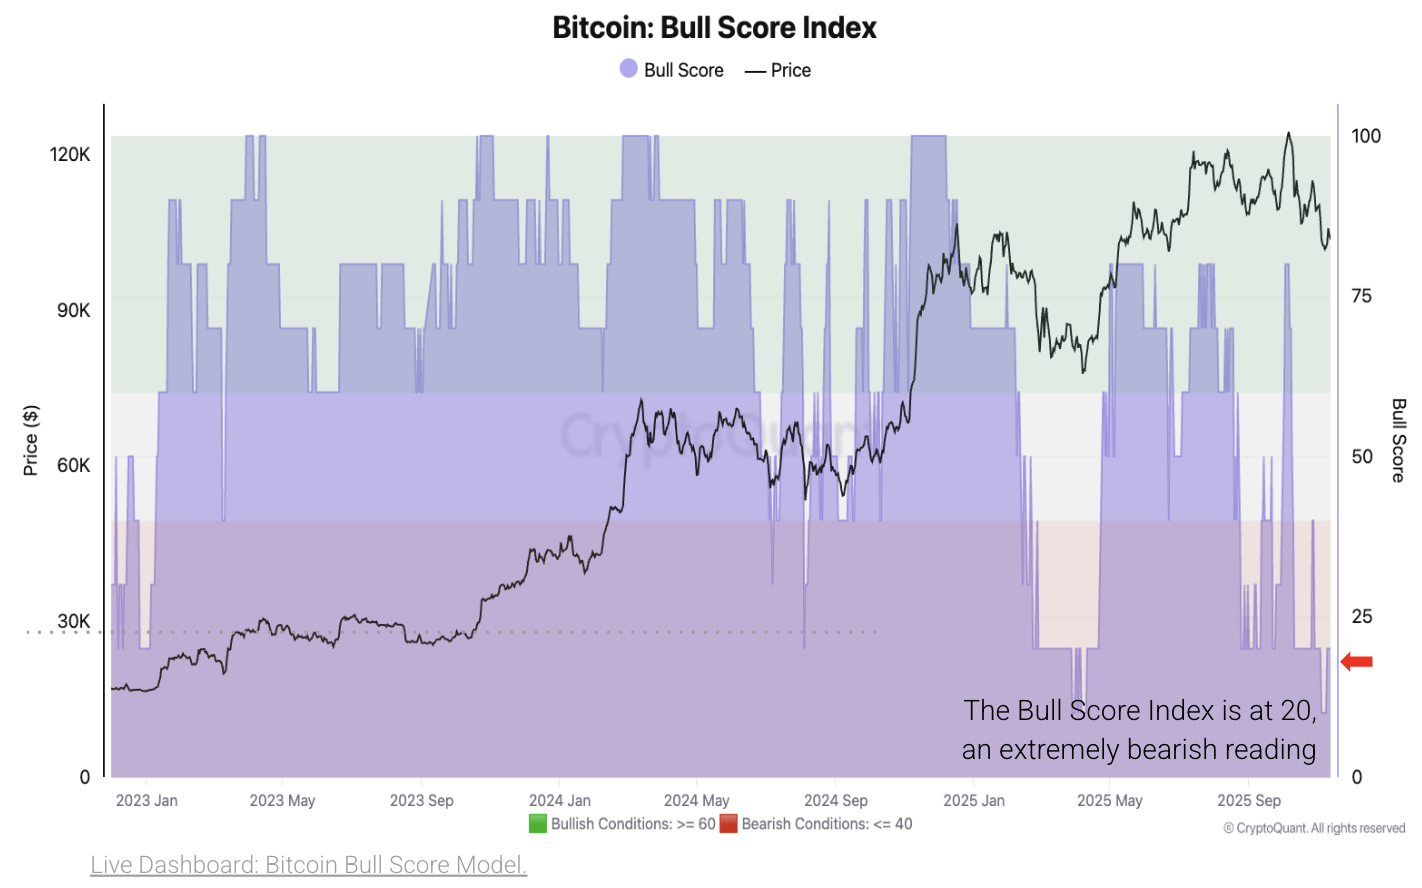
View original →Bitcoin market conditions are the most bearish they have been since the current bull cycle started in January 2023, and this price correction differs notably from prior pullbacks. Last week, we showed how CryptoQuant’s Bull Score Index declined to extreme bearish levels of 20/100 in the context of spot demand contraction, shift to negative price momentum, and slowdown of stablecoin liquidity growth. On top of this, a key bearish technical signal was set off for Bitcoin as the price broke down its 365-day moving average (MA). A decline below this key technical level was the last bearish signal that confirmed the 2022 Bitcoin bear market. It is worth noticing that Bitcoin never broke the 365-day MA during the price corrections of this bull cycle. Now, fundamental and technical indicators are both inside a bearish phase.
* On the demand side, Treasury companies are no longer a reliable source of demand for Bitcoin, and Strategy can’t do all the lifting. Bitcoin purchases by Treasury companies, once an important source of demand for Bitcoin this year, have basically stopped as their market capitalization collapsed 70%-90%+ in the last few months. Because their market capitalization is now lower than the value of their Bitcoin holdings, they are unable to sell more shares at the market to raise capital and buy Bitcoin. Additionally, Strategy’s Bitcoin purchases slowed down significantly as the market cap of its common stock declined towards the value of its Bitcoin holdings.
* Is the four-year cycle alive, or will it be extended? Previous bull-bear cycles for Bitcoin have coincidentally lasted four years, 2014-2017 and 2018-2021. As such, the current cycle (2022-2025) would end this year under this criterion. Initially, the four-year cycle was attributed to the supply shock caused by the halving, which also occurs every four years. While the halving effect was significant in the first cycles, its supply shock is now negligible compared to the available Bitcoin for trading.
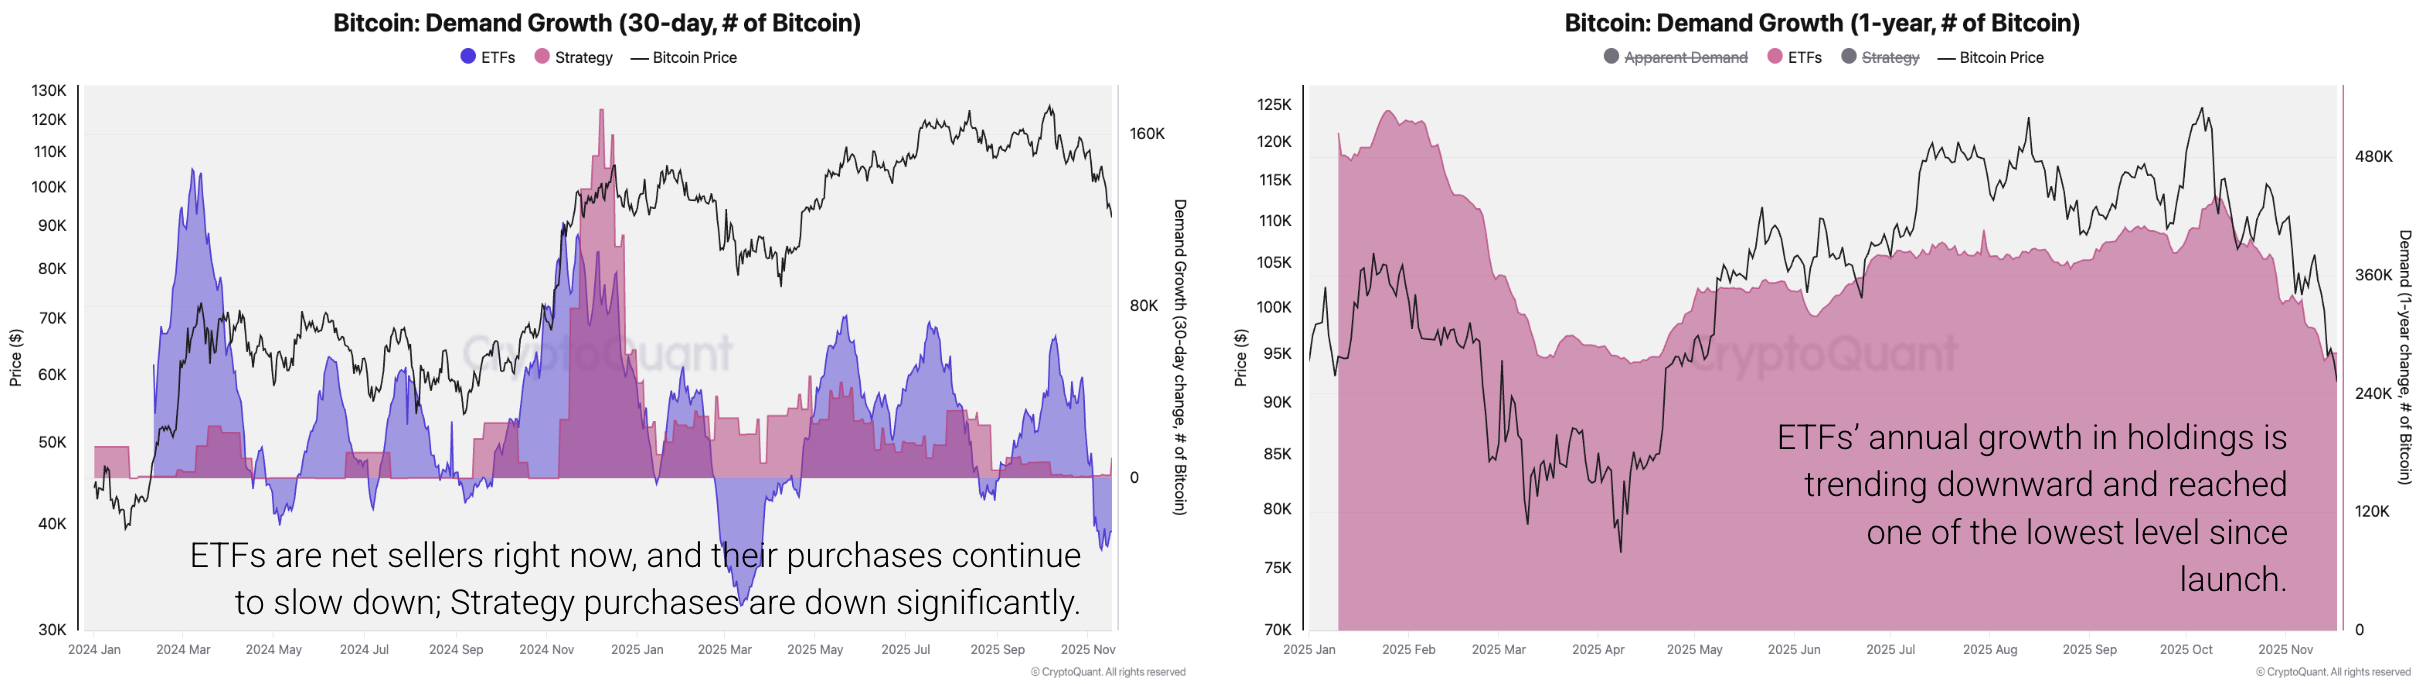
* Today, some market commentators argue that the current cycle would be extended into 2026, mostly given a structural shift of Bitcoin buyers from retail to institutional investors (ETFs and companies), which arguably are more long-term-holding oriented than retail investors and a source of constant demand. Although the structural shift can be true, the demand for Bitcoin from these types of participants can also dry out, as we explained above for Treasury companies. Regarding ETFs, three comments: (1) Their demand for Bitcoin also dries out, even becoming net sellers in some periods, (2) some institutional players buy spot Bitcoin through ETFs not for directional exposure, but to play the basis trade (buy spot, sell futures, pocket the difference). This trade can unwind as the futures-spot difference narrows, in which case they would sell spot Bitcoin, and (3) ETFs are also used by retail investors to get exposure to Bitcoin.
* The Bitcoin bull cycle is not about the halving or a particular timespan; it's about demand growth waves, and we are highly likely to have seen most of this cycle’s demand wave pass. In 2024, Trump’s presidential election victory acted as a major catalyst that pushed Bitcoin above $100K for the first time. In 2025, the launch of several Bitcoin Treasury Companies took Bitcoin above $120K in the summer. Those catalysts are now gone. What would be a catalyst strong enough to reaccelerate Bitcoin demand in 2026? Major developments seem off the cards (US Gov Strategic Bitcoin Reserve) or highly discounted by the market (Fed lowering interest rates further).
* Does this imply a rapid Bitcoin price collapse? No. So far, Bitcoin is experiencing a 28% drawdown and has declined towards major support levels (90K-$92K). Even in bear markets, prices can rally 40%-50% in the span of a few months. However, now that the price of Bitcoin is below its 365-day MA, this level becomes a strong price resistance ($102.6K).
# On-chain | Market Activities
1. Bitcoin market conditions are the most bearish they have been since the current bull cycle started in January 2023, and this price correction differs notably from previous ones. Last week, we showed how CryptoQuant’s Bull Score Index declined to extreme bearish levels of 20 out of 100. On top of this, a key bearish technical signal was set off for Bitcoin as the price broke below its 365-day moving average (MA). A decline below this key technical level was the last bearish signal that marked the final confirmation of the 2022 Bitcoin bear market. It is worth noticing that Bitcoin never broke the 365-day MA during the price corrections of this bull cycle. – [Link](https://cryptoquant.com/community/dashboard/67db8377a2a7203afd398632)
2. We are highly likely to have seen most of this cycle’s demand wave pass. The growth of US-based spot ETFs’ Bitcoin holdings has been decelerating in annual terms, growing by 283K as of today, one of the slowest paces since ETFs were launched. At the same time, Bitcoin purchases by Treasury companies, once an important source of demand for Bitcoin this year, have basically stopped as the market capitalization of each company collapsed 70%-90%+ in the last few months. Additionally, Strategy’s Bitcoin purchases slowed down significantly as the market cap of its common stock declined towards the value of its Bitcoin holdings. Strategy’s monthly purchases are down from a high of 171K BTC in December 2024 to 9.6K BTC as of today. – [Link](https://cryptoquant.com/community/dashboard/66c366531dad4a62a5d42c79)
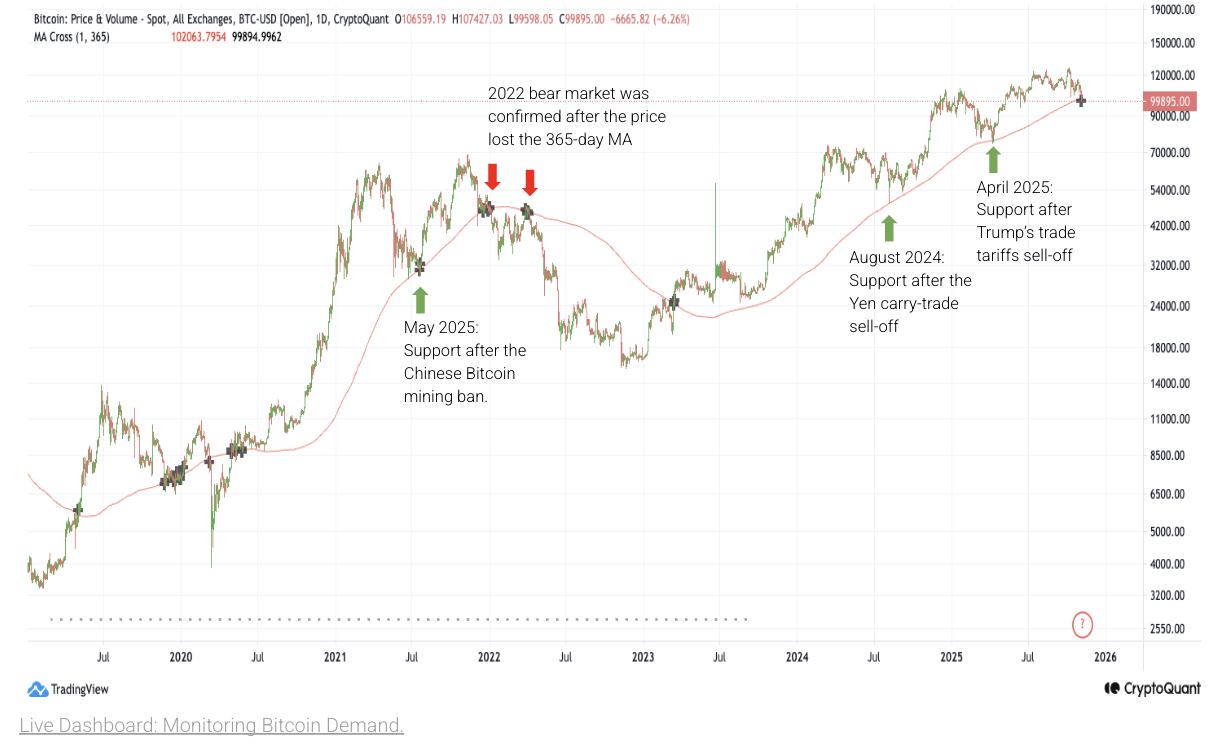
3. The price of Bitcoin has crossed below its 365-day moving average of $102K, a key technical and support level that confirmed the start of the 2022 bear market. The 365-day MA has acted as the ultimate support level so far this bull cycle (green arrows), and was one of the last signals triggered as the bear market began in December 2021-January 2022. Now that the price is below it, the 365-day MA can become a strong resistance level. – [Link](https://cryptoquant.com/prochart/4QVjoyoRK7NNB)
If you have any questions, send us an email at [research@cryptoquant.com](mailto:research@cryptoquant.com)
The information herein was prepared by Team CQ Inc. (a.k.a. CryptoQuant) and is for informational purposes only and is not intended to constitute a recommendation, investment advice of any kind, or an offer to buy or sell securities or other assets. Please perform your own research and consult a qualified advisor to see if digital assets are an appropriate investment option.
This information is not intended for distribution to, or use by, any person or entity in any jurisdiction or country where such distribution or use would be contrary to local law or regulation. Persons accessing this information are required to inform themselves about and observe such restrictions.
Digital assets are speculative and highly volatile, can become illiquid at any time, and are for investors with a high-risk tolerance. Investors in digital assets could lose the entire value of their investment. Team CQ Inc. does not provide tax, legal, investment, or accounting advice. This material is not intended to provide, and should not be relied on, for tax, legal, or accounting advice. Tax laws and regulations are complex and subject to change. You should consult your own tax, legal, and accounting advisors before engaging in any transaction.
© 2025 Team CQ Inc. All rights reserved.

View original →The Bitcoin market remains in an extremely bearish phase as the price declined towards the $100K mark. Three factors contributed to the shift in sentiment: (1) Price lost momentum after the October 10 “Big Liquidation” event, with momentum metrics turning bearish; (2) spot demand entered contraction on October 8 (though it has since rebounded); and (3) stablecoin liquidity growth slowed, failing to sustain its prior trend.
* Long-term holder (LTH) selling hit one of the highest levels so far this year as prices reached new highs, and at the time, demand started to contract. Bitcoin LTHs have sold a total of ~815K Bitcoin in the last 30 days, the highest level since January 2024, adding downward pressure to the price. Moreover, this selling has come at a time when spot demand weakened as seen in net outflows of Bitcoin from ETFs, negative Coinbase price premium and a contraction in apparent demand. In previous episodes of high LTH selling, demand was strong enough to absorb this supply at higher prices, but this is not the case currently.
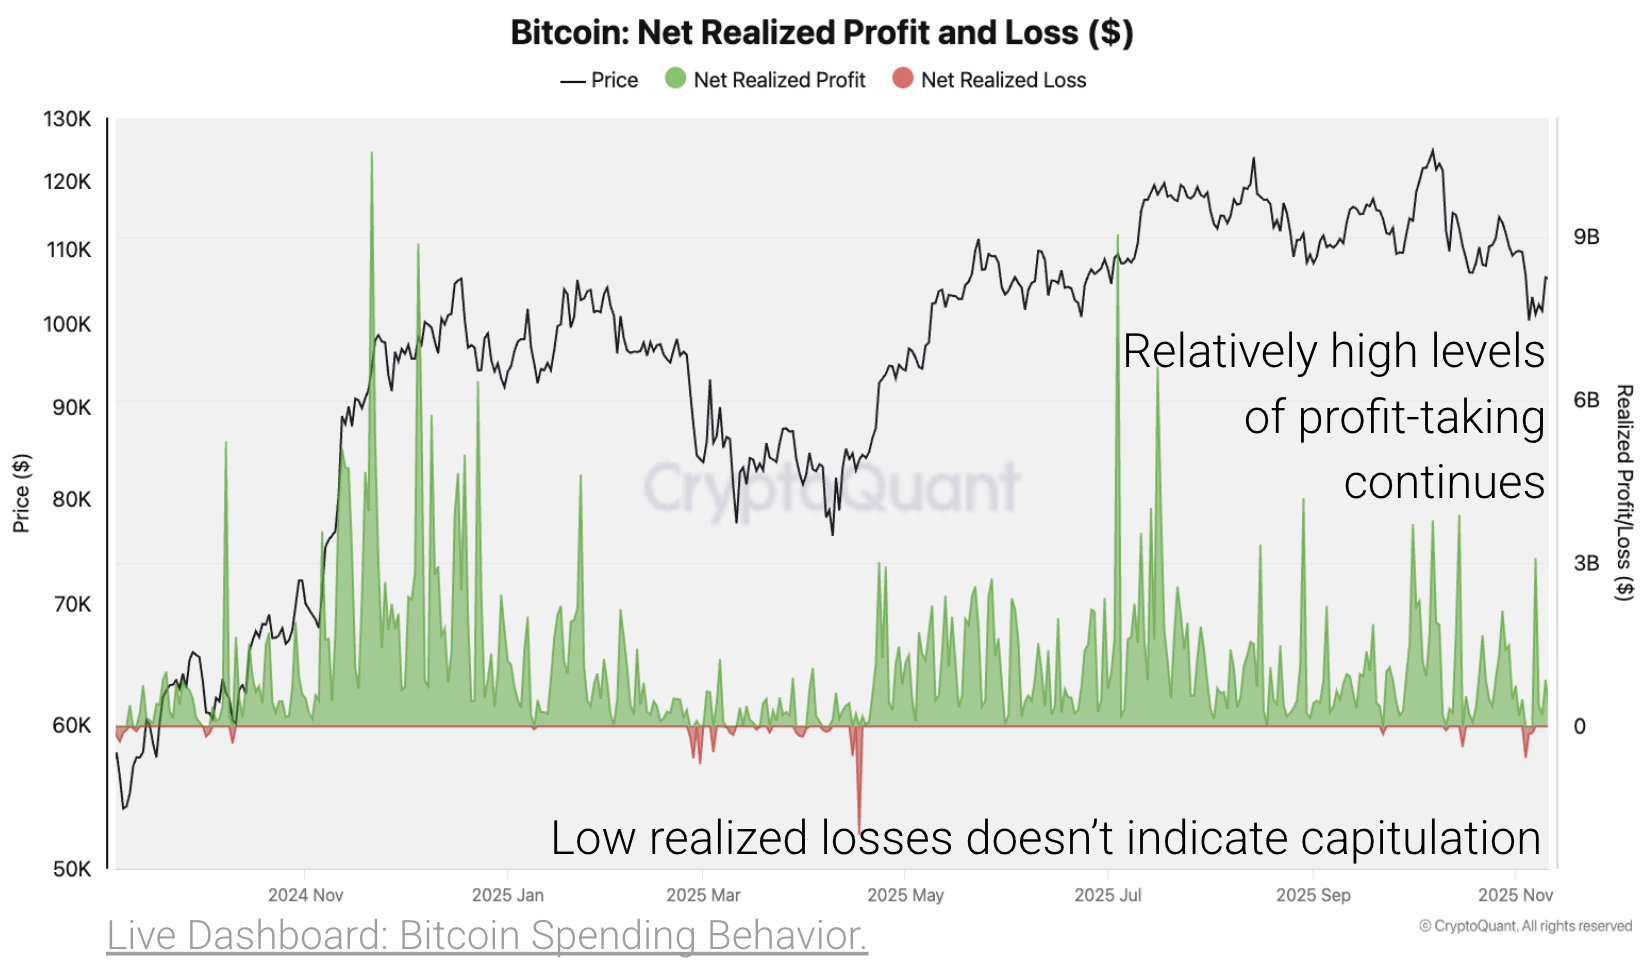
* Bitcoin holders continue to sell to take profits, and realized losses remain low. Bitcoin holders realized net profits of $3.0 billion on November 7, a relatively high level similar to profits realized during October. This indicates that selling pressure could remain high. Moreover, net realized losses have been practically non-existent, indicating that holders have not capitulated, a necessary condition to form a price bottom.
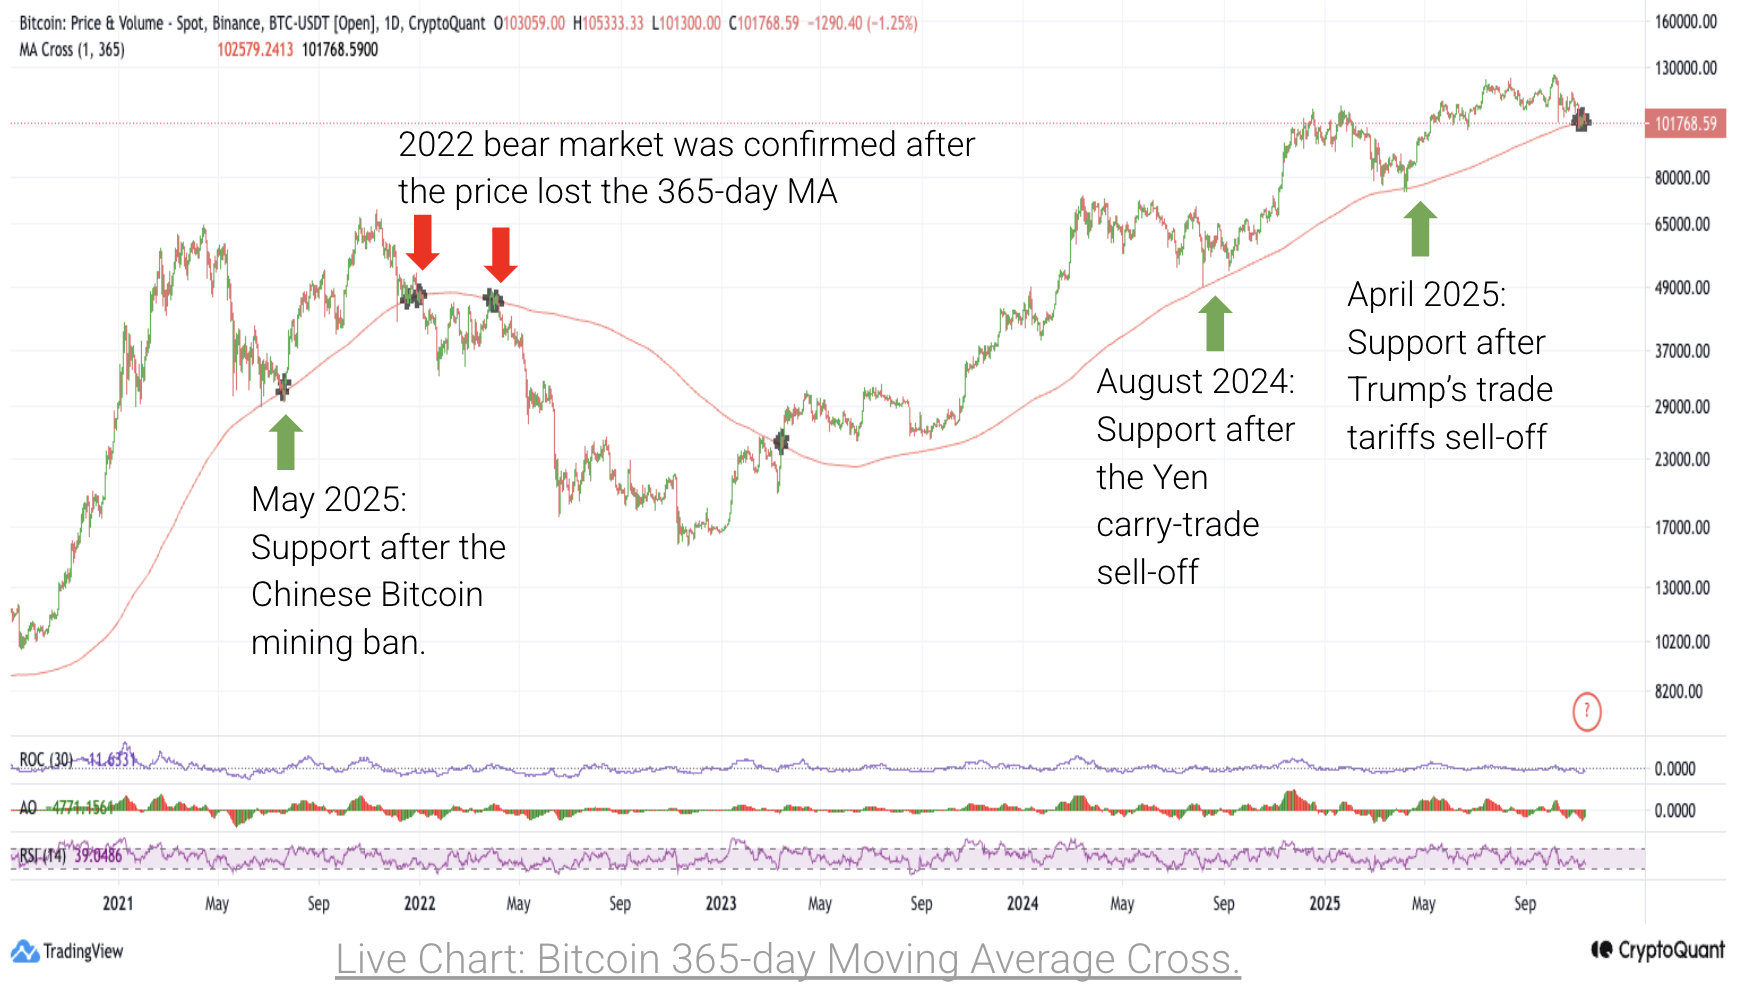
* The price of Bitcoin continues to hover up and down its 365-day moving average of $102K, a key technical and psychological support level. The 365-day MA has acted as the ultimate support level so far this bull cycle, and was one of the last signals triggered as the bear market began in December 2021-January 2022. Failure to reclaim the 365-day MA may accelerate a deeper correction.
# On-chain | Market Activities
1. The Bitcoin market remains in an extremely bearish phase as the price declined towards the $100K mark. CryptoQuant’s Bull Score Index has declined from 80 on October 6, when Bitcoin reached its latest ATH of $126K, to 20 today, as Bitcoin fell below $100K for the first time since June 22. The Index first indicated a bearish phase on October 10, when Bitcoin closed at $113K – [Link](https://cryptoquant.com/community/dashboard/67db8377a2a7203afd398632)
The shift to bearish conditions has been driven by three main factors:
* Price lost upward momentum after the October 10 “Big Liquidation” event (momentum metrics turned bearish).
* Spot demand contracted starting October 8, though it has since begun to recover.
* Stablecoin liquidity growth slowed down and failed to keep its upward trend.
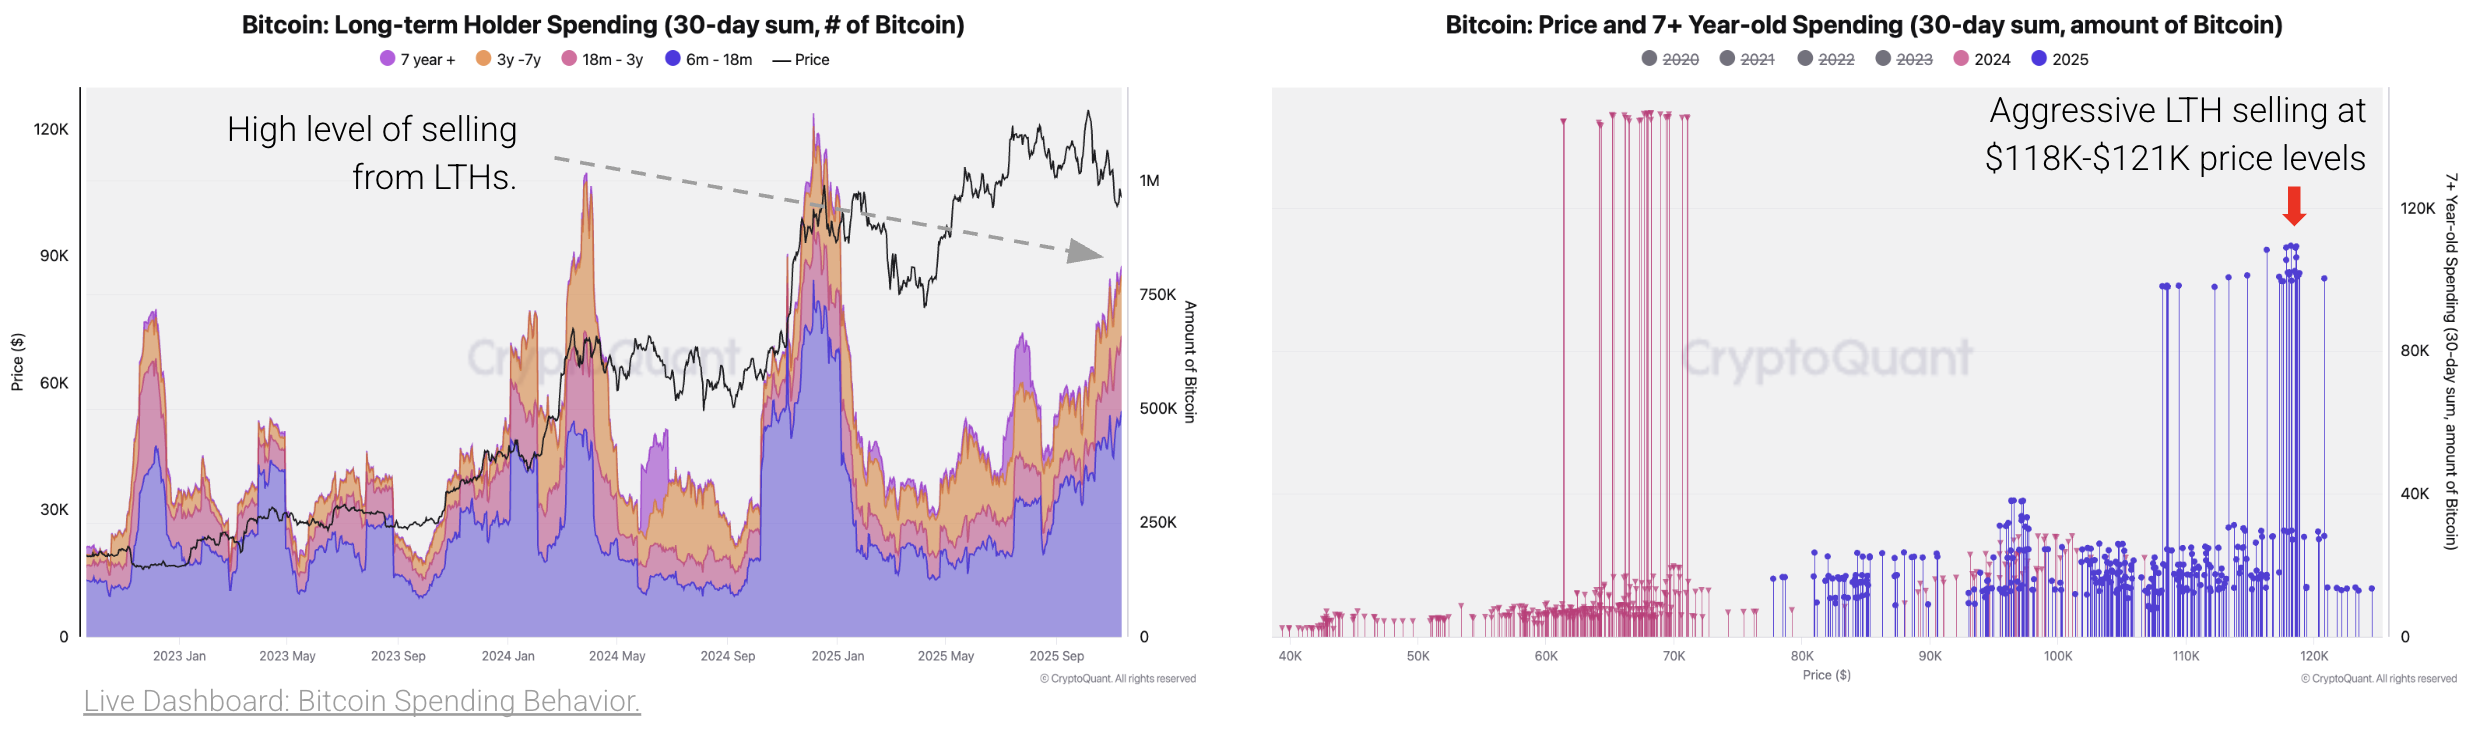
2. Long-term holder (LTH) selling hit one of the highest levels so far this year as prices reached new highs, and at the time, demand started to contract. Bitcoin LTHs have sold a total of ~815K Bitcoin in the last 30 days, the highest level since January 2024, adding downward pressure to the price. Moreover, this selling has come at a time that spot demand weakened/contracted as seen in net outflows of Bitcoin from ETFs, negative Coinbase price premium and a contraction in apparent demand. In previous episodes of high LTH selling, demand was strong enough to absorb this supply at higher prices, but this is not the case currently. LTHs sold aggressively at the $118K-$121K price zone. – [Link](https://cryptoquant.com/community/dashboard/638a6cffedf9756d0ec3a7c9)
3. Indeed, Bitcoin holders continue to sell to take profits and realized losses remain low. Bitcoin holders realized net profits of $3.0 billion on November 7, a relatively high level similar to profits realized during October. This indicates that selling pressure could remain high. Moreover, net realized losses have been practically non-existent, indicating that holders have not capitulated, a necessary condition to form a price bottom. – [Link](https://cryptoquant.com/community/dashboard/638a6cffedf9756d0ec3a7c9)
4. The price of Bitcoin continues to hover up and down its 365-day moving average of $102K, a key technical and psychological support level. The 365-day MA has acted as the ultimate support level so far this bull cycle (green arrows), and was one of the last signals triggered as the bear market began in December 2021-January 2022. Failure to reclaim the 365-day MA may accelerate a deeper correction. – [Link](https://cryptoquant.com/prochart/4QVjoyoRK7NNB)
Notably, Bitcoin has closed below the 365-day MA on several occasions during the current period, a situation that did not happen previously in this bull market.
If enough selling pressure emerges, the next price supports would be:
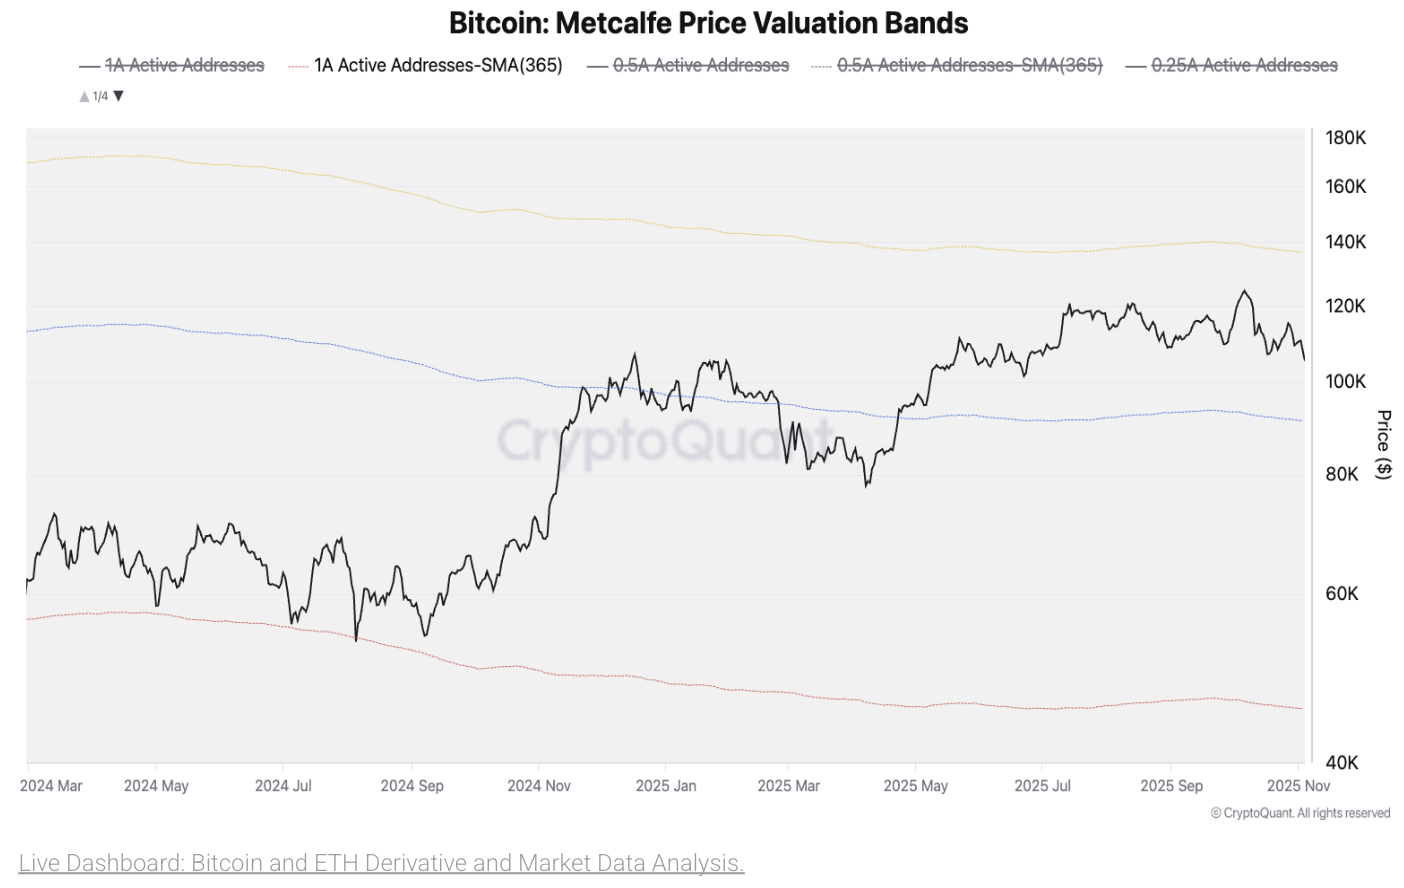
* The 2x Metcalfe Network Value band at $91K.
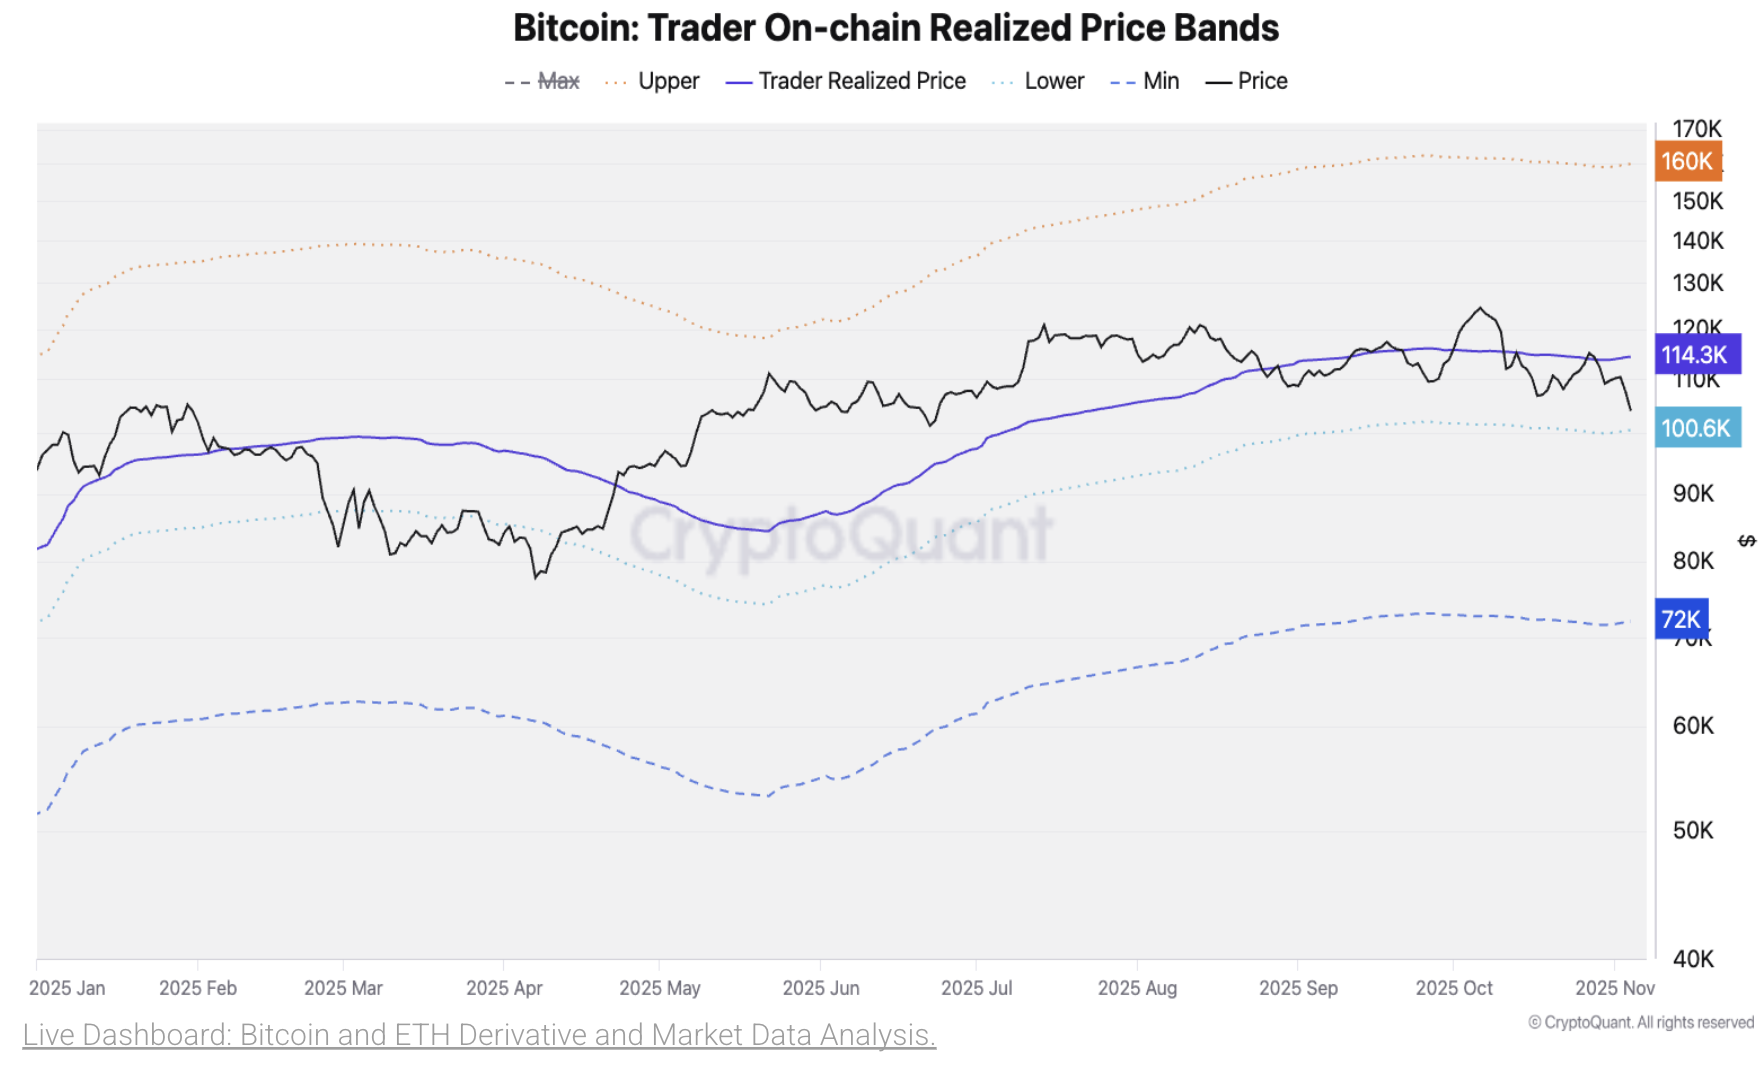
* The Traders’ minimum price band at $72K.
If you have any questions, send us an email at [research@cryptoquant.com](mailto:research@cryptoquant.com)
The information herein was prepared by Team CQ Inc. (a.k.a. CryptoQuant) and is for informational purposes only and is not intended to constitute a recommendation, investment advice of any kind, or an offer to buy or sell securities or other assets. Please perform your own research and consult a qualified advisor to see if digital assets are an appropriate investment option.
This information is not intended for distribution to, or use by, any person or entity in any jurisdiction or country where such distribution or use would be contrary to local law or regulation. Persons accessing this information are required to inform themselves about and observe such restrictions.
Digital assets are speculative and highly volatile, can become illiquid at any time, and are for investors with a high-risk tolerance. Investors in digital assets could lose the entire value of their investment. Team CQ Inc. does not provide tax, legal, investment, or accounting advice. This material is not intended to provide, and should not be relied on, for tax, legal, or accounting advice. Tax laws and regulations are complex and subject to change. You should consult your own tax, legal, and accounting advisors before engaging in any transaction.
© 2025 Team CQ Inc. All rights reserved.

View original →In previous [reports](https://cryptoquant.com/insights/research/68ee82729792d00047643c46-14-October-2025-Deleveraging-Aftershock-Bitcoin-Fundamentals-Weaken-but-Whale-Ac), we discussed how Bitcoin fundamentals had weakened, leading to a correction towards the low $100K levels. Indeed, [CryptoQuant’s Bull Score Index](https://cryptoquant.com/community/dashboard/67db8377a2a7203afd398632) has fallen to zero (extremely bearish) for the first time since June 2022.
* As fundamentals remain soft, this week the price of Bitcoin declined below $100K for the first time in months and sits around key support levels that would trigger a bigger correction if broken. For example:
* The 365-day moving average. The price of Bitcoin is now below its 365-day moving average of $102K, a key technical and psychological support level. The 365-day MA has acted as the ultimate support level so far this bull cycle, and was one of the last signals triggered as the bear market began in December 2021-January 2022. A failure to cross back above the 365-day MA quickly could trigger a much larger correction in Bitcoin's price.
* The Traders’ On-chain Realized Price. The Traders’ On-chain Realized Price Bands suggest Bitcoin could decline towards $72K (min band) in a period of 1-2 months if the price doesn’t reclaim the lower band quickly ($100K). So far this bull cycle, the Trader Realized Price lower band has been a support for the price of Bitcoin, as traders realize losses by selling. However, if enough selling pressure emerges, the next price support would be the Traders’ minimum price band, which sits at $72K today.
* The network valuation price. CME Under a network valuation framework the support lies at around $91K. This valuation is based on Metcalfe's law, which states that the value of a network is proportional to the number of users in the network. In this case, the support would be found at the 2x Metcalfe-Value band. The price of Bitcoin traded around this band from November 2024 to May 2025.
# On-chain | Market Activities
1. The price of Bitcoin has declined below $100K for the first time since June 23rd, and it is now below its 365-day moving average of $102K, a key technical and psychological support level. The 365-day MA has acted as the ultimate support level so far this bull cycle (green arrows), and was one of the last signals triggered as the bear market began in December 2021-January 2022. Failure to reclaim the 365-day MA soon could accelerate a deeper correction. – [Link](https://cryptoquant.com/asset/btc/chart/market-data/price-volume?market=spot&exchange=all_exchange&symbol=btc_usd&window=DAY&sma=0&ema=0&metricScale=log)
2. The Traders’ On-chain Realized Price Bands suggest Bitcoin could decline towards $72K (min band) in a period of 1-2 months if the price doesn’t reclaim the lower band quickly ($100K). Throughout this bull cycle, the lower band has acted as support, as traders tend to sell and realize losses near this level. However, if enough selling pressure emerges, the next price support would be the Traders’ minimum price band, which sits at $72K today. – [Link](https://cryptoquant.com/analytics/query/657b35ef21681e353192def5?v=66afbb2a92025e70b1143efe)
3. Under a network valuation framework, the support lies at around $91K. This valuation is derived from Metcalfe’s Law, which posits that a network’s value is proportional to the number of users in the network. In this case, the 2x Metcalfe Value band (dotted blue line) serves as the key support level. The price of Bitcoin traded around this band from November 2024 to May 2025. – [Link](https://cryptoquant.com/analytics/query/645d2594b1620f2a58fc7594?v=645d2dd0b1620f2a58fca6b3)
If you have any questions, send us an email at [research@cryptoquant.com](mailto:research@cryptoquant.com)
The information herein was prepared by Team CQ Inc. (a.k.a. CryptoQuant) and is for informational purposes only and is not intended to constitute a recommendation, investment advice of any kind, or an offer to buy or sell securities or other assets. Please perform your own research and consult a qualified advisor to see if digital assets are an appropriate investment option.
This information is not intended for distribution to, or use by, any person or entity in any jurisdiction or country where such distribution or use would be contrary to local law or regulation. Persons accessing this information are required to inform themselves about and observe such restrictions.
Digital assets are speculative and highly volatile, can become illiquid at any time, and are for investors with a high-risk tolerance. Investors in digital assets could lose the entire value of their investment. Team CQ Inc. does not provide tax, legal, investment, or accounting advice. This material is not intended to provide, and should not be relied on, for tax, legal, or accounting advice. Tax laws and regulations are complex and subject to change. You should consult your own tax, legal, and accounting advisors before engaging in any transaction.
© 2025 Team CQ Inc. All rights reserved.

View original →Bearish(Nuanced)BTCETH
10/29/2025 There is a noticeable slowdown in US investor demand for Bitcoin and Ethereum, both in spot and in derivative markets. After a strong rally in late September that pushed Bitcoin to $126K and ETH near $5K, investor appetite for further exposure has waned. ETF inflows, spot exchange premiums, and futures basis metrics all indicate reduced enthusiasm from US institutions and retail investors alike, suggesting that the current phase reflects profit-taking and cautious positioning rather than renewed accumulation.
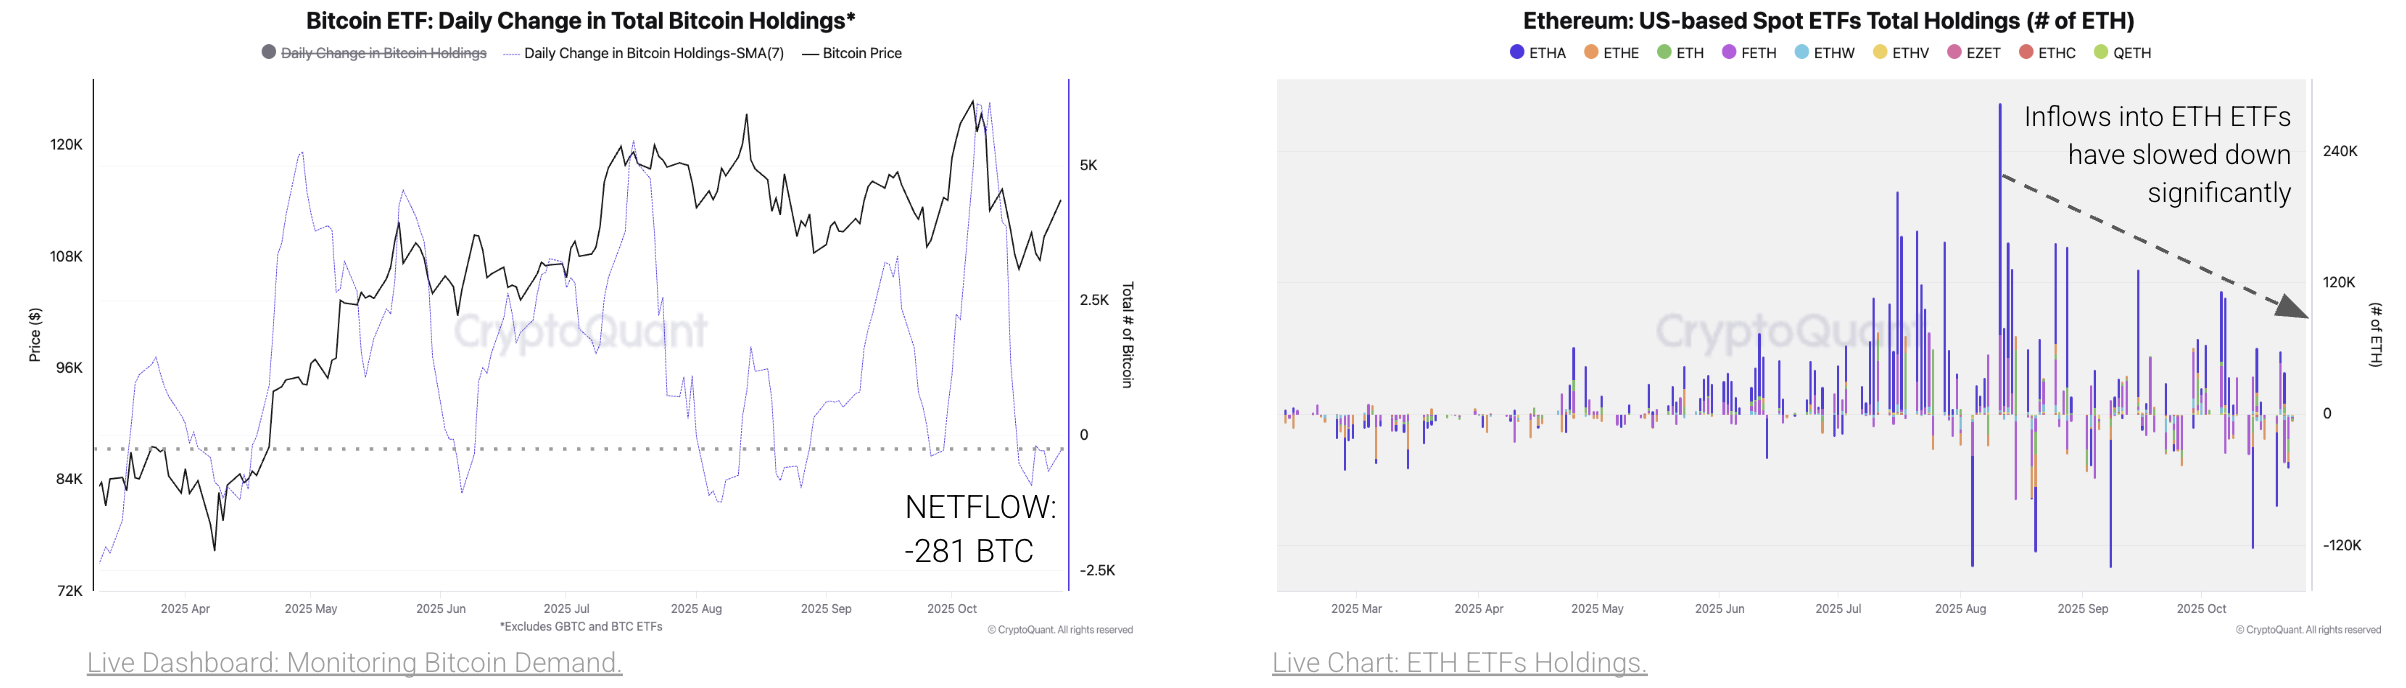
* US spot Bitcoin ETFs have turned net sellers, with a seven-day average outflow of 281 BTC, one of the weakest readings since April. ETH ETF inflows have nearly stalled since mid-August, underscoring subdued investor confidence.
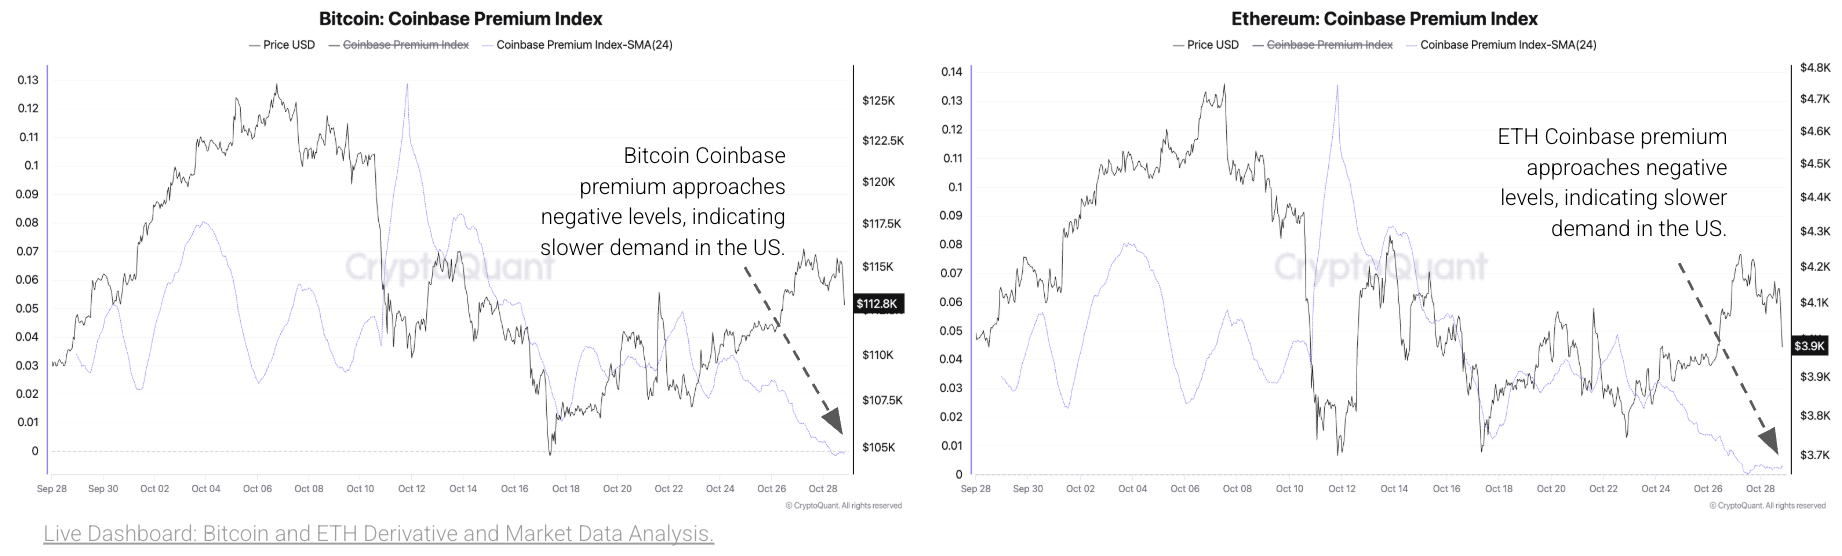
* Spot demand in US-based crypto exchanges has slowed down. The Coinbase premium for both Bitcoin and Ethereum has approached zero, showing a slowdown in US spot demand. Historically, price rallies coincide with positive premiums, so this flattening indicates reduced domestic buying pressure.
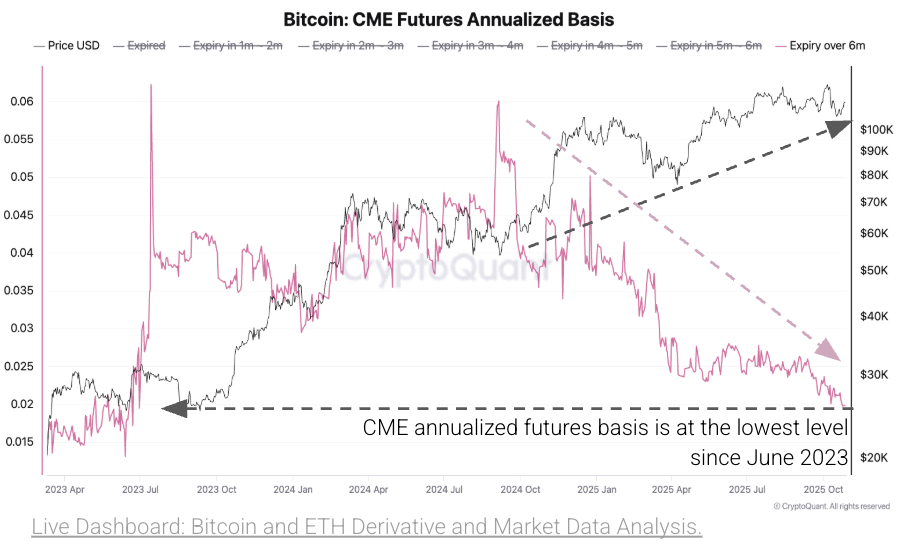
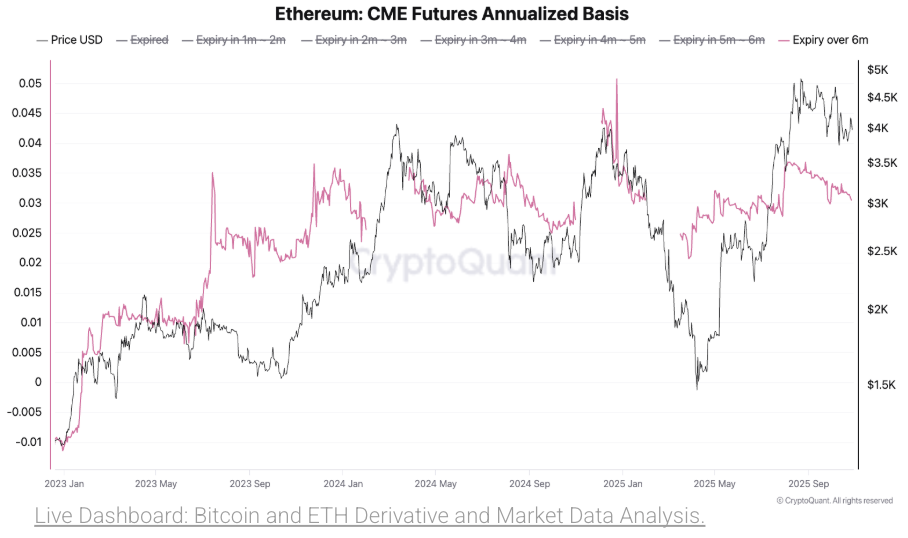
* Investor behavior is similar in the futures market. CME futures annualized basis for Bitcoin fell to 1.98%, the lowest in over two years, while ETH’s six-month basis dropped to 3.0%—levels not seen since July—indicating weaker demand for leveraged exposure.
* The data collectively point to a phase of cooling sentiment among US investors after September’s highs, suggesting that market participants are waiting for new catalysts before re-engaging with risk.
# On-chain | Market Activities
1. Bitcoin and Ethereum spot demand from US-based ETFs remains subdued. The seven-day average net outflow from Bitcoin spot ETFs stands at 281 BTC, one of the weakest readings since April. The negative reading implies that ETFs have been net sellers of Bitcoin in the last week. Meanwhile, ETH inflows into US-based spot ETFs have been slowing down significantly since mid-August and are now close to zero. The ETF data suggests that investors have become more cautious about getting more exposure to Bitcoin and ETH after the late September rally that took Bitcoin to a new all-time high of $126K and ETH to ~$5K. – [Link (1)](https://cryptoquant.com/community/dashboard/66c366531dad4a62a5d42c79?e=66c36e4097b878155e41e74c), [Link (2)](https://cryptoquant.com/analytics/query/68ae1abbe6d63121c5fac12f)
2. Bitcoin and ETH spot demand on US crypto exchanges has also decelerated. The slowdown can be seen in the Bitcoin and ETH Coinbase price premium–24hr moving average–approaching zero for the first time since September 8. Price rallies are usually accompanied by a positive Coinbase premium, indicating higher prices on Coinbase than in other crypto exchanges as US demand grows faster. – [Link](https://cryptoquant.com/community/dashboard/63ebfa1e356a4153502486b9)
3. US investor demand in the Bitcoin futures market is also at low levels. This is evident in the downward trend of the CME’s Futures annualized basis, which has fallen to 1.98%, the lowest level in more than two years. This situation indicates that the demand to hold Bitcoin futures that expire in 6 months or more is lower than in recent months and that it has declined as Bitcoin spot prices rallied from $80K to $120K. – [Link](https://cryptoquant.com/community/dashboard/63ebfa1e356a4153502486b9)
Ethereum futures demand has also declined, though less sharply than Bitcoin’s. The CME Ethereum futures annualized basis is at 3.0% currently for contracts expiring in 6 months or longer. This marks one of the lowest levels since July 29. – [Link](https://cryptoquant.com/community/dashboard/63ebfa1e356a4153502486b9)
If you have any questions, send us an email at [research@cryptoquant.com](mailto:research@cryptoquant.com)
The information herein was prepared by Team CQ Inc. (a.k.a. CryptoQuant) and is for informational purposes only and is not intended to constitute a recommendation, investment advice of any kind, or an offer to buy or sell securities or other assets. Please perform your own research and consult a qualified advisor to see if digital assets are an appropriate investment option.
This information is not intended for distribution to, or use by, any person or entity in any jurisdiction or country where such distribution or use would be contrary to local law or regulation. Persons accessing this information are required to inform themselves about and observe such restrictions.
Digital assets are speculative and highly volatile, can become illiquid at any time, and are for investors with a high-risk tolerance. Investors in digital assets could lose the entire value of their investment. Team CQ Inc. does not provide tax, legal, investment, or accounting advice. This material is not intended to provide, and should not be relied on, for tax, legal, or accounting advice. Tax laws and regulations are complex and subject to change. You should consult your own tax, legal, and accounting advisors before engaging in any transaction.
© 2025 Team CQ Inc. All rights reserved.

View original →Bullish(Nuanced)BTC
10/23/2025 Current on-chain data indicate that while Bitcoin’s short-term momentum is weakening, the long-term structural demand remains intact. The bull cycle shows signs of late-stage maturity rather than a definitive end. The Dolphin cohort—comprising ETFs, corporations, and large holders—remains the anchor of this cycle’s demand structure. However, the next few weeks will be critical: a reacceleration in their accumulation could push Bitcoin to new highs, while continued slowdown risks deepening the correction.
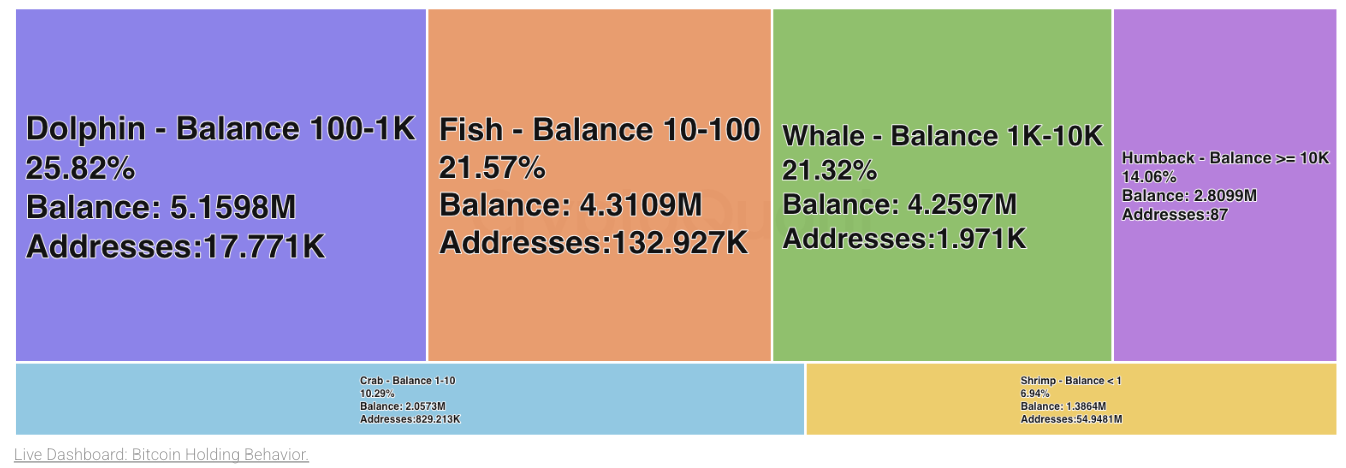
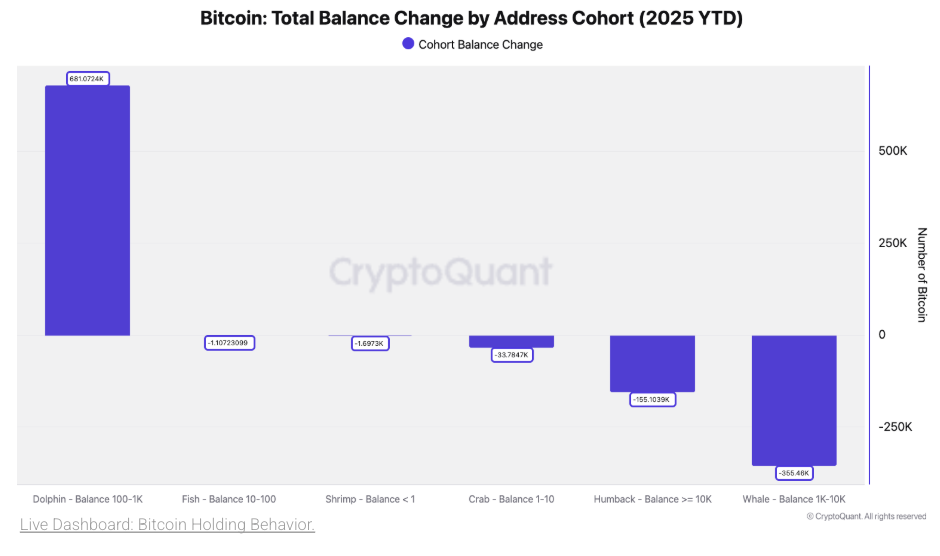
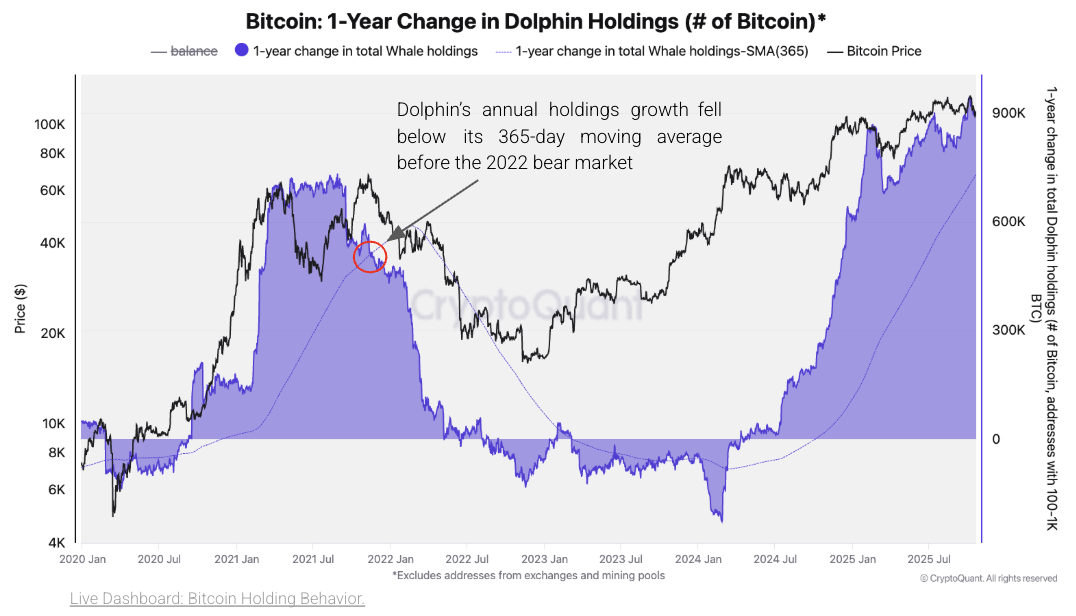
* Dolphin addresses (balance of 100-1,000 BTC) now hold the largest share of Bitcoin, representing 26% of the supply or approximately 5.16 million BTC. The concentration of holdings in this cohort suggests that their behavior plays a decisive role in shaping market direction as a growing accumulation from this group historically aligns with upward price momentum, while a slowdown often precedes distribution or correction phases in prior cycles. This cohort has added 681K BTC in 2025, while all other groups have reduced holdings—confirming institutional dominance.
* The annual growth rate of Dolphin’s holdings remains positive, suggesting the bull cycle is not yet over. Dolphin’s annual holdings growth is 907K BTC today, above the current 365-day moving average of 730K BTC.
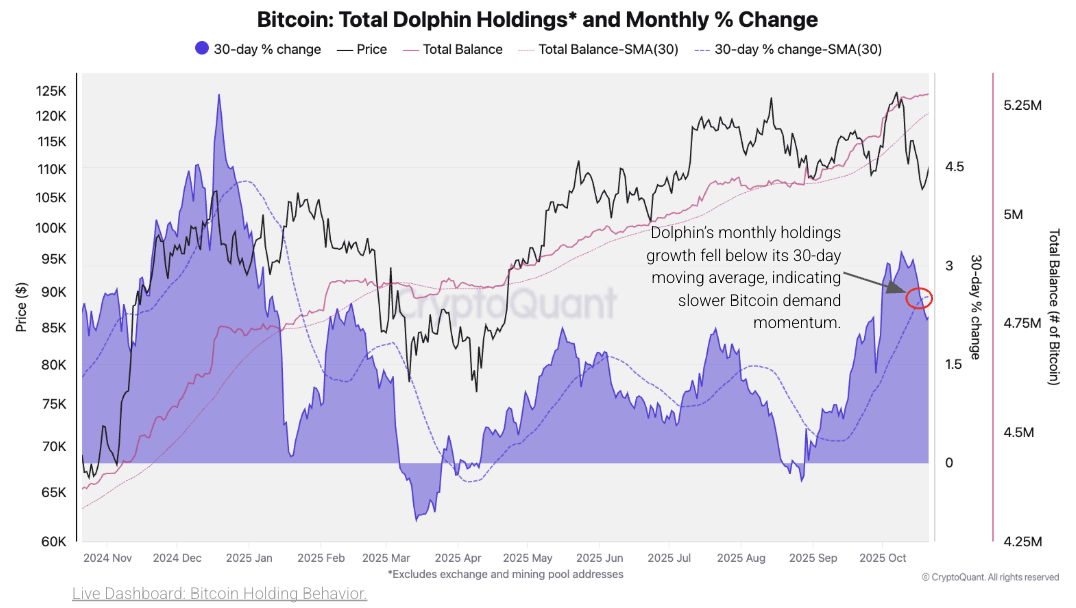
* However, short-term momentum has weakened and renewed accumulation is needed for Bitcoin to retest and surpass $126K. Historically, such behavior precedes periods of consolidation or mild corrections within ongoing cycles. For the bull trend to resume and push Bitcoin to new all-time highs, the monthly accumulation rate must accelerate again.
* Short-term price action remains in correction mode with resistance at $115k and support at $100K. Below $100K a major correction towards $75k could be triggered.
# On-chain | Market Activities
1. The Dolphin balance cohort has become the most important on-chain group to monitor. The Dolphin cohort—addresses holding between 100 and 1,000 BTC—is currently the largest group by total Bitcoin balance, owning approximately 5.16 million BTC, which accounts for about 26% of total circulating supply. This dominance highlights the growing importance of mid-to-large holders, particularly entities such as ETFs and Bitcoin treasuries, which fall within this address balance range. The concentration of holdings in this cohort suggests that their behavior plays a decisive role in shaping market direction as a growing accumulation from this group historically aligns with upward price momentum, while a slowdown often precedes distribution or correction phases in prior cycles. – [Link](https://cryptoquant.com/community/dashboard/638e2fd9f1ce177db56da127)
2. In 2025, the Dolphin cohort has been the primary accumulator, increasing its total balance by over 681,000 BTC, while all other address groups have seen net declines in holdings. This divergence shows that large investors and institutional entities have been absorbing supply from smaller market participants, providing a strong underlying demand base during the recent cycle. However, as other cohorts (whales, crabs, shrimps) reduce exposure, the sustainability of the bull trend increasingly depends on continued Dolphin accumulation. If this group’s pace of accumulation slows, the market could transition from expansion to consolidation. – [Link](https://cryptoquant.com/community/dashboard/638e2fd9f1ce177db56da127)
3. Historically, the end of a Bitcoin bull cycle has coincided with a decline in the annual growth rate of Dolphin holdings. During the 2021 peak, the cohort’s annual growth fell below its 365-day moving average, signaling a reversal in demand and a subsequent price correction. In contrast, the current data shows the 1-year growth in Dolphin balances remains above its 365-day moving average, indicating that long-term accumulation is still intact. This suggests that the structural demand from key entities—such as ETFs and corporate treasuries—has not yet deteriorated, and the market may still be in the late stages of a bull cycle rather than at its conclusion. – [Link](https://cryptoquant.com/community/dashboard/638e2fd9f1ce177db56da127)
As of today, Dolphin holdings are growing at an annualized rate of 907K BTC, well above the 365-day moving average of 730K BTC.
4. On shorter time frames, however, momentum appears to be softening. The Dolphin cohort’s 30-day balance growth has recently fallen below its 30-day moving average, implying that short-term demand is waning. This slowdown coincides with the recent Bitcoin price correction from the $126K peak. Historically, such behavior precedes periods of consolidation or mild corrections within ongoing cycles. For the bull trend to resume and push Bitcoin to new all-time highs, the monthly accumulation rate must accelerate again—confirming renewed institutional and ETF inflows. – [Link](https://cryptoquant.com/community/dashboard/638e2fd9f1ce177db56da127)
If you have any questions, send us an email at [research@cryptoquant.com](mailto:research@cryptoquant.com)
The information herein was prepared by Team CQ Inc. (a.k.a. CryptoQuant) and is for informational purposes only and is not intended to constitute a recommendation, investment advice of any kind, or an offer to buy or sell securities or other assets. Please perform your own research and consult a qualified advisor to see if digital assets are an appropriate investment option.
This information is not intended for distribution to, or use by, any person or entity in any jurisdiction or country where such distribution or use would be contrary to local law or regulation. Persons accessing this information are required to inform themselves about and observe such restrictions.
Digital assets are speculative and highly volatile, can become illiquid at any time, and are for investors with a high-risk tolerance. Investors in digital assets could lose the entire value of their investment. Team CQ Inc. does not provide tax, legal, investment, or accounting advice. This material is not intended to provide, and should not be relied on, for tax, legal, or accounting advice. Tax laws and regulations are complex and subject to change. You should consult your own tax, legal, and accounting advisors before engaging in any transaction.
© 2025 Team CQ Inc. All rights reserved.

View original →Bullish(Nuanced)BTC
10/14/2025 Despite the structural weakening in Bitcoin’s short-term fundamentals and price momentum, liquidity conditions and large investor accumulation remain supportive. A sustained break above the Traders’ Realized Price ($115K) would confirm renewed strength and could mark the resumption of the broader upward trend.
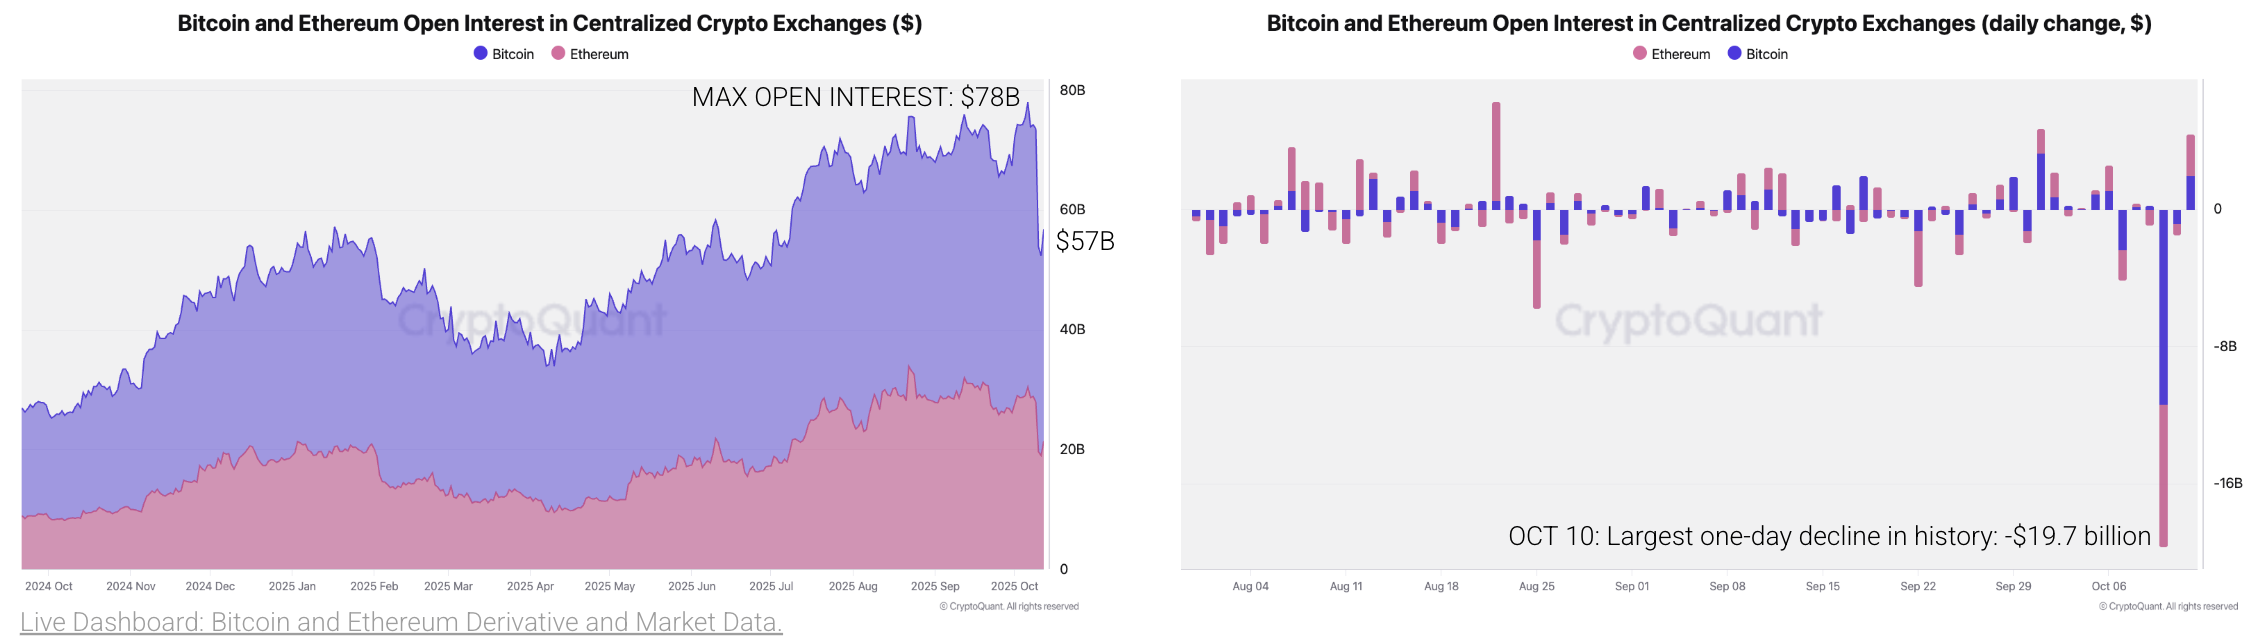
* Record Deleveraging Event. The crypto market experienced its largest-ever deleveraging event last week, wiping out $21 billion in Bitcoin and Ethereum open interest. The sharp liquidation followed escalating U.S.–China trade tensions and triggered a 7% and 12% price drop in Bitcoin and Ethereum, respectively.
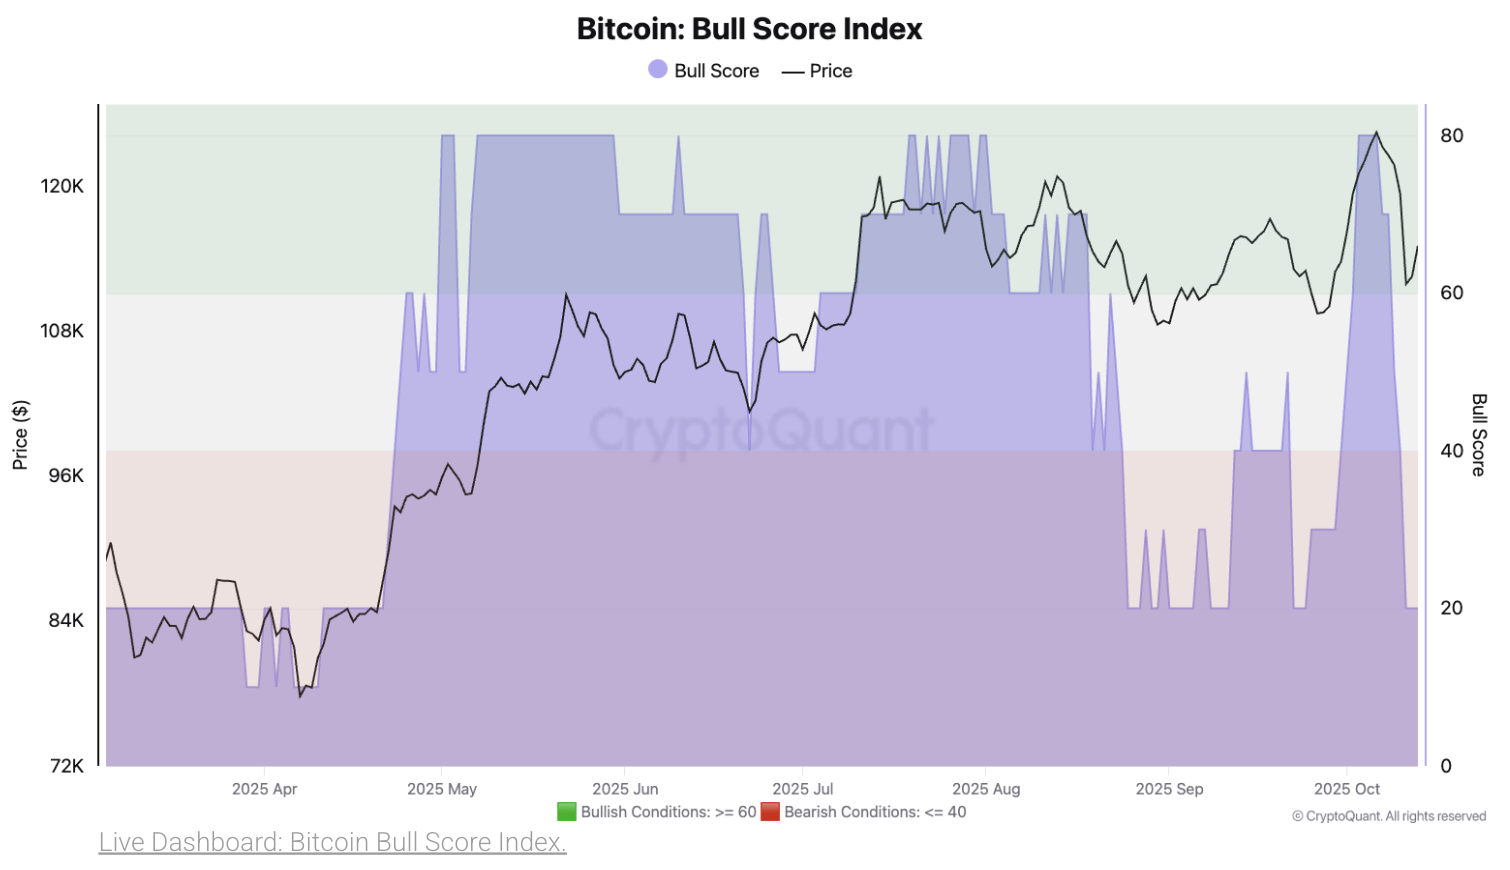
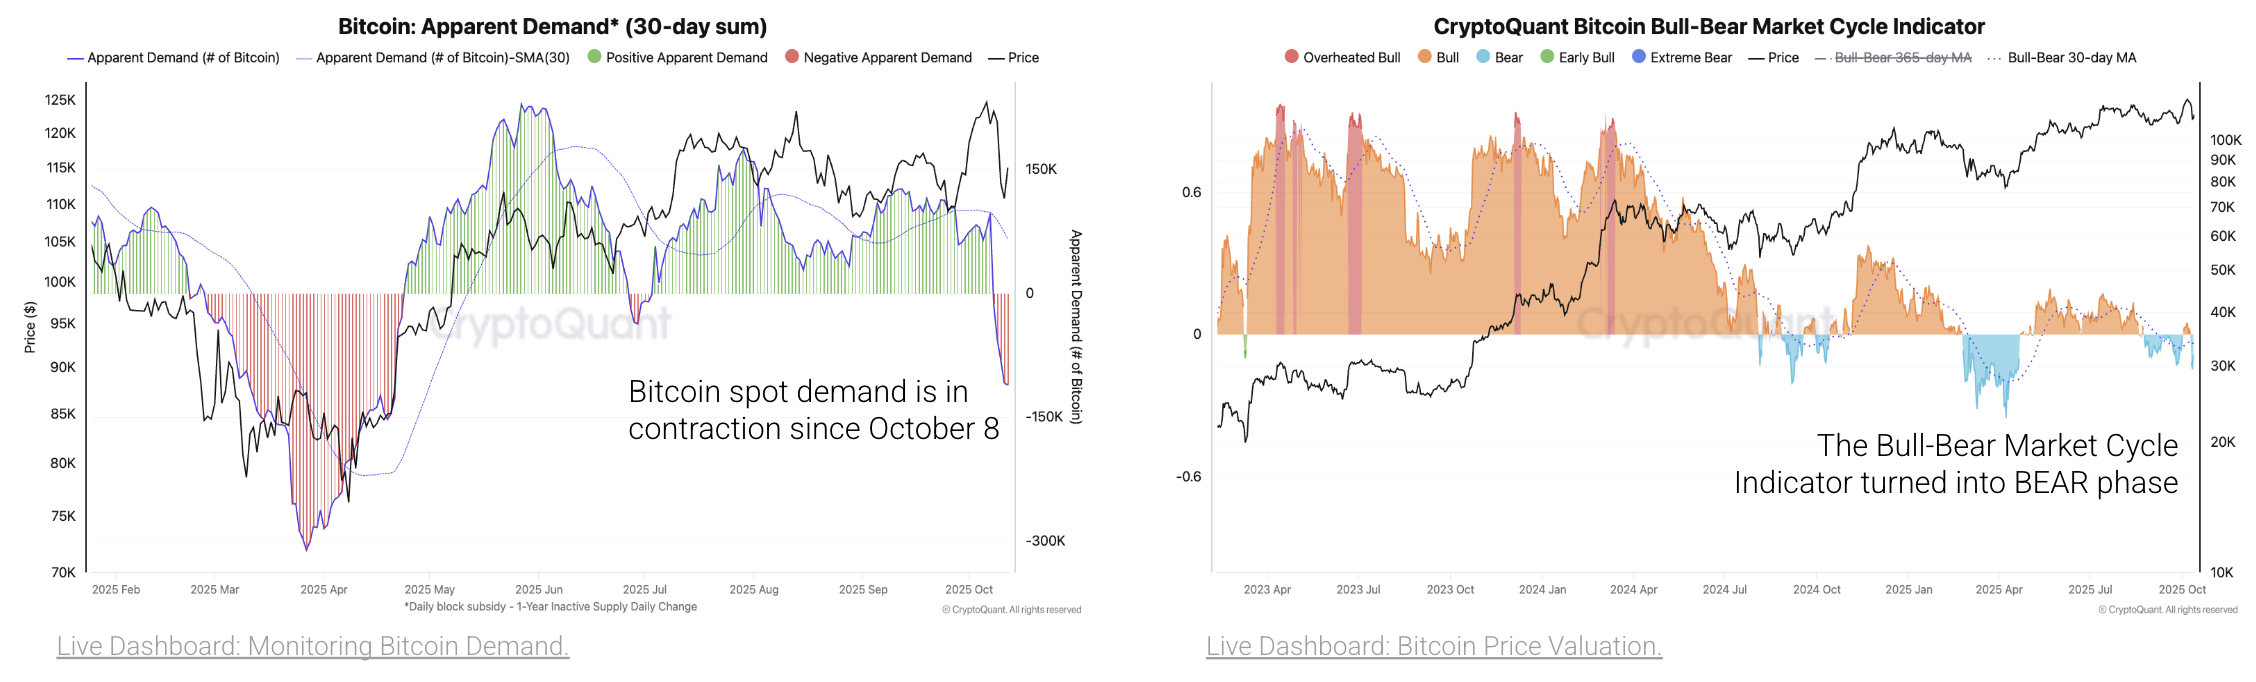
* Weakened Fundamentals. Bitcoin’s Bull Score Index dropped from 80 to 20, signaling a shift into bearish conditions as on-chain fundamentals deteriorated. Indeed, Bitcoin’s Apparent Demand metric shows a 30-day decline of 111K BTC, the steepest contraction since April, while CryptoQuant’s Bull-Bear Market Cycle Indicator has turned into the BEAR phase, confirming weakening price momentum.
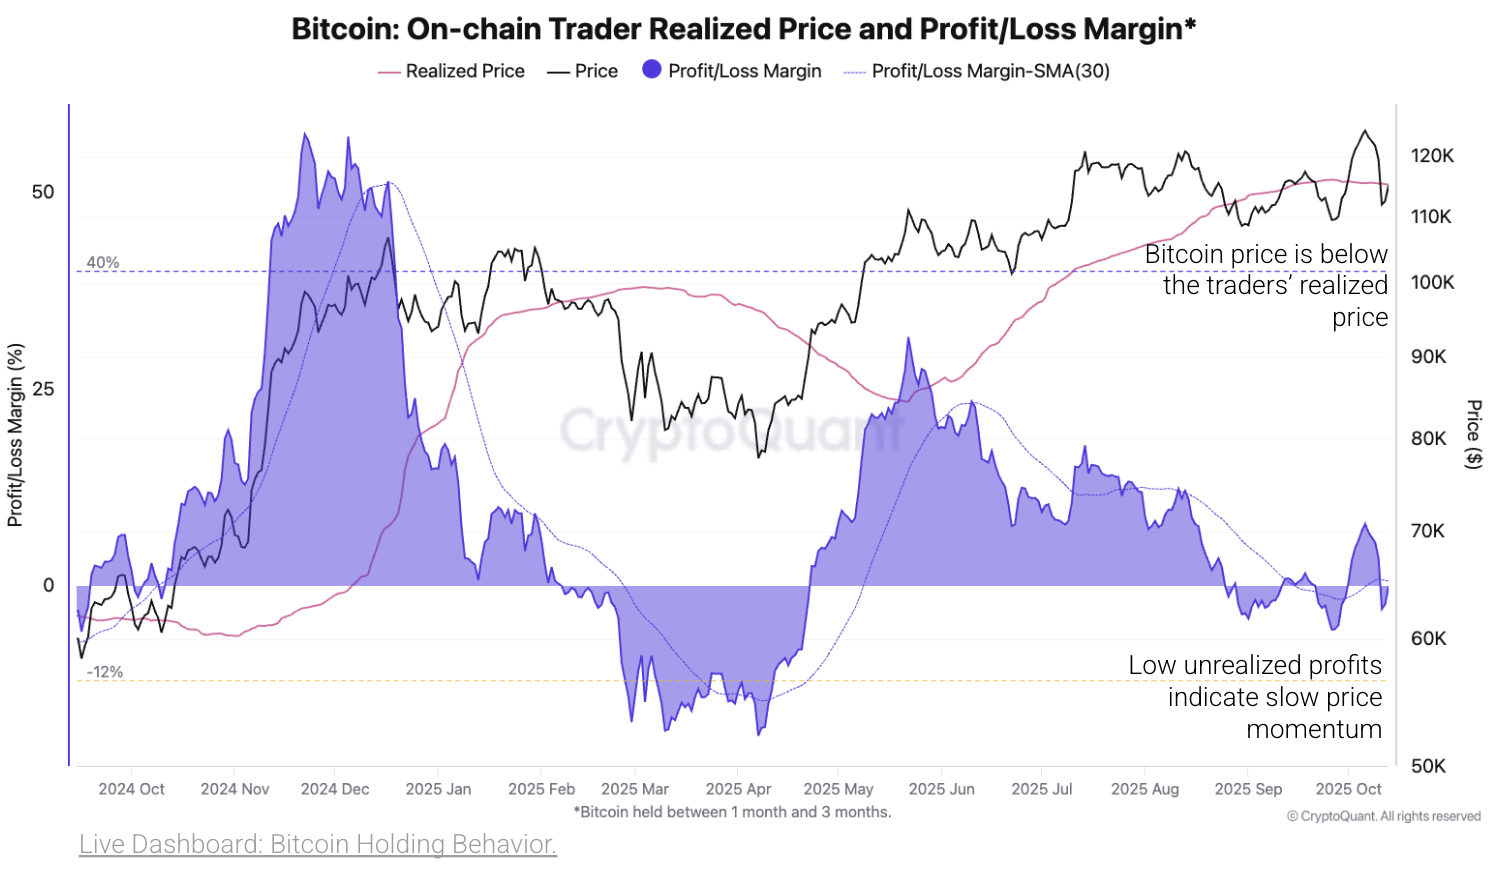
* Key Resistance for Recovery. The Traders’ On-Chain Realized Price sits at $115K, just above spot levels. Reclaiming this threshold is a necessary condition for Bitcoin to reestablish positive short-term momentum.
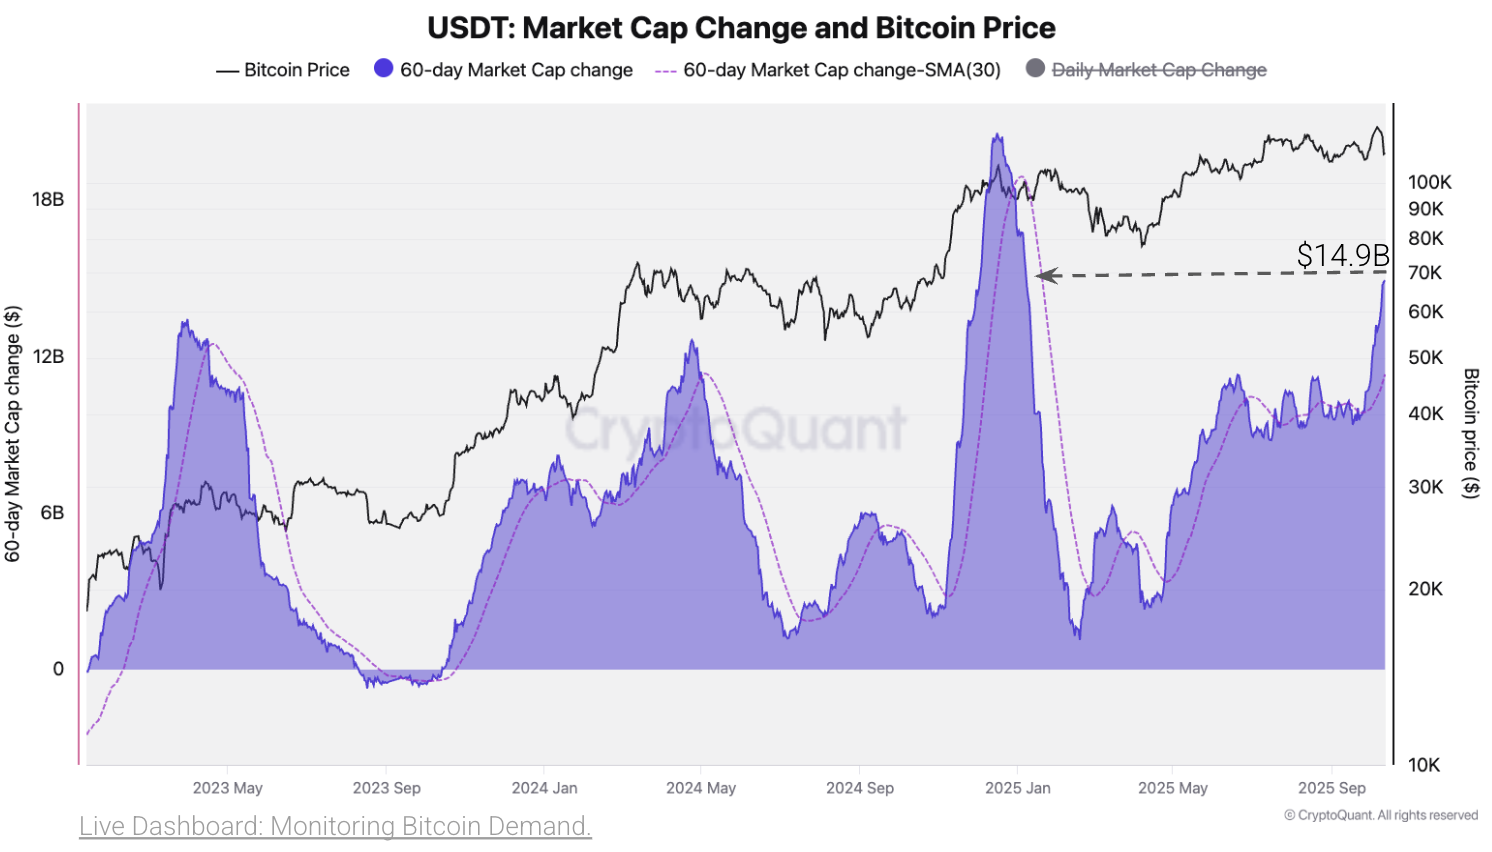
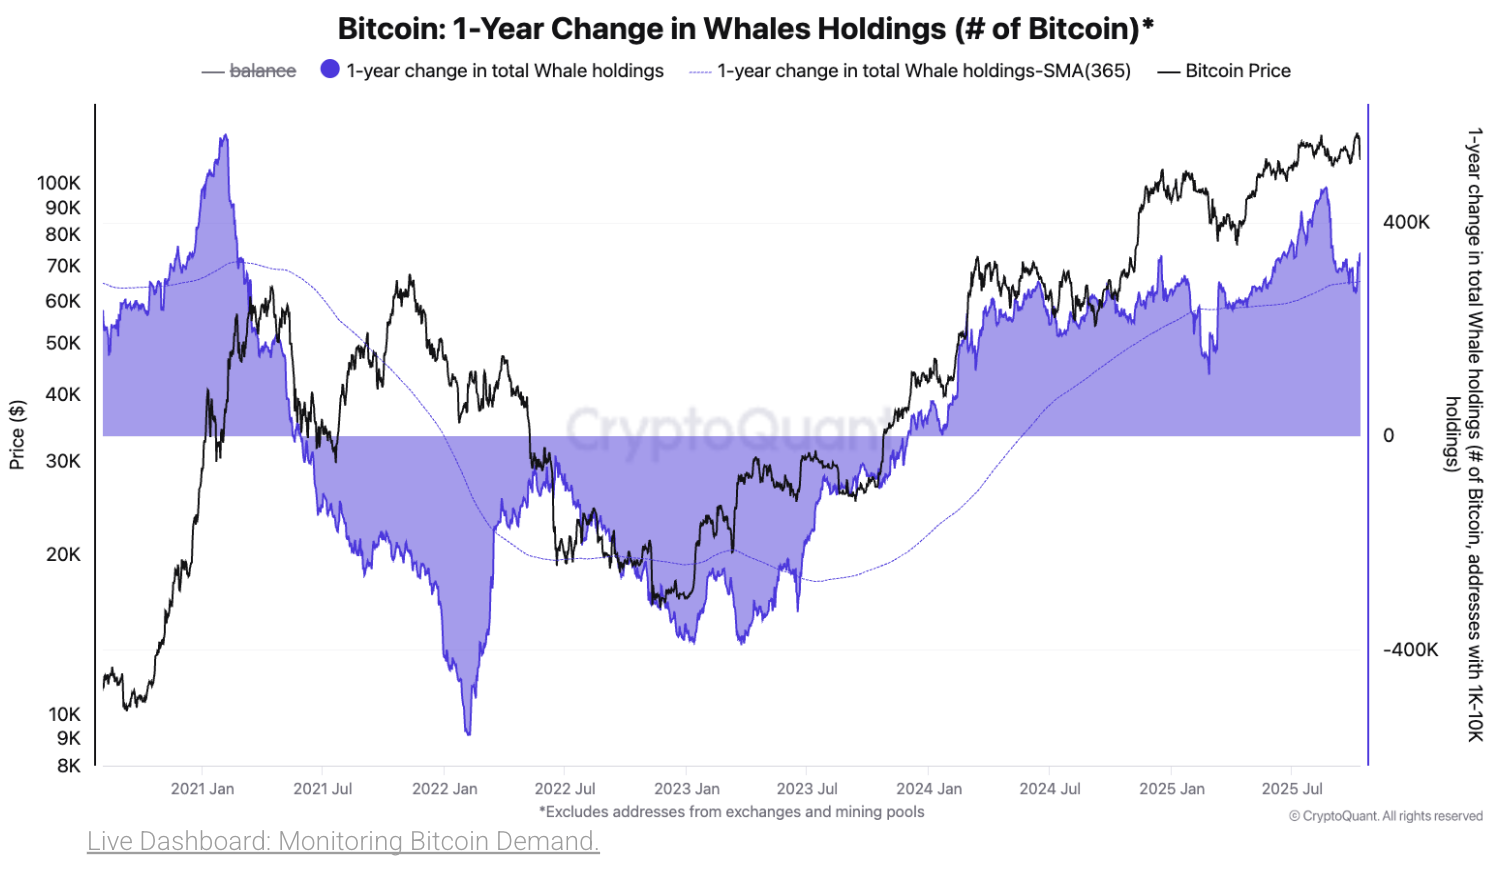
* On the positive side, Stablecoin liquidity growth and whale accumulation remain strong. Stablecoin liquidity continues to expand, with USDT market capitalization rising by $14.9 billion over the past 60 days — the fastest pace since January. This expansion provides fresh capital capacity to support future market recovery. Moreover, the 1-year change in whale holdings crossed above its 1-year moving average on October 8, signaling renewed accumulation by large investors — a historically bullish structural factor.
# On-chain | Market Activities
1. The crypto market underwent its largest-ever deleveraging event last Friday, leading to a sharp decline in asset prices. The combined open interest in Bitcoin and Ethereum perpetual futures fell from a record high of $78 billion on October 6 to $57 billion today — a 27% drop, equivalent to $21 billion in liquidations. Notably, open interest plunged by $19.7 billion on October 10 alone, marking the largest single-day decline on record. The market turmoil was triggered by escalating U.S.–China trade tensions after President Trump announced on Friday that the United States would impose a 100% tariff on Chinese imports starting November 1. Although he has since softened his initial statements, the announcement sparked widespread volatility. Consequently, Bitcoin and Ethereum prices fell by 7% and 12%, respectively. – [Link ](https://cryptoquant.com/community/dashboard/63ebfa1e356a4153502486b9)
2. Bitcoin’s fundamentals have weakened, as reflected by the Bull Score Index, which now signals bearish market conditions. The Index has dropped to 20 today — deep in bearish territory — compared to 80 on October 6.
The Bull Score Index first turned bearish on October 8, when Bitcoin was trading at $119,000. – [Link](https://cryptoquant.com/community/dashboard/67db8377a2a7203afd398632)
3. Bitcoin spot demand is contracting, and price momentum remains weak. Spot demand, measured by the Apparent Demand metric, is declining at a 30-day rate of 111,000 BTC — the steepest contraction since April. Spot demand has been shrinking since October 8. Meanwhile, the sharp price correction pushed CryptoQuant’s Bull-Bear Market Cycle Indicator into the BEAR phase, signaling weakening momentum and growing downside pressure. – [Link (1)](https://cryptoquant.com/community/dashboard/66c366531dad4a62a5d42c79), [Link (2)](https://cryptoquant.com/community/dashboard/630646ec267b2b05b12f51ca)
4. Bitcoin must reclaim the Traders’ On-Chain Realized Price to reestablish positive momentum. This key short-term cost basis currently sits at $115,000, marginally above the spot price of $114,000.
A sustained break above this threshold would signal renewed trader confidence and mark a shift toward bullish short-term market conditions. – [Link](https://cryptoquant.com/community/dashboard/638e2fd9f1ce177db56da127)
5. On a positive note, stablecoin liquidity continues to expand. The 60-day change in USDT market capitalization stands at $14.9 billion, marking the fastest growth since January 7.
This expansion in stablecoin supply represents a constructive liquidity inflow into the crypto ecosystem, historically associated with improving price support for digital assets. – [Link](https://cryptoquant.com/community/dashboard/66c366531dad4a62a5d42c79)
6. The Bitcoin holdings of whales continue to expand. The 1-year change in whale balances has turned upward again, crossing above its 1-year moving average on October 8 — a bullish inflection point.
Historically, periods in which large investors accumulate Bitcoin have coincided with sustained bull market conditions. – [Link](https://cryptoquant.com/community/dashboard/66c366531dad4a62a5d42c79)
If you have any questions, send us an email at [research@cryptoquant.com](mailto:research@cryptoquant.com)
The information herein was prepared by Team CQ Inc. (a.k.a. CryptoQuant) and is for informational purposes only and is not intended to constitute a recommendation, investment advice of any kind, or an offer to buy or sell securities or other assets. Please perform your own research and consult a qualified advisor to see if digital assets are an appropriate investment option.
This information is not intended for distribution to, or use by, any person or entity in any jurisdiction or country where such distribution or use would be contrary to local law or regulation. Persons accessing this information are required to inform themselves about and observe such restrictions.
Digital assets are speculative and highly volatile, can become illiquid at any time, and are for investors with a high-risk tolerance. Investors in digital assets could lose the entire value of their investment. Team CQ Inc. does not provide tax, legal, investment, or accounting advice. This material is not intended to provide, and should not be relied on, for tax, legal, or accounting advice. Tax laws and regulations are complex and subject to change. You should consult your own tax, legal, and accounting advisors before engaging in any transaction.
© 2025 Team CQ Inc. All rights reserved.

View original →Profit-taking activity remains at relatively low levels after Bitcoin reached a new all-time high of $ 126K last Monday, suggesting that Bitcoin may continue to rally and that a top is still not on the horizon.
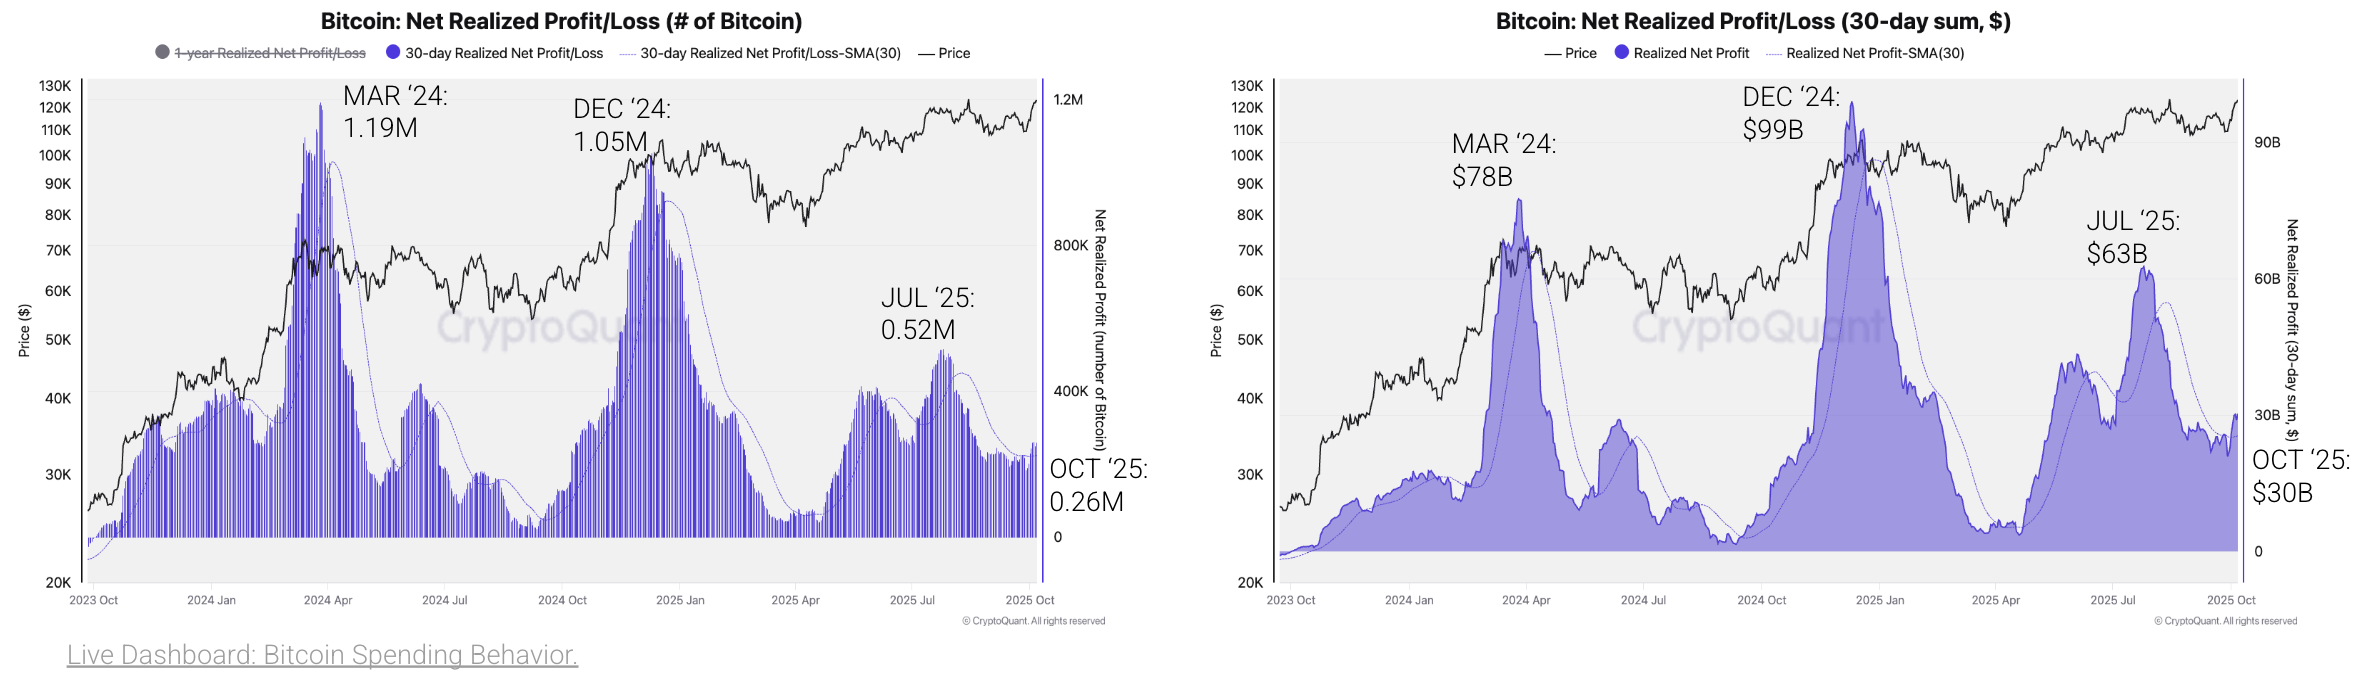
* Bitcoin holders’ net realized profits in the last 30 days are 50% below levels associated with price tops. Net profits stand at 0.26 million BTC today, equivalent to $30 billion profit, compared to July’s previous peak of 0.53 million BTC or $63 billion, and far from March and December’s 2024 levels of $78 and $99 billion, respectively. Low levels of profit-taking indicate that market participants are not selling heavily and that the price rally may continue ahead.
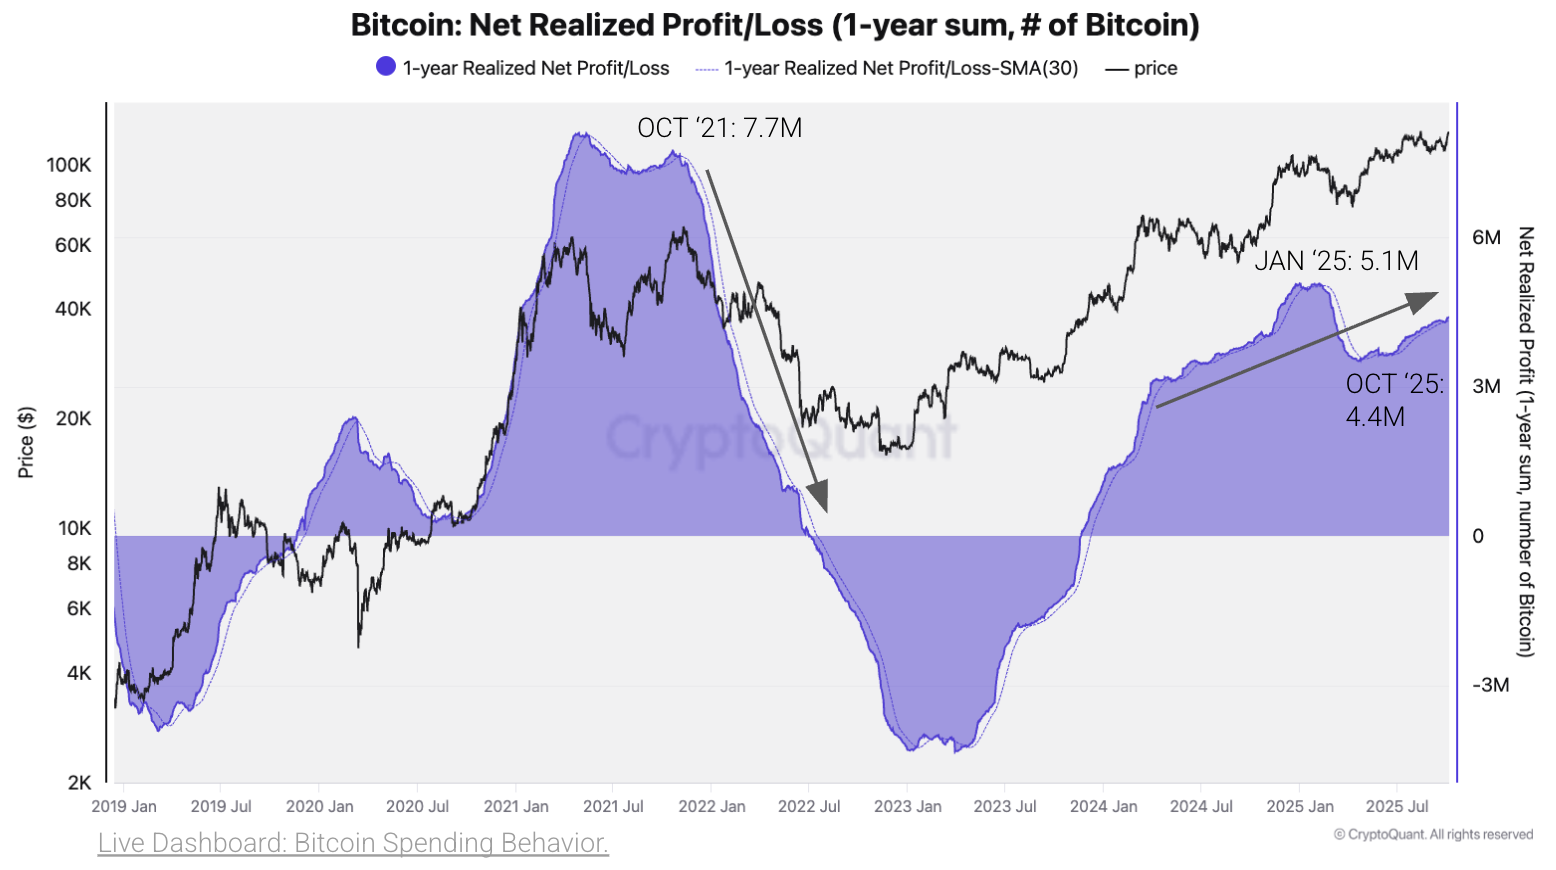
* On an annual basis, on-chain data shows that net realized profits are still trending upwards, which is supportive of higher prices. Prices peaked in December 2021 as the annual growth of realized profits started to stall.
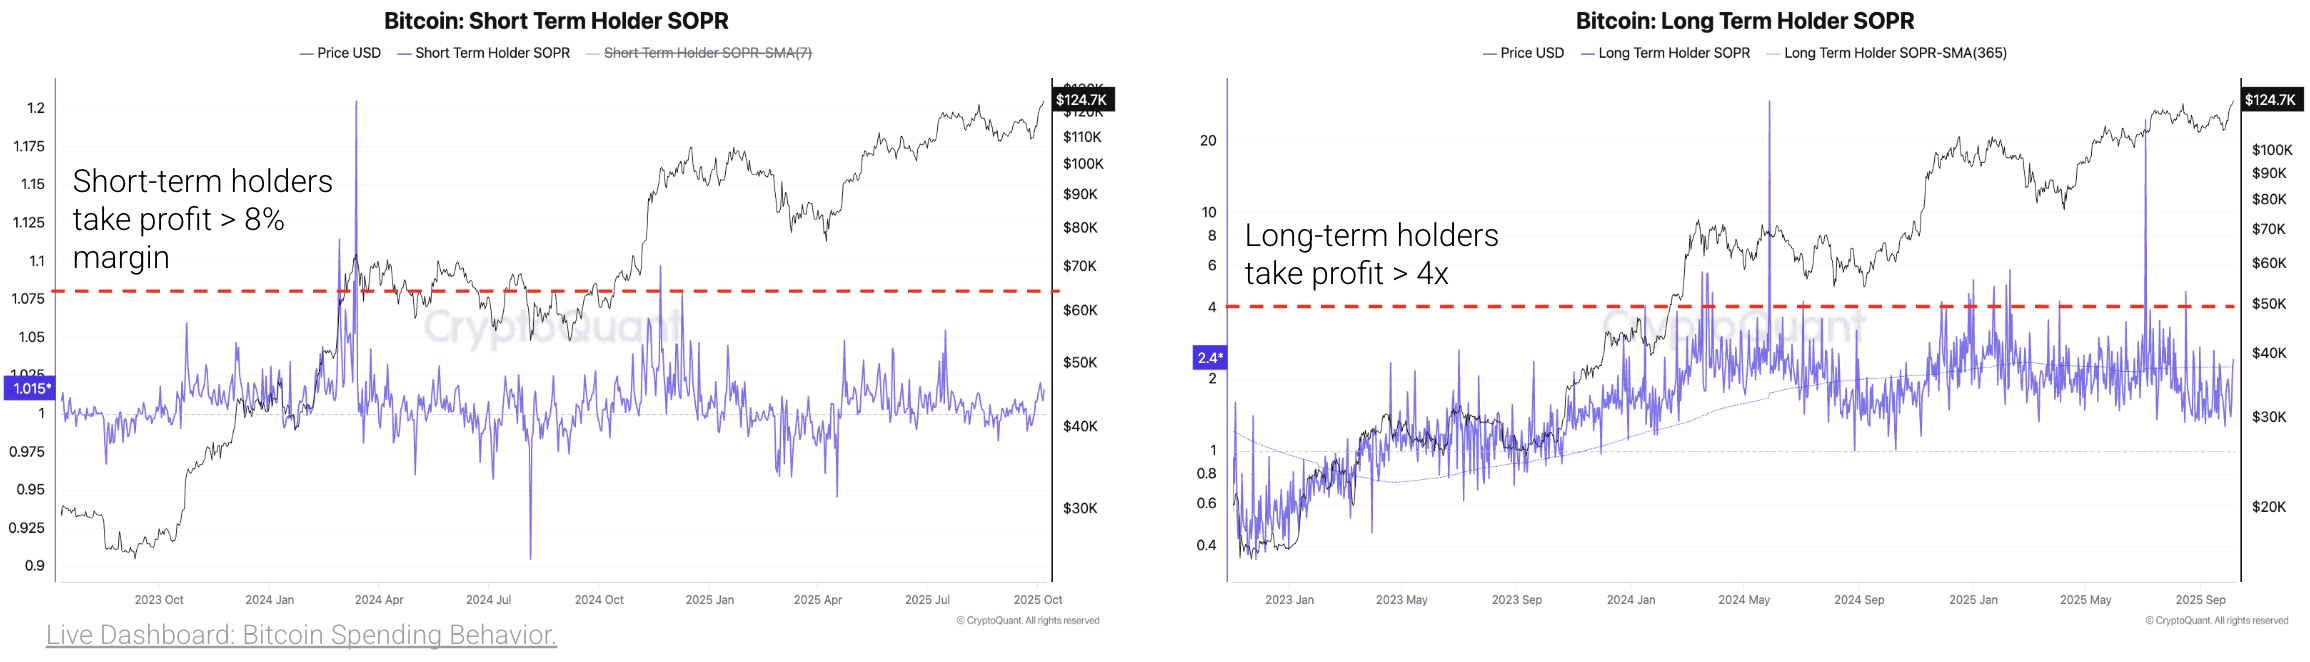
* Profit margins of short and long-term holders are still below peak levels. On the one hand, short-term holders took profits in the last few days at a 2% margin, significantly below peak levels of 8%, which are correlated with price tops. On the other hand, long-term holders’ realized profit margins are at 129%, far below extreme levels of 300%–or 4x profits.
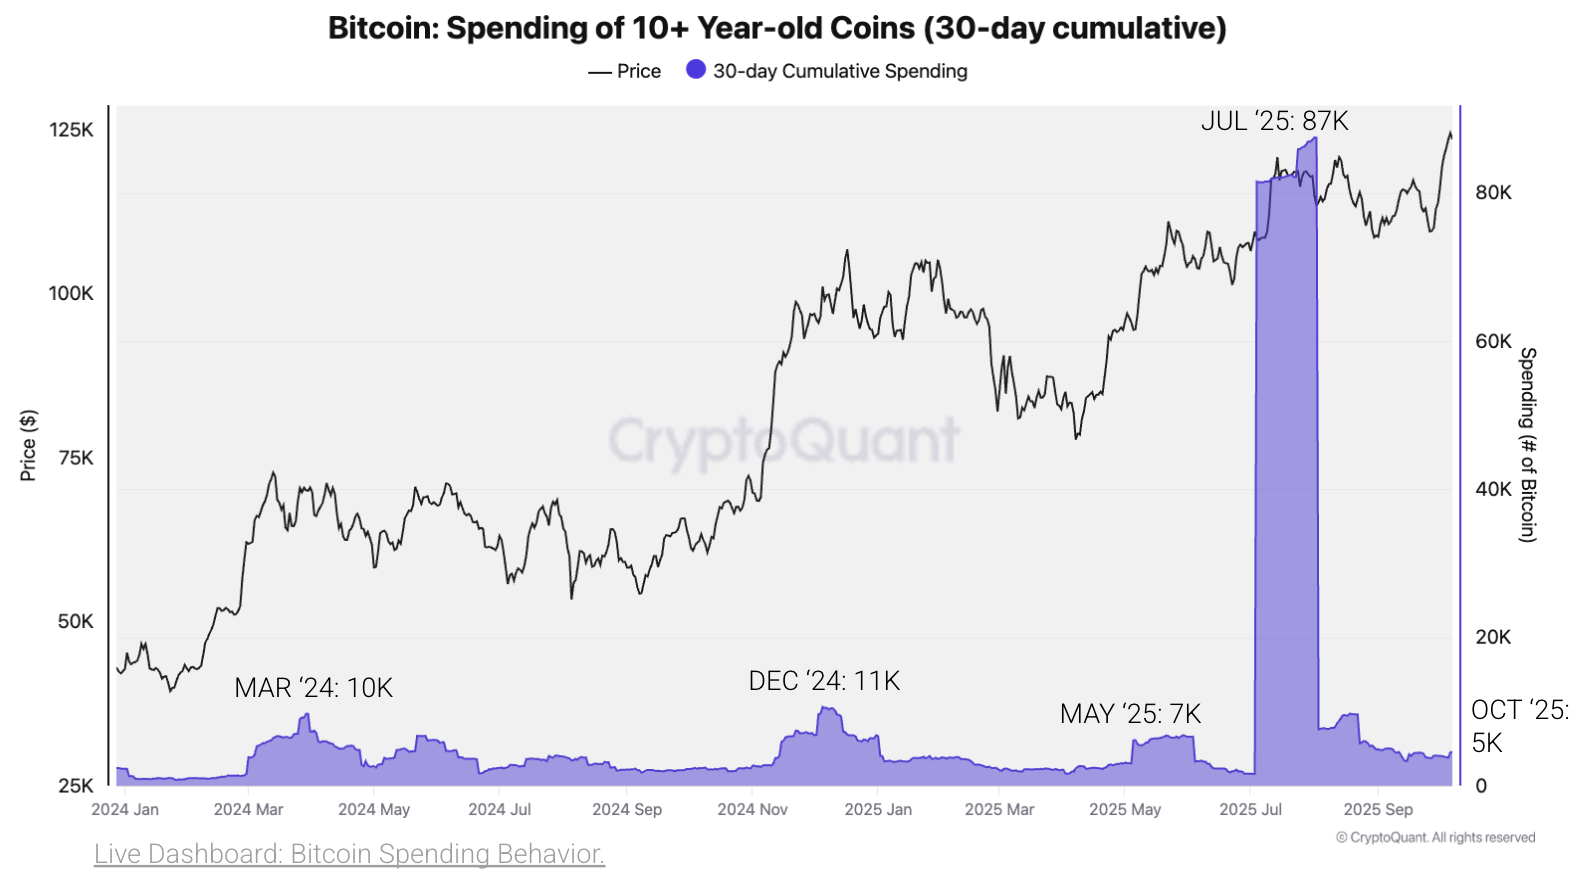
* Selling activity from Bitcoin “OGs” also remains relatively low. Spending of Bitcoin older than 10 years in the last 30 days stands at 5K, half of the expenditure seen in previous price peaks in March and December 2024, and 29% below May’s 2025 top.
# On-chain | Market Activities
1. Profit-taking remains subdued after Bitcoin reached a new all-time high of $126K last Monday. Bitcoin holders’ total net realized profits in the last 30 days stand at 0.26 million BTC today, equivalent to $30 billion profit. This level is 50% below July’s previous peak of 0.53 million BTC or $63 billion, and far from March and December 2024 levels of $78 and $99 billion, respectively. Low levels of profit-taking indicate that market participants are not selling heavily and that the price rally may continue ahead. – [Link](https://cryptoquant.com/community/dashboard/638a6cffedf9756d0ec3a7c9)
2. There are still no signs of a price peak as profit-taking momentum remains positive. On an annual basis, on-chain data shows that net realized profits are still trending upwards, which is supportive of higher prices. Prices peaked in December 2021 as the annual growth of realized profits started to stall. – [Link](https://cryptoquant.com/community/dashboard/638a6cffedf9756d0ec3a7c9)
3. Profit margins of short and long-term holders are still below peak levels. On the one hand, short-term holders took profits in the last few days at a 2% margin, significantly below peak levels of 8%, which are correlated with price tops. On the other hand, long-term holders’ realized profit margins are at 129%, far below extreme levels of 300% or 4x profits (see red lines in the charts). – [Link](https://cryptoquant.com/community/dashboard/638a6cffedf9756d0ec3a7c9)
4. Selling activity from Bitcoin “OGs” also remains relatively low. Spending of Bitcoin older than 10 years in the last 30 days stands at 5K, half of the expenditure seen in previous price peaks in March and December 2024, and 29% below May’s 2025 top.
Price tops are usually accompanied by a high selling activity from Bitcoin OGs. – [Link](https://cryptoquant.com/community/dashboard/638a6cffedf9756d0ec3a7c9)
If you have any questions, send us an email at [research@cryptoquant.com](mailto:research@cryptoquant.com)
The information herein was prepared by Team CQ Inc. (a.k.a. CryptoQuant) and is for informational purposes only and is not intended to constitute a recommendation, investment advice of any kind, or an offer to buy or sell securities or other assets. Please perform your own research and consult a qualified advisor to see if digital assets are an appropriate investment option.
This information is not intended for distribution to, or use by, any person or entity in any jurisdiction or country where such distribution or use would be contrary to local law or regulation. Persons accessing this information are required to inform themselves about and observe such restrictions.
Digital assets are speculative and highly volatile, can become illiquid at any time, and are for investors with a high-risk tolerance. Investors in digital assets could lose the entire value of their investment. Team CQ Inc. does not provide tax, legal, investment, or accounting advice. This material is not intended to provide, and should not be relied on, for tax, legal, or accounting advice. Tax laws and regulations are complex and subject to change. You should consult your own tax, legal, and accounting advisors before engaging in any transaction.
© 2025 Team CQ Inc. All rights reserved.

View original →Bitcoin starts Q4 with conditions that appear favorable for a price rally:
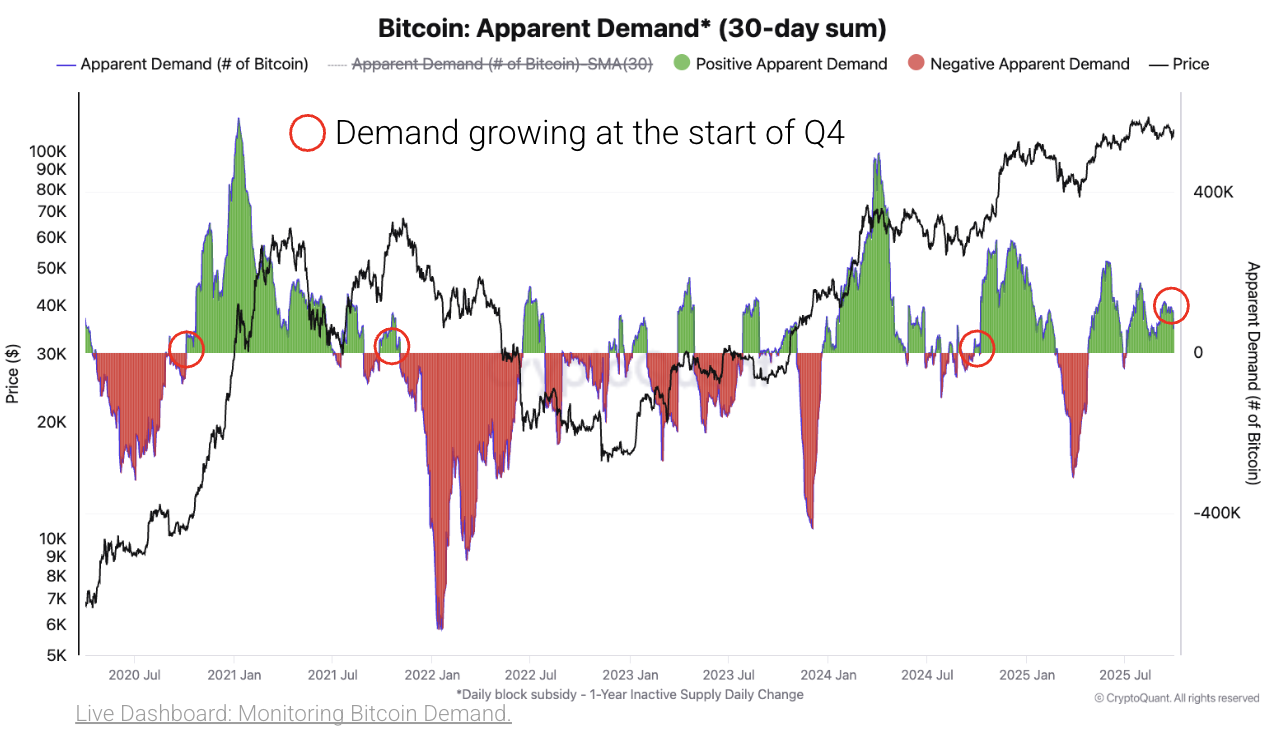
* Spot Bitcoin demand remains in expansion mode. Bitcoin apparent demand has been growing since July, standing today at +62K monthly growth rate. Growing demand is a necessary condition for Bitcoin prices to rally, a condition that was present in Q4 of 2020, 2021, and 2024.
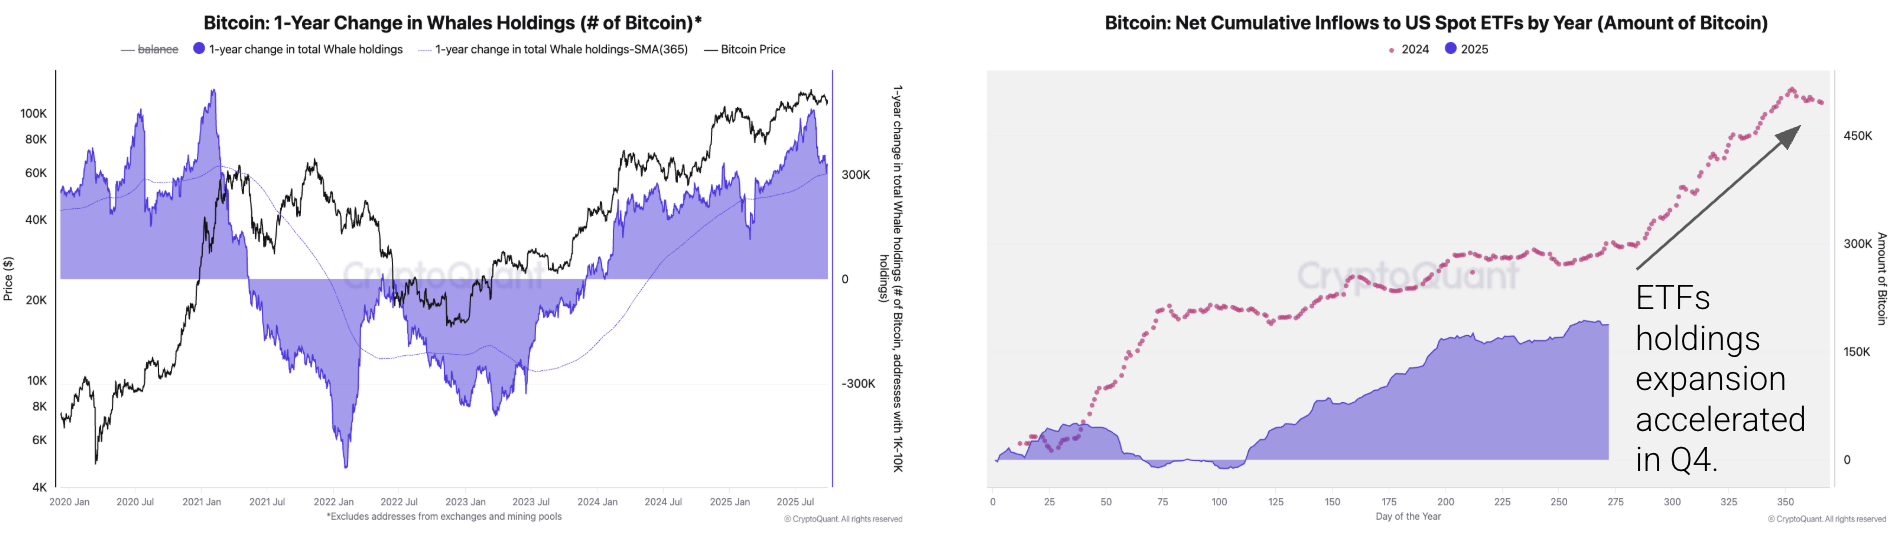
* Whale and ETF demand continue to grow and could accelerate in Q4. Whale Bitcoin holdings are still expanding above trend and remain far from contraction territory. Holdings are growing at an annual rate of 331K Bitcoin, compared to an expansion of 255K in Q4 2024, +238K Bitcoin at the start of Q4 2020, and a 197K contraction in 2021. Meanwhile, ETFs may be positioned to increase Bitcoin demand as they purchased a total of 213K Bitcoin in Q4 2024, a 71% gain in holdings.
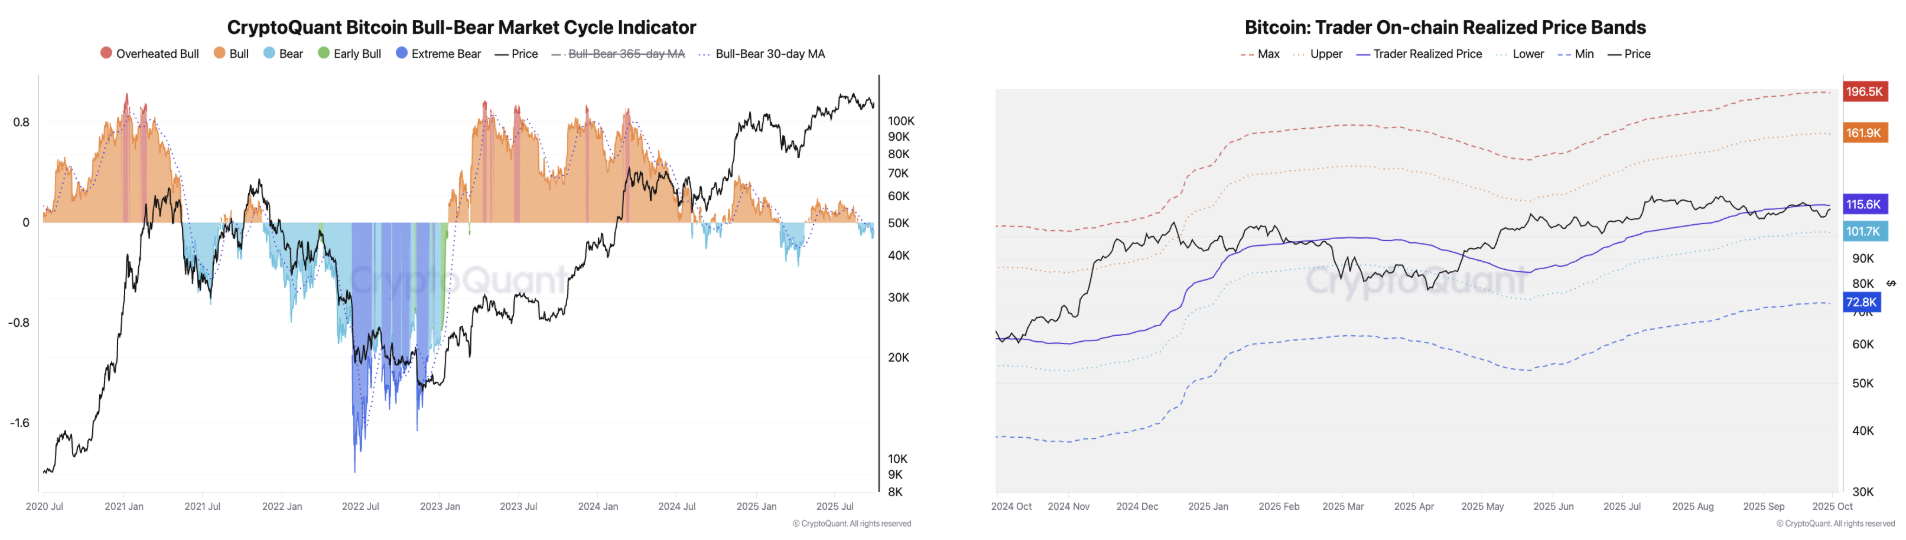
* Price momentum is still needed for the Q4 rally to ignite. From a price valuation perspective, Bitcoin needs to cross above the Trader’s On-chain Realized Price, which is at $116K, compared to a $114K price. From this perspective, Bitcoin is targeting $160K-200K in Q4. Additionally, a cross above $116K would put Bitcoin back into the BULL phase according to the Bull-Bear Market Cycle Indicator.
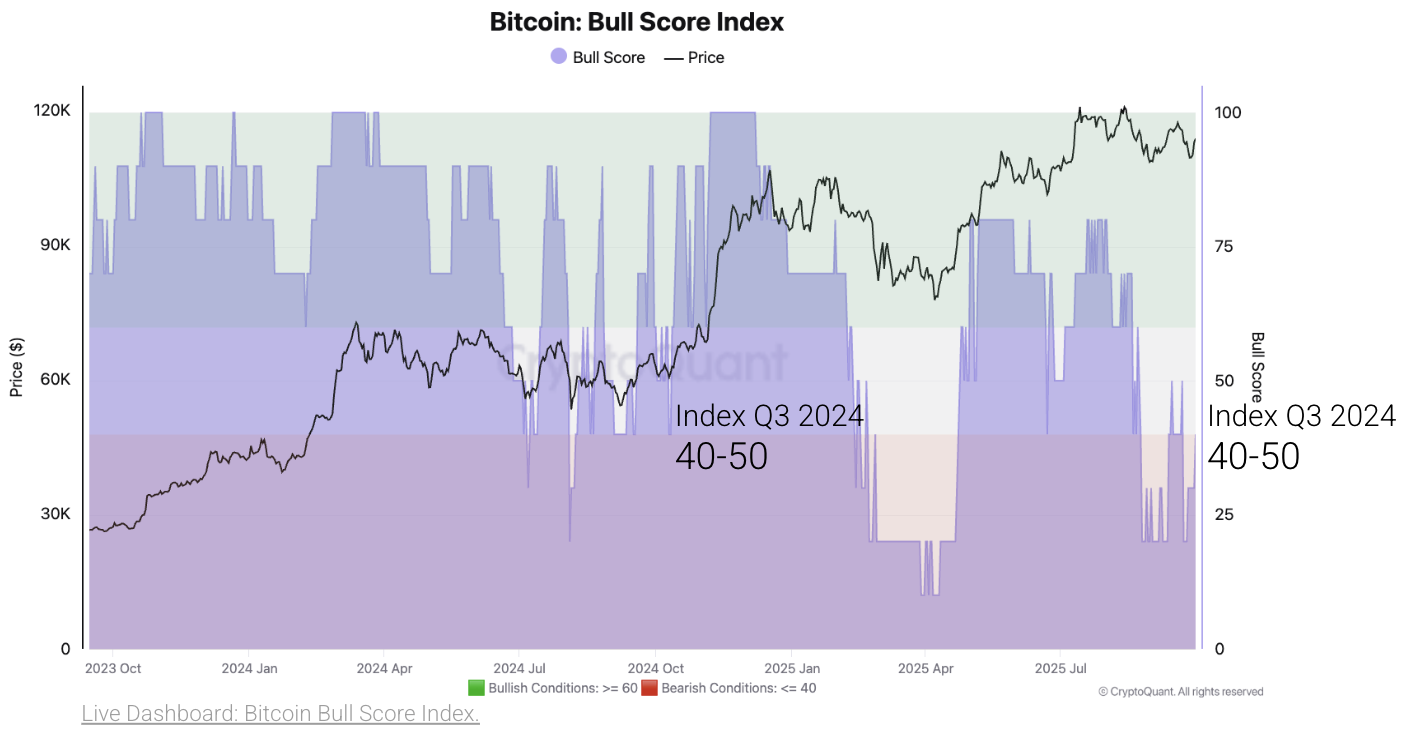
* Bullish conditions are starting in Q4 2025 at the same level as last year. CryptoQuant’s Bitcoin Bull Score Index has been at 40-50 in the last few days of Q3 2025, the same levels as at the end of Q3 2024. These levels represent the threshold before conditions turn bullish according to the index. Last year, as the index crossed above 50–bullish conditions–the price of Bitcoin rallied from ~$70K to ~$100K.
# On-chain | Market Activities
1. Bullish conditions are starting Q4 2025 at the same level as last year. CryptoQuant’s Bitcoin Bull Score Index has been at 40-50 in the last few days of Q3 2025, the same levels as at the end of Q3 2024. These levels represent the threshold before conditions turn bullish according to the index. Last year, as the index crossed above 50–bullish conditions–the price of Bitcoin rallied from ~$70K to ~$100K for the first time in Bitcoin’s history. The fourth quarter of the year has typically been bullish for Bitcoin’s price performance. – [Link](https://cryptoquant.com/community/dashboard/67db8377a2a7203afd398632)
The Bull Score Model has recently been supported to the upside by:
1. Growing Bitcoin demand
2. Expanding stablecoin liquidity, and
3. Lower unrealized gains from traders (implies less selling pressure from traders).
2. Spot Bitcoin demand enters Q4 in expansion mode. Bitcoin apparent demand has been growing since July, standing today at +62K monthly growth rate. Growing demand is a necessary condition for Bitcoin prices to rally, a condition that was present in Q4 of 2020, 2021, and 2024 (red circles). – [Link](https://cryptoquant.com/community/dashboard/66c366531dad4a62a5d42c79)
3. Whale and ETF demand continue to grow and could accelerate in Q4. On the one hand, whale Bitcoin holdings are still expanding above trend and remain far from contraction territory (left chart). Holdings are growing at an annual rate of 331K Bitcoin, compared to an expansion of 255K in Q4 2024, +238K Bitcoin at the start of Q4 2020, and a 197K contraction in 2021. On the other hand, ETFs may be positioned for a large gain in their Bitcoin holdings (right chart). In Q4 2024, US-based ETFs purchased a total of 213K Bitcoin, a 71% gain in holdings. – [Link](https://cryptoquant.com/community/dashboard/66c366531dad4a62a5d42c79)
4. Price momentum is still needed for the Q4 rally to ignite. From a price valuation perspective, Bitcoin needs to cross above the Trader’s On-chain Realized Price, which is at $116K, compared to a $114K price (right chart). If this threshold is surpassed, on-chain valuation bands suggest a potential range of $160K–$200K in Q4 (the upper and max price bands). A cross above $116K would put Bitcoin back into the ‘BULL’ phase according to the Bull-Bear Market Cycle Indicator (left chart). – [Link](https://cryptoquant.com/community/dashboard/630646ec267b2b05b12f51ca)
If you have any questions, send us an email at [research@cryptoquant.com](mailto:research@cryptoquant.com)
The information herein was prepared by Team CQ Inc. (a.k.a. CryptoQuant) and is for informational purposes only and is not intended to constitute a recommendation, investment advice of any kind, or an offer to buy or sell securities or other assets. Please perform your own research and consult a qualified advisor to see if digital assets are an appropriate investment option.
This information is not intended for distribution to, or use by, any person or entity in any jurisdiction or country where such distribution or use would be contrary to local law or regulation. Persons accessing this information are required to inform themselves about and observe such restrictions.
Digital assets are speculative and highly volatile, can become illiquid at any time, and are for investors with a high-risk tolerance. Investors in digital assets could lose the entire value of their investment. Team CQ Inc. does not provide tax, legal, investment, or accounting advice. This material is not intended to provide, and should not be relied on, for tax, legal, or accounting advice. Tax laws and regulations are complex and subject to change. You should consult your own tax, legal, and accounting advisors before engaging in any transaction.
© 2025 Team CQ Inc. All rights reserved.

View original →

