Bullish9/7/2021
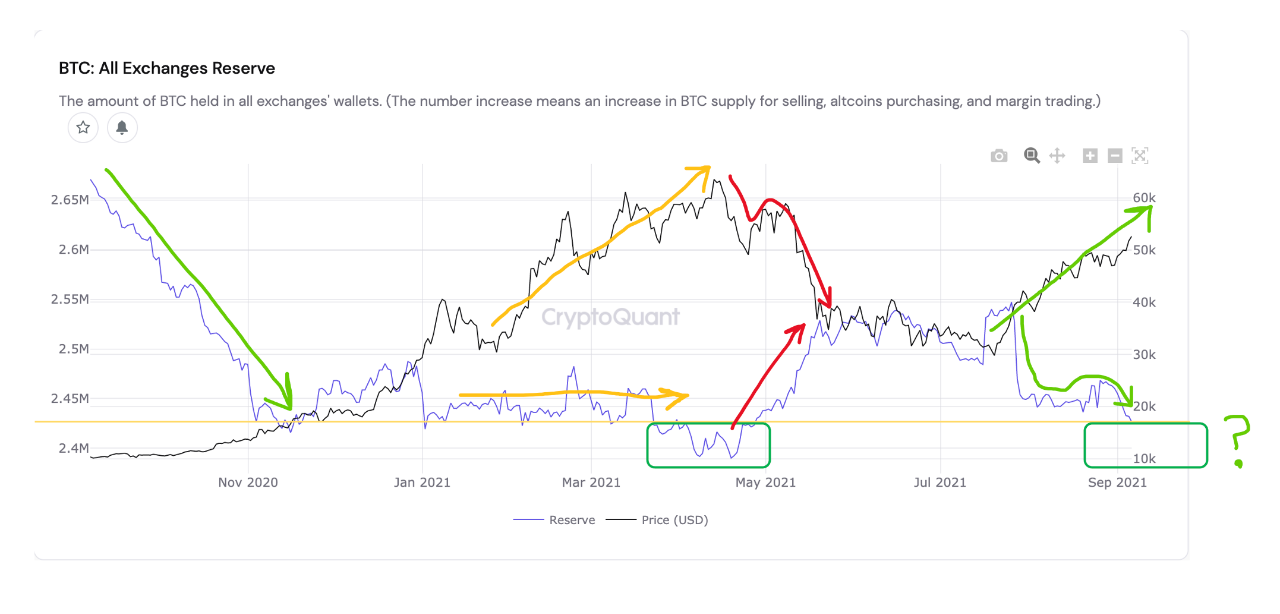
As shown, the spectacular runup in late 2020-early 2021 was preceded by a HUGE exchange outflow from Sep to Nov 2020. Price continued climbing even after outflows leveled off, creating a divergence (in yellow), but then dropped hard when inflows spiked (red). Happily, exchange outflows have resumed (far right green) but are not quite to their low point (green box). If current exchange outflows continue, they will reenter the green box soon, which should be a very good sign for subsequent PA

View original →Bearish(Nuanced)BTC
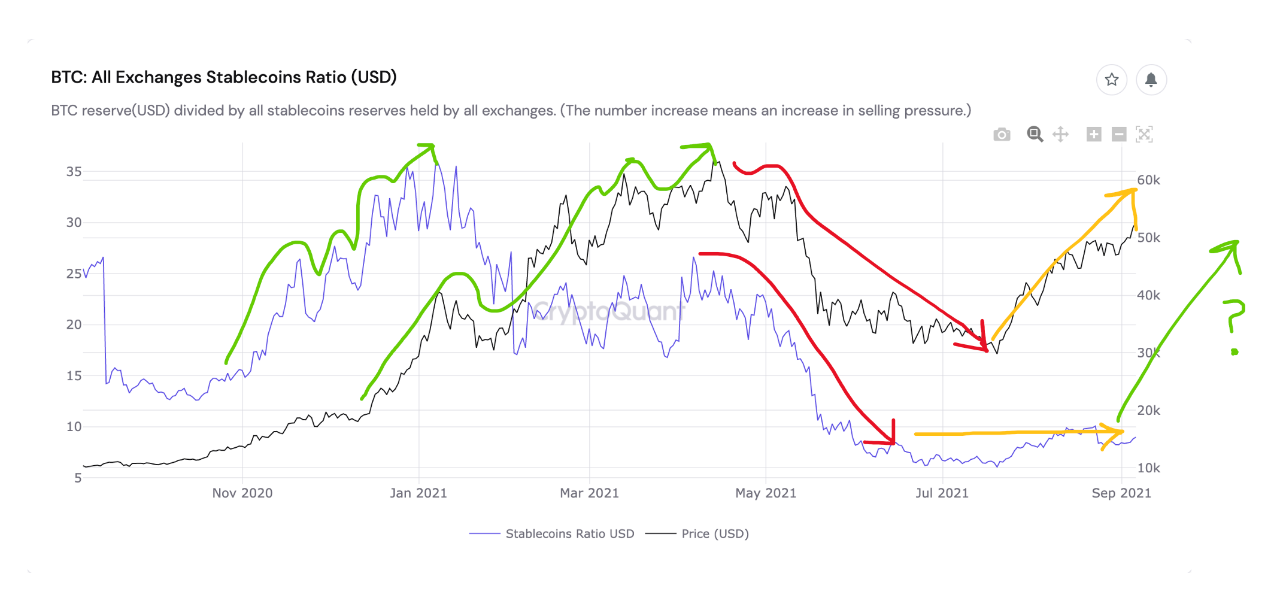
9/7/2021 The exchange stablecoins ratio has been a remarkably reliable forecaster of #BTC price moves over the past year. As shown, the late 2020-early 2021 price surge was preceded by a huge increase in the stablecoin ratio, and then the May swoon was preceded by the ratio falling quite precipitously starting n April. The fact that price is currently climbing w/the stablecoin ratio mostly flat is therefore a divergence. I would feel better if the stablecoin ratio starts climbing again, and soon.

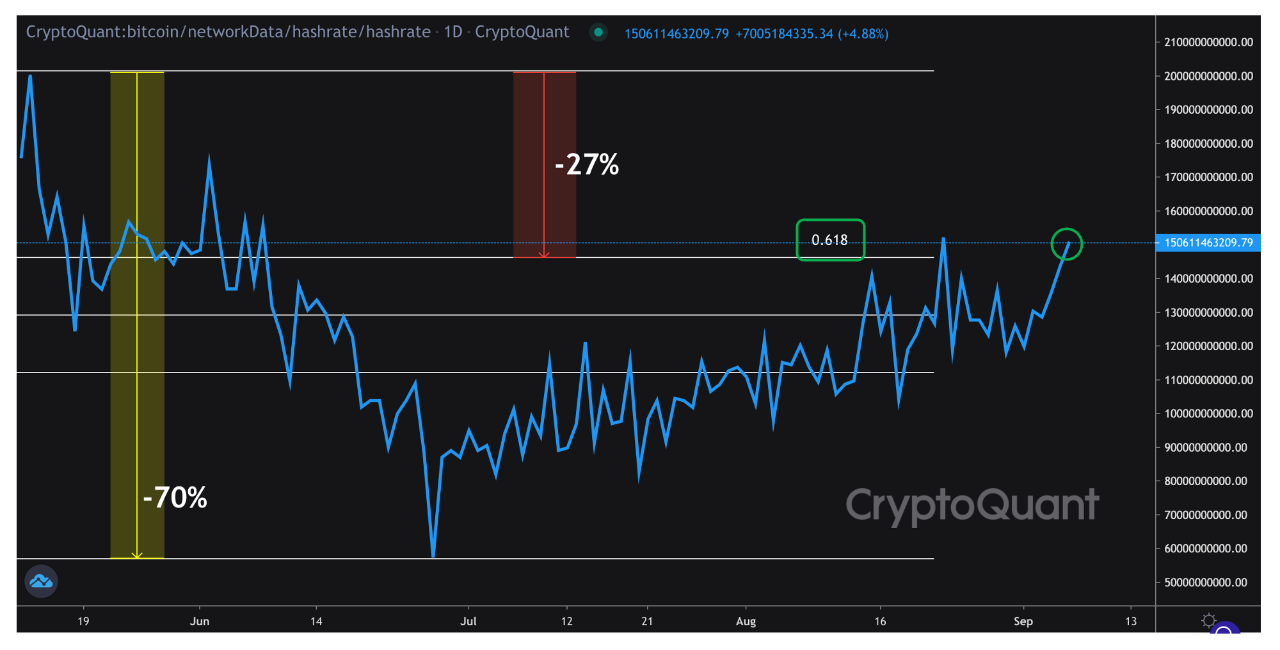
View original →For any Fibonacci Retracement fans among us, note that hash rate has broken through resistance at the 0.618 level. To the extent this matters at all, it is an encouraging sign for #BTC's hash rate, which serves as a proxy for network health and security. After the 70% retracement in May due to the China mining ban, #BTC's hash rate has recovered 45% of that loss, now "only" about 25% below its all-time high (ATH). With hash rate trending higher, it should reach a new ATH before year end.

View original →We are in nearly uncharted waters re: the stablecoin ratio and price. Ignore the circles on the attached chart and focus on the arrows. An increasing stablecoin ratio is a very reliable indicator of upward price movement. There are only two exceptions: Sep 2020 and now. And the divergence now is especially compelling. There is A LOT of $ ready to be deployed. Investors just seem to be looking for evidence the bottom is in. Once we get it, expect to see price reverse and climb quite quickly.
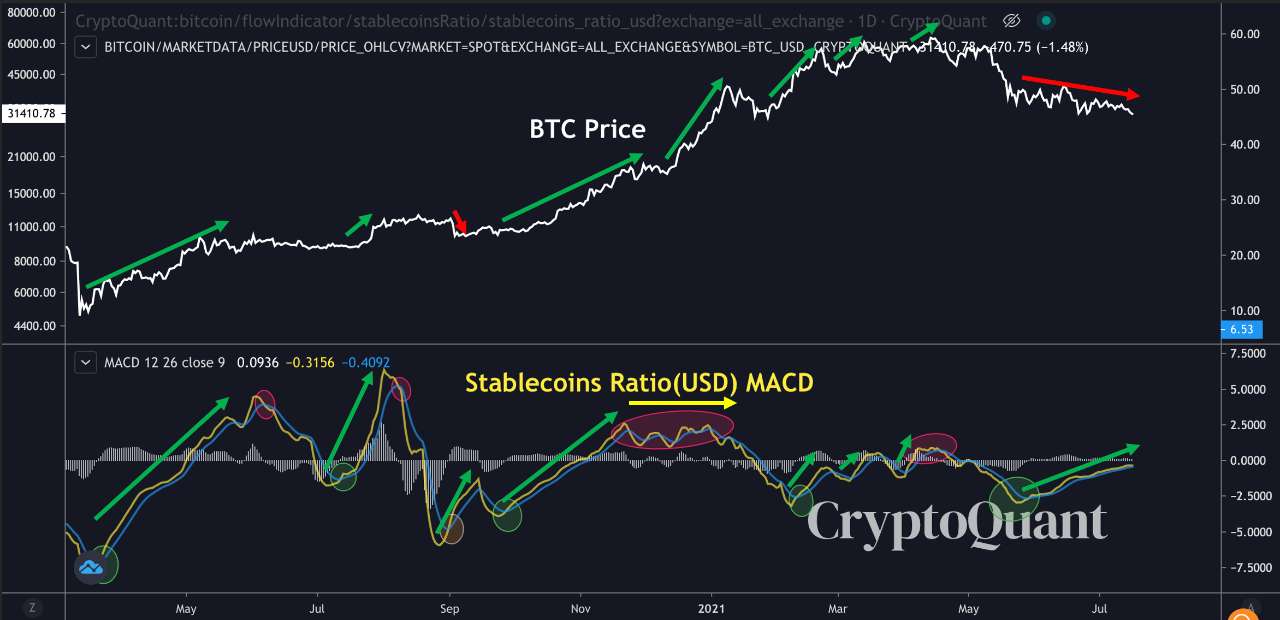

View original →As shown, the only time this halving cycle that price action has not correlated positively with stablecoin deposits is now. This bullish divergence suggests that current price may be merely lagging given this otherwise reliable correlation. I have noted elsewhere that many institutions curtail their activities during the summer ("Sell in May and go away"); perhaps BTC will blossom once again come September?
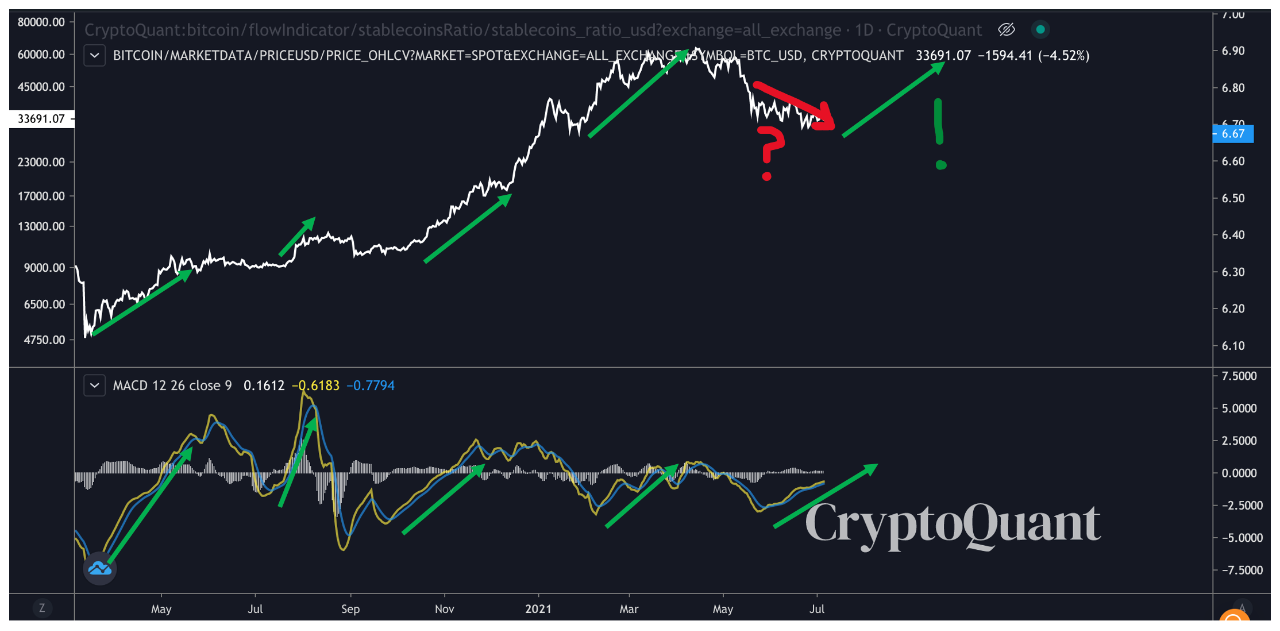

View original →July is a big month for Grayscale Bitcoin Trust (GBTC), as thousands of shares will "unlock," meaning be made available for sale. Doom and gloom has been predicted by some (e.g., https://tinyurl.com/at6wf3j7), but what so many fail to understand is that ZERO BTC will be sold. i.e., As a closed fund, GBTC is Hotel California: BTC can check in but never leave. Now, will GBTC trade at a greater discount post-unlock? Likely. But perhaps for spot BTC it will be a case of SELL the rumor, BUY the news?
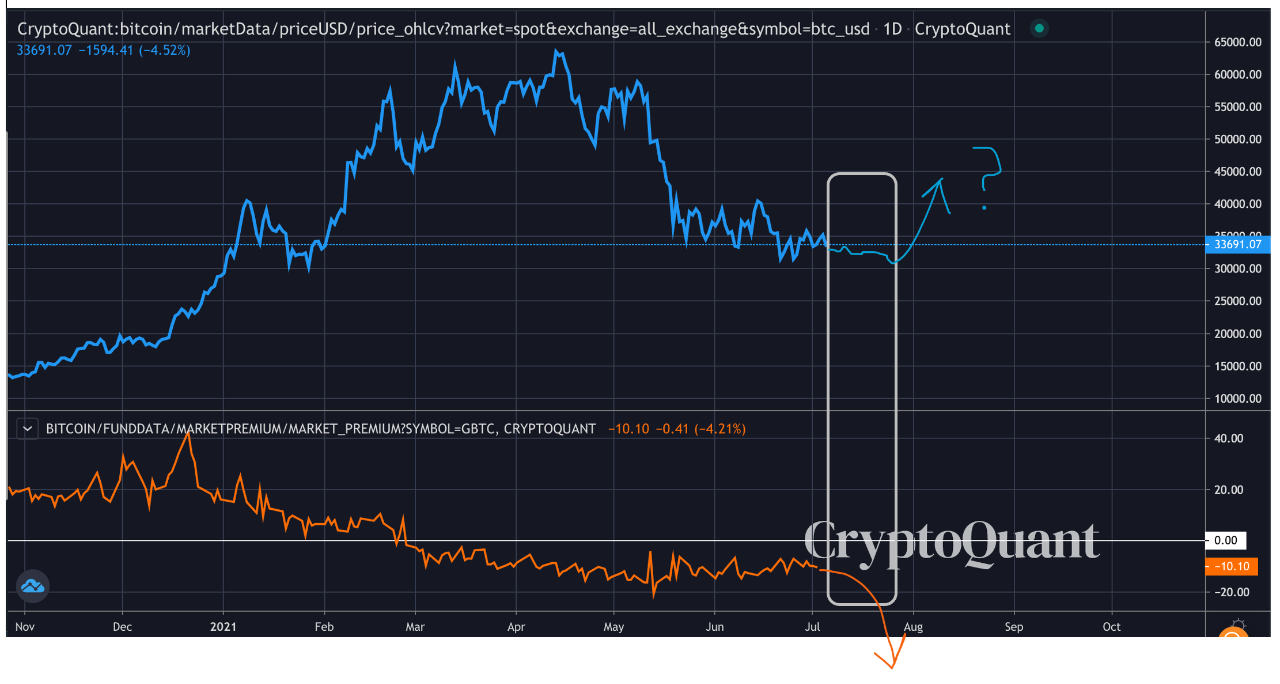

View original →Bearish(Nuanced)BTC
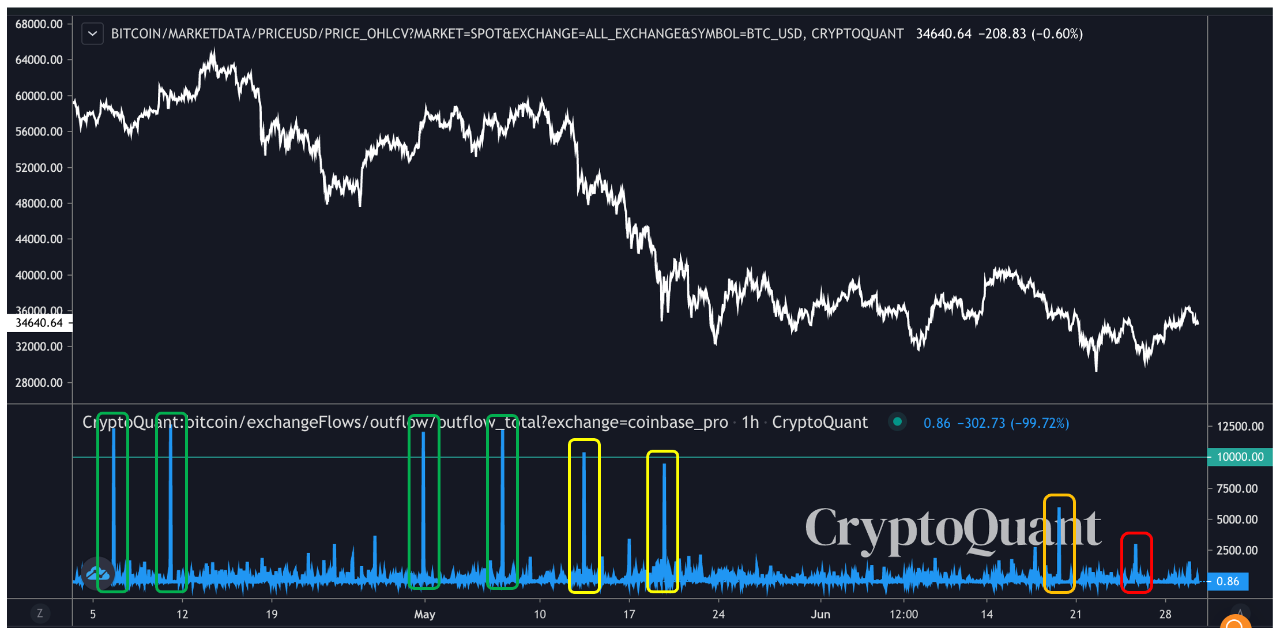
6/30/2021 Since BTC price peaked mid-April, the number and size of US institutional outflows (via Coinbase) has steadily decreased. As shown, there were four large outflows pre-crash (in green), and even two more sizable outflows mid-crash (in yellow), as institutions tried to buy the dip. However, it's clear institutional investors have been scarred by the crash, with only two smallish outflows since May 24 (orange & red). Until sizable outflows return, upward price momentum may be muted.

View original →

