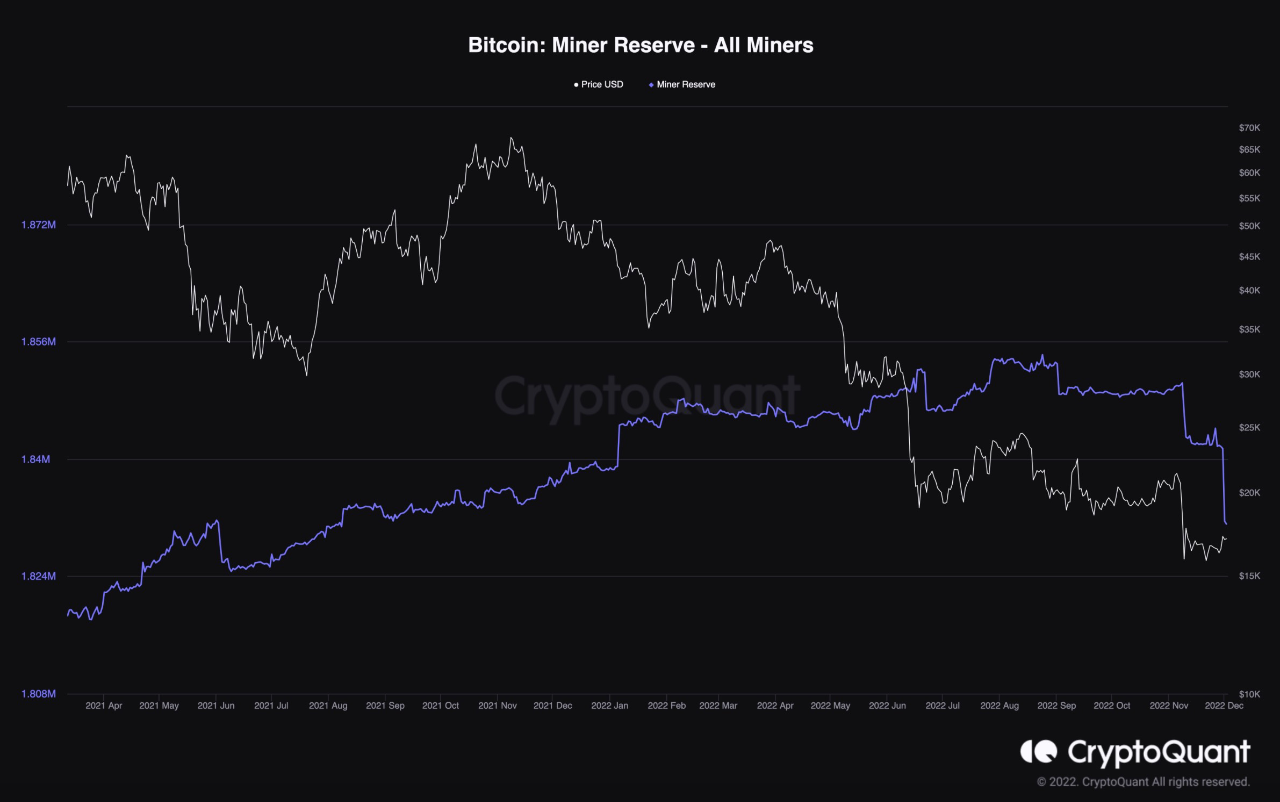
2022 has been showcasing how bad a Bitcoin bear market can really be, and it is getting even worse. After multiple defaults and bankruptcies during the last few months and a gruesome decline in price, the miners are seemingly beginning to capitulate.
Miners may be considered as the most important participants in the Bitcoin space, as they are responsible for network security. They have also accumulated massive amounts of BTC during the last few years, and their buying or selling pressure can move the price significantly. Therefore, miners capitulating is definitely bad news.
According to the Miner Reserve metric which measures the total amount of Bitcoin held by miner wallets, they have been selling BTC in huge chunks recently, which can be identified on the chart by the significant plunge in the reserve. This worrying signal comes after various rumors about the miners failing to repay their debts, and could set up the market for another massive crash in the short-term.

View original →Bullish(Nuanced)BTC
9/30/2022 ✔️ During the late phases of bear markets, even the more loyal investors tend to capitulate out of fear and sell their coins at huge losses to prevent bigger ones. The other side of this trade is usually the smart money, a cohort of market participants with deep enough pockets to be able to accumulate cheap coins during a gruesome downtrend.
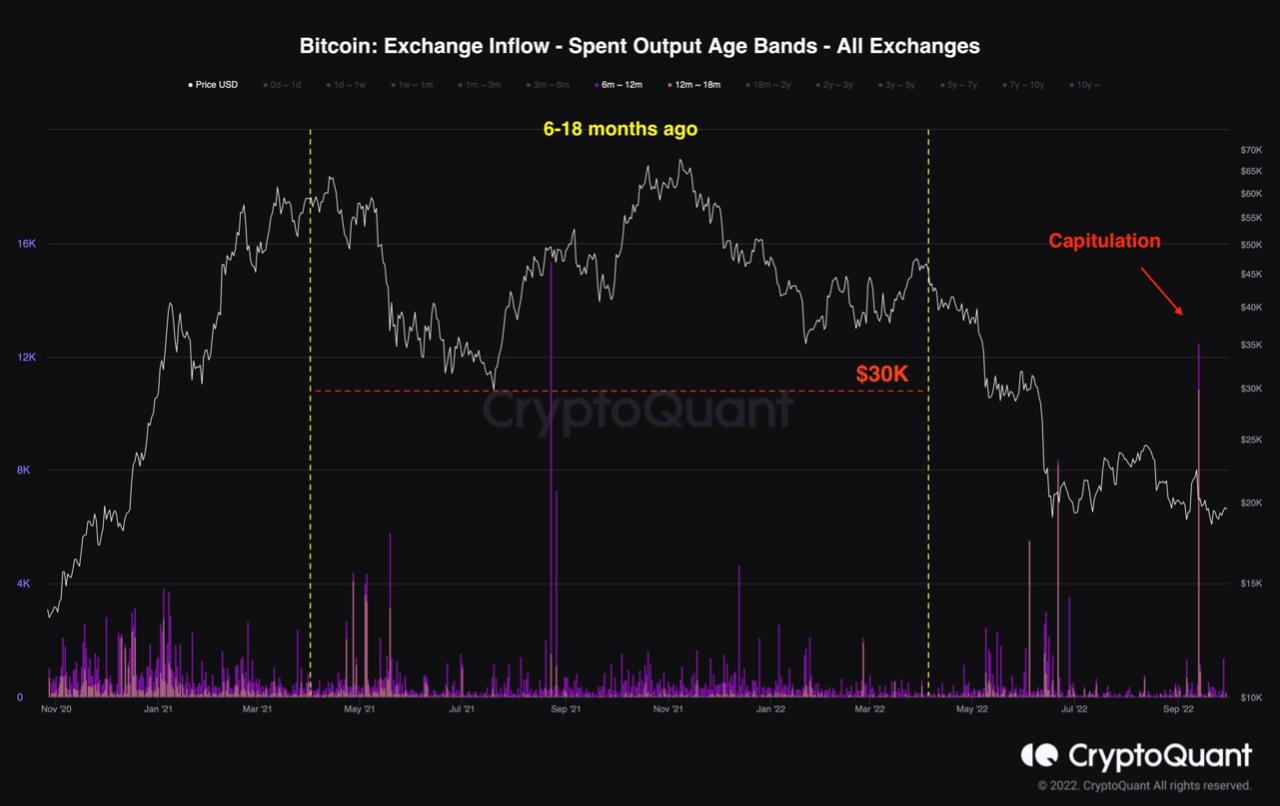
✔️ One of the most useful metric analyze capitulations, is the Exchange Inflow SOAB metric. Looking at the chart, it is evident that coins aged between 6-18 months ago have been sold aggressively recently. These coins have been bought between April 2021 and April 2022 at prices above $30K. This signal means that many holders who have entered the market during the 2021 bull market and above the $30K mark, have recently capitulated and exited the market at an approximate 50% loss.
✔️ These types of capitulations tend to occur during the last months of a bear market, pointing to a potential bottom formation in the near future.

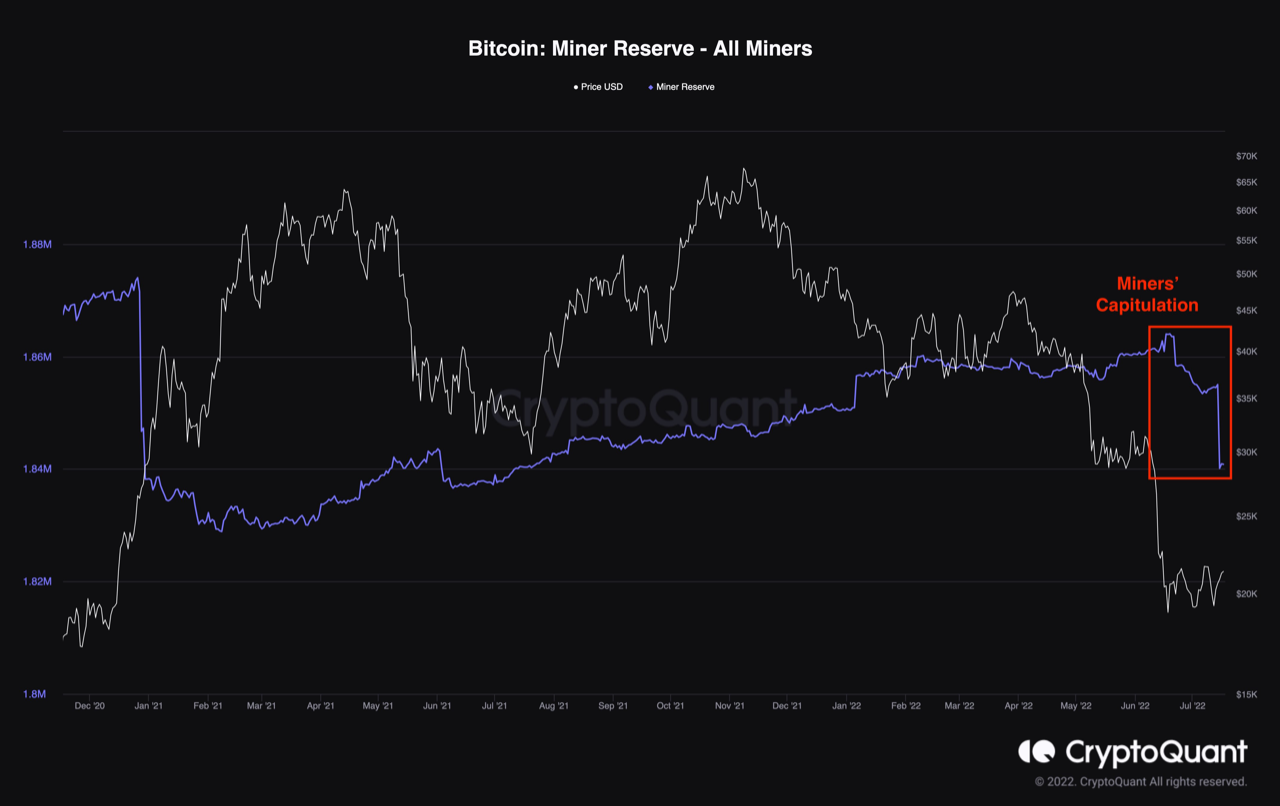
View original →Bitcoin’s price has been consolidating at the $20K level for the past few weeks, making investors wonder whether an accumulation or distribution phase is going on. Looking at the Miners Reserve chart, it seems like the latter is the case.
According to CryptoQuant’s data, the miners have offloaded the largest amount of Bitcoin over since January 2021 over the last couple of weeks. The Miners are under a lot of pressure as the recent price decline of Bitcoin has made mining far less profitable, putting many miners at a loss. These miners are now forced to sell their Bitcoin at current market price to minimize the potential losses and lower their overall risk.
⚠️ Consequently, the selling pressure caused by this capitulation event could push the price even lower in the short-term and Bitcoin could drop well below the $20K mark in the near future.

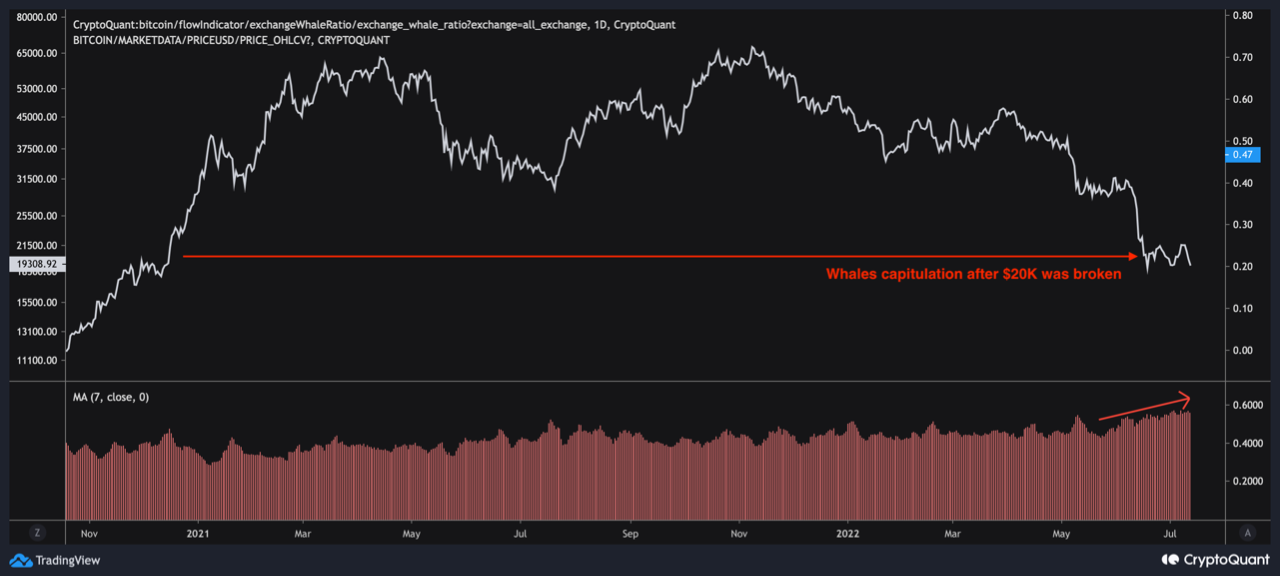
View original →✔️ Whales (investors with huge capital) who are one of the stronger hands in the Bitcoin market, have recently entered drawdown region, as the market has dropped below their realized price and the significant $20K level. This means that many of these large entities are now holding their coins at a loss, forcing some of them to sell before a bigger loss is inflicted on their portfolios.
✔️ The Exchange Whale Ratio metric which is a useful tool for tracking the Whales behavior, is showing a massive rise over the past few weeks, indicating a substantial increase in Bitcoin deposits to the exchanges by the whales. It seems like many whales have reached their risk threshold and are offloading their Bitcoin at these price levels.
❗️This selling pressure and rise in supply would likely cause another drop in the short-term. However, it also means that the bottom could be close, as Bitcoin seems to have entered the final stage of the bear market.

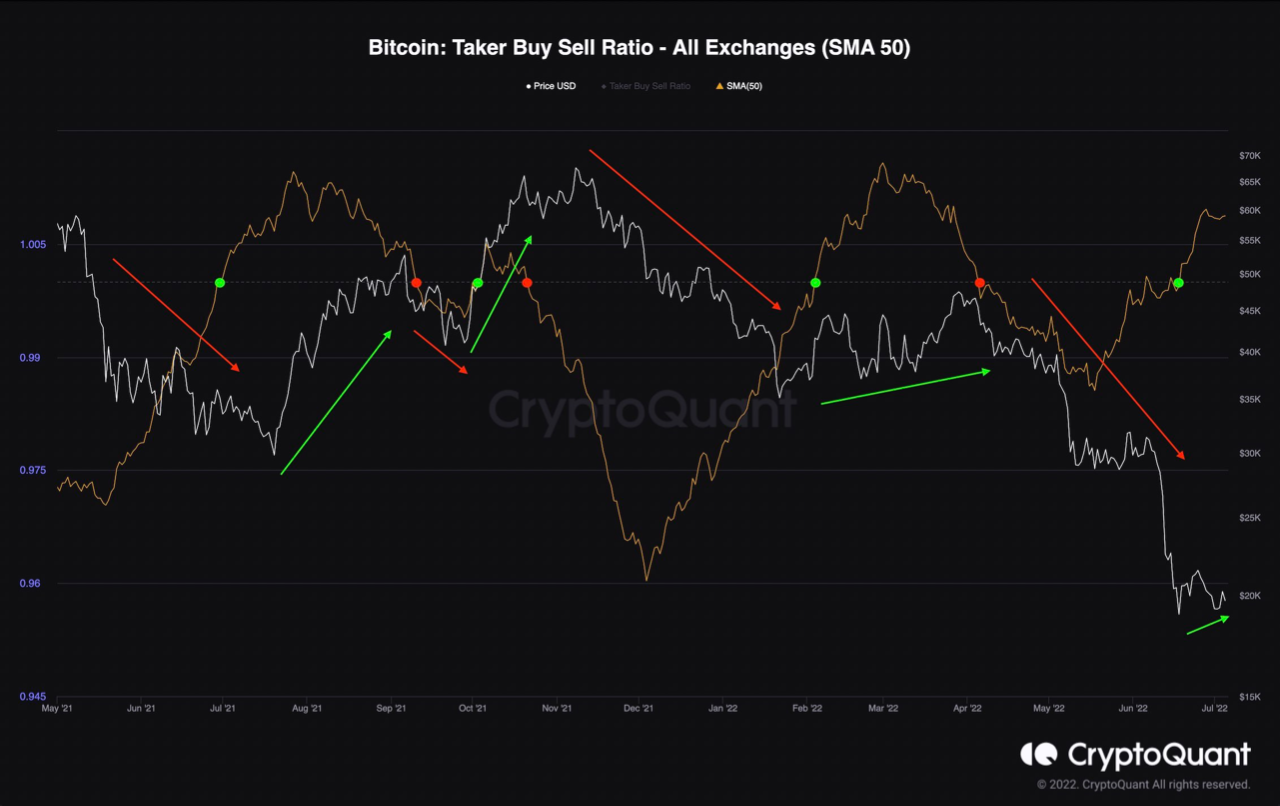
View original →✔️ Bitcoin’s price action has been mostly determined by the Perpetual Futures market over the last 18 months. One of the key indicators to evaluate the Futures market sentiment is the Taker Buy Sell ratio which in short, indicates whether the bulls or the bears are more aggressive and in control.
✔️ As demonstrated on the chart, values below 1 indicate more selling pressure and would likely coincide with bearish price action. Conversely, values above one tend to lead to bullish price action.
✔️ Currently, it is evident that this metric has broken above 1 and the price seems to be consolidating and potentially, start a bullish trend in the short-term. However, note that it could just be a consolidation or a bullish pullback before another continuation lower. So, many other factors should be considered closely in the coming weeks in order to determine if a bullish reversal or another bull trap could be expected.

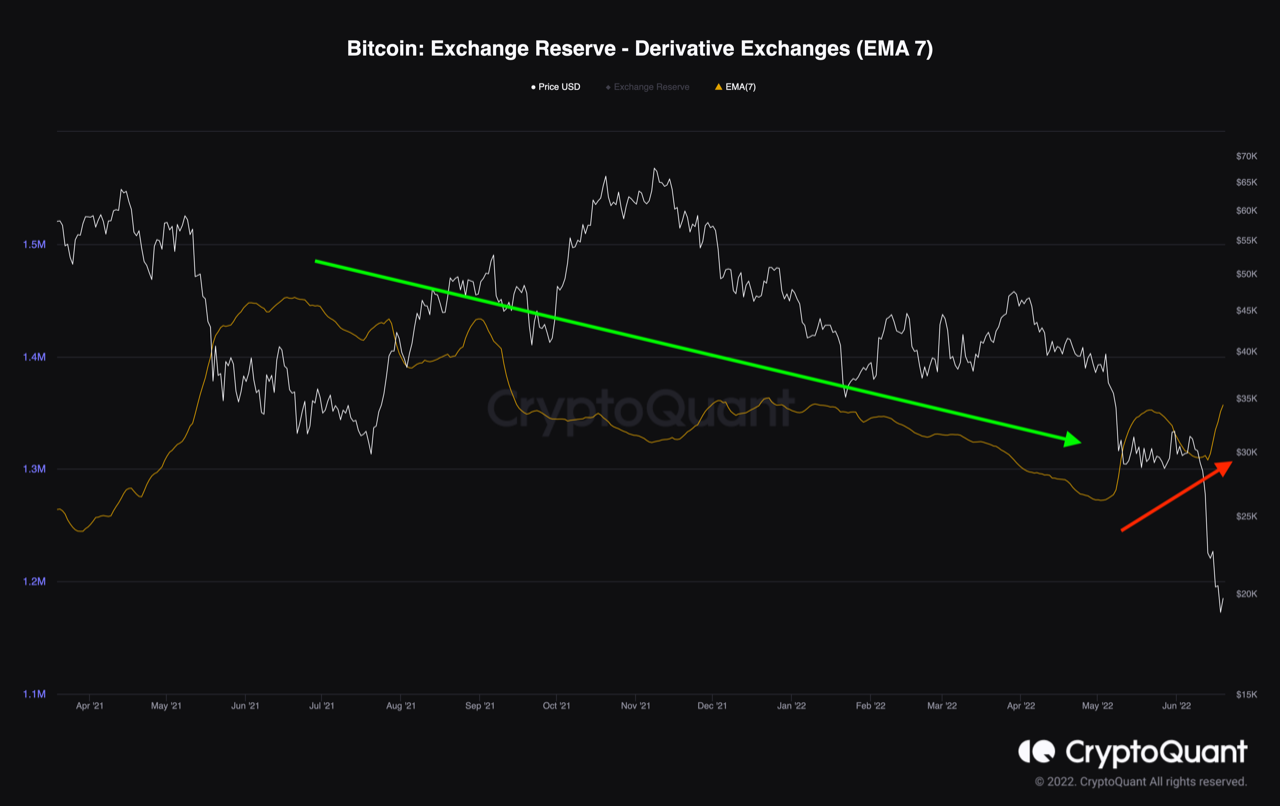
View original →📉 Bitcoin’s price has been crashing so rapidly that the long-term holders and even some whales are panicking as a result of their portfolios going into drawdown. This would cause these cohorts to deposit their coins into derivative exchanges and open leveraged short positions to lower their risk and hedge their portfolios against further price declines. However, this aggressive shorting would create even more selling pressure and push the price even lower.
📈 On the other hand, it would also create a possibility for a huge short-squeeze, if sufficient demand comes in and the price suddenly reverses to the upside. The potential short liquidations and profit taking which would usually occur at price bottoms, would cause a rapid surge in price and could even start a new bullish phase. Although, with Bitcoin’s recent heavy price action, it may still take some time and even more drop in price, before a massive short-squeeze could be expected.

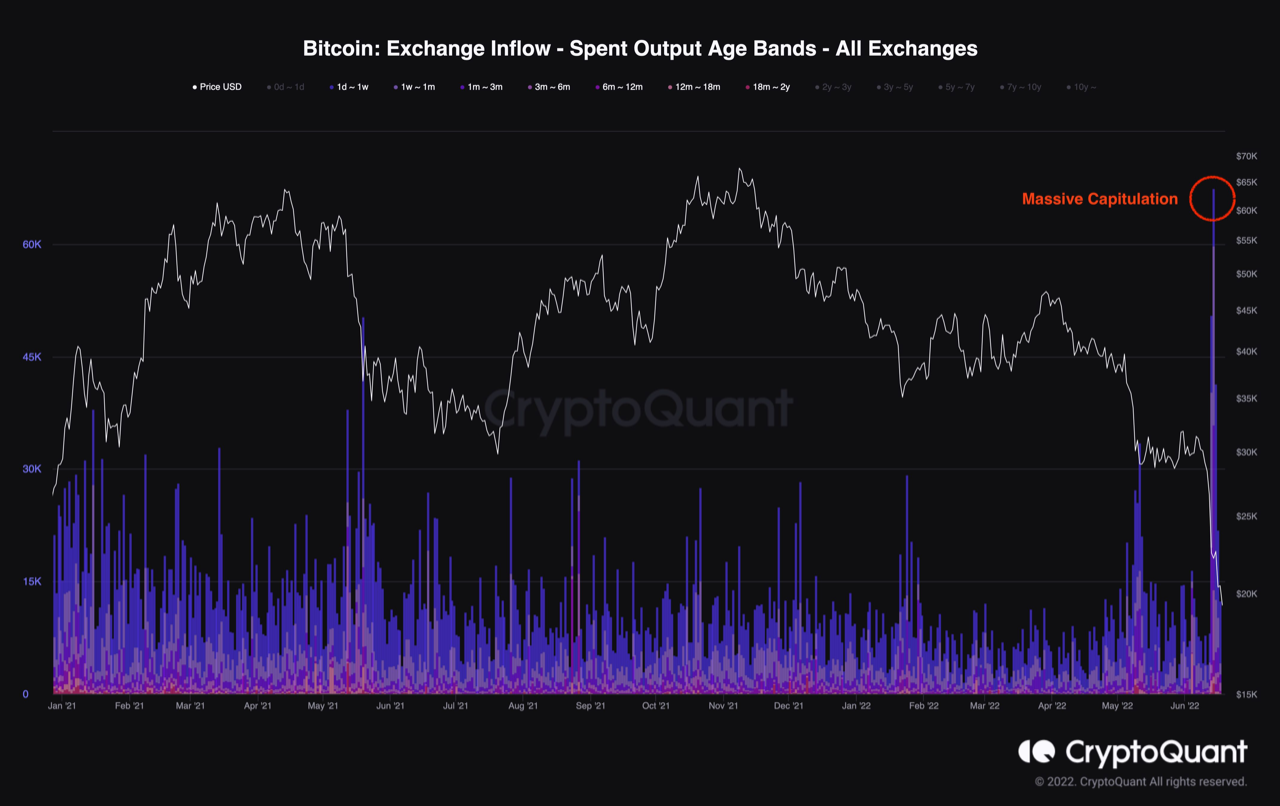
View original →✔️ Bitcoin’s price crashed more than 30% during the last couple of weeks, and the market is going through maximum fear. Looking at the exchange inflows SOAB metric, a very large amount of coins which have been bought and held over the last two years are being deposited into the exchanges. This massive capitulation event, indicates that many holders which have invested in the market over the last couple of years have reached their risk threshold and are selling their coins at a loss.
✔️ The consequential selling pressure is causing the market to drop even lower and there is still not enough demand to hold the price, even at prices more than 70% below the all-time highs. This lack of buyers could be due to many economical and geopolitical issues such as war and rapidly rising inflation in the US and Europe. So, the short-term future is still looking dark for the risk assets and even lower Bitcoin prices could be expected, after a potential consolidation/pullback.

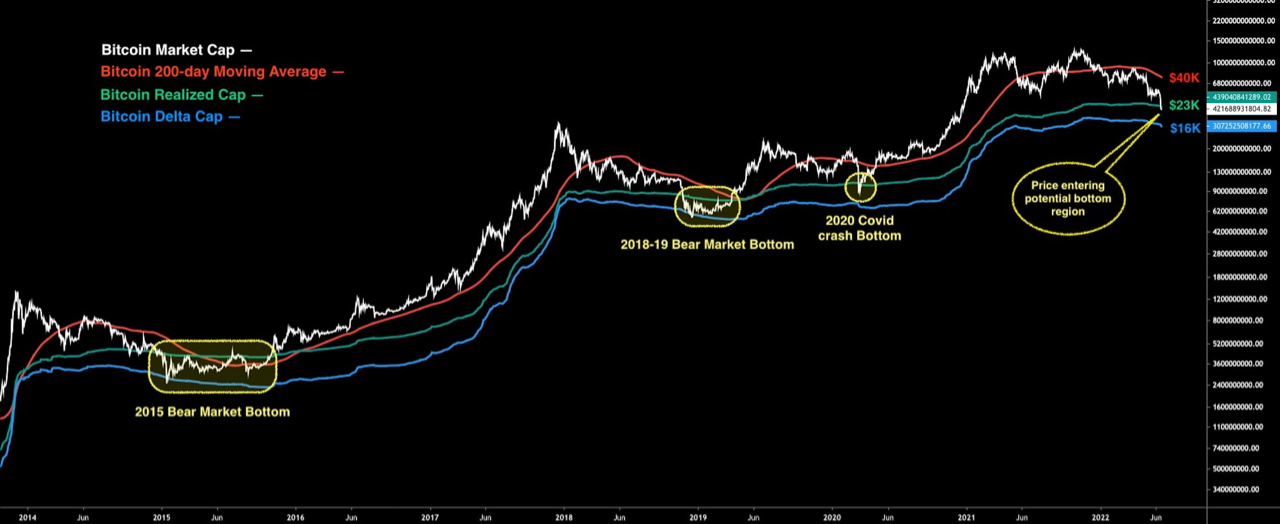
View original →✔️ Bitcoin's price has dropped rapidly towards the $20K region in the past few weeks and the main question on everyone's mind is were would the bottom likely form. Analyzing the past cycles could give us some clues.
✔️ This chart consists of the 200-day MA, Market Cap, Realized Cap and Delta Cap. It is evident that the market has formed cyclical bottoms between the Delta Cap and Realized Cap during the previous bear markets.
✔️ The Realized price is currently at $23K and the Delta price is around $16K, so the market has already entered the potential bottom range. However, considering the current global macroeconomic and geopolitical situation and even previous Bitcoin cycles, a bottom formation could take up to a year.
✔️ This bottom accumulation phase would end when the market rises above the Realized price once again, and the bull market would begin when the price successfully breaks above the 200-day moving average (currently at $40K).

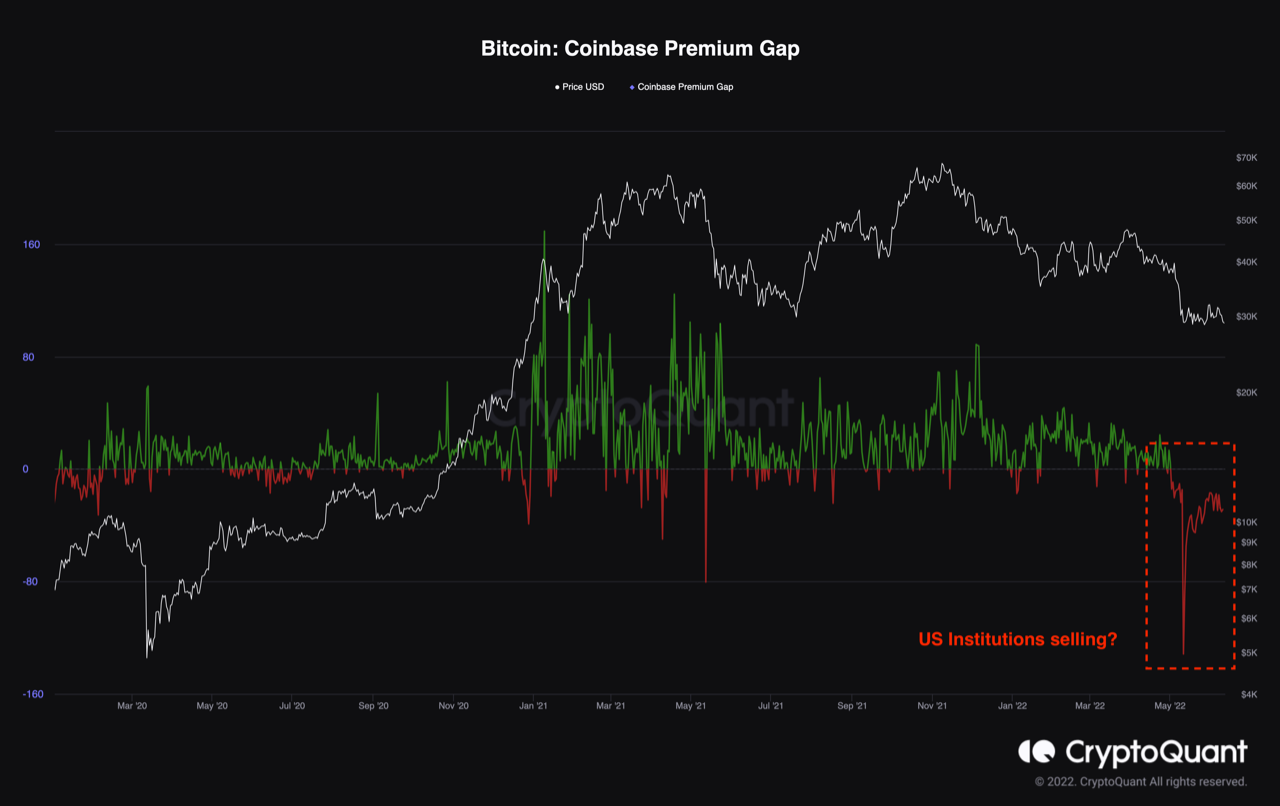
View original →Coinbase is the only publicly traded Crypto exchange in the world, making it the most legally transparent exchange among all, a significant characteristic which would attract the American institutions and wealthy families who are looking to invest millions of dollars in Bitcoin and Crypto.
This chart, demonstrates the Coinbase Premium Gap which is the Bitcoin price gap between Coinbase Pro and Binance.
It is evident that this metric has rapidly dropped into the negative territory in recent weeks, pointing to massive selling pressure by the US investors and institutions, after almost 2 years of constant accumulation.
It seems like the growing inflation in the United States is taking its toll on the American people and businesses, and many of them are reaching their risk threshold and getting out of the Bitcoin market. A continuation of this pattern could lead to even lower prices as the market lacks sufficient demand at the moment, and would be overwhelmed by this large supply.

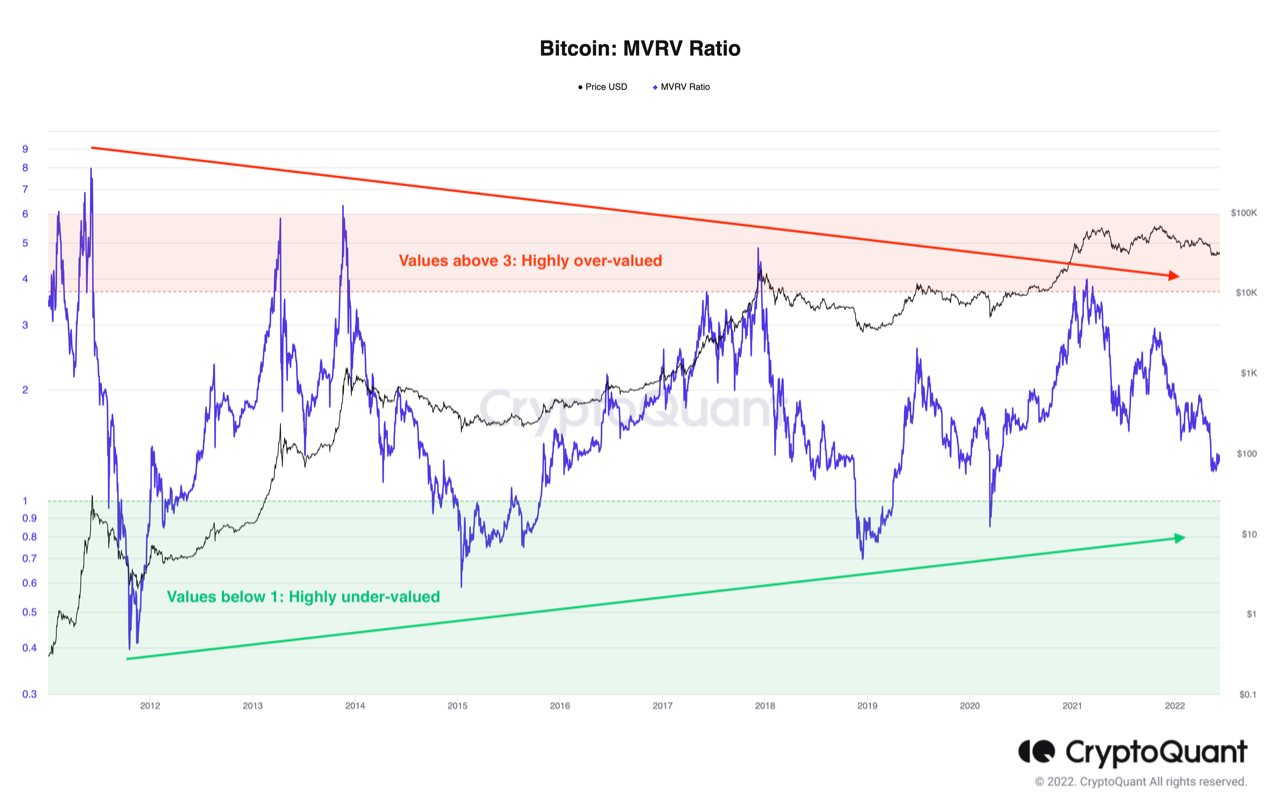
View original →✔️ The MVRV ratio is a useful macro indicator which is calculated by dividing the Bitcoin market cap by the realized cap. This metric can be used to determine the bull market tops and the bear market bottoms with decent precision.
✔️ It is evident on the chart that previous bear market bottoms have occurred while the MVRV ratio had values below one. These often-lengthy periods are when the smart money and intelligent investors tend to accumulate Bitcoin, creating sufficient demand to form a price bottom. The MVRV ratio currently sits around 1.3, pointing to the fact that the price could still experience more decline before a cyclical bottom forms.
✔️ Another interesting observation is the diminishing returns and losses over the last decade, which points to Bitcoin’s decreasing volatility on the road to become the “digital gold”, as it tries to transition from a highly volatile risk asset into a more stable, deflationary safe haven.

View original →

