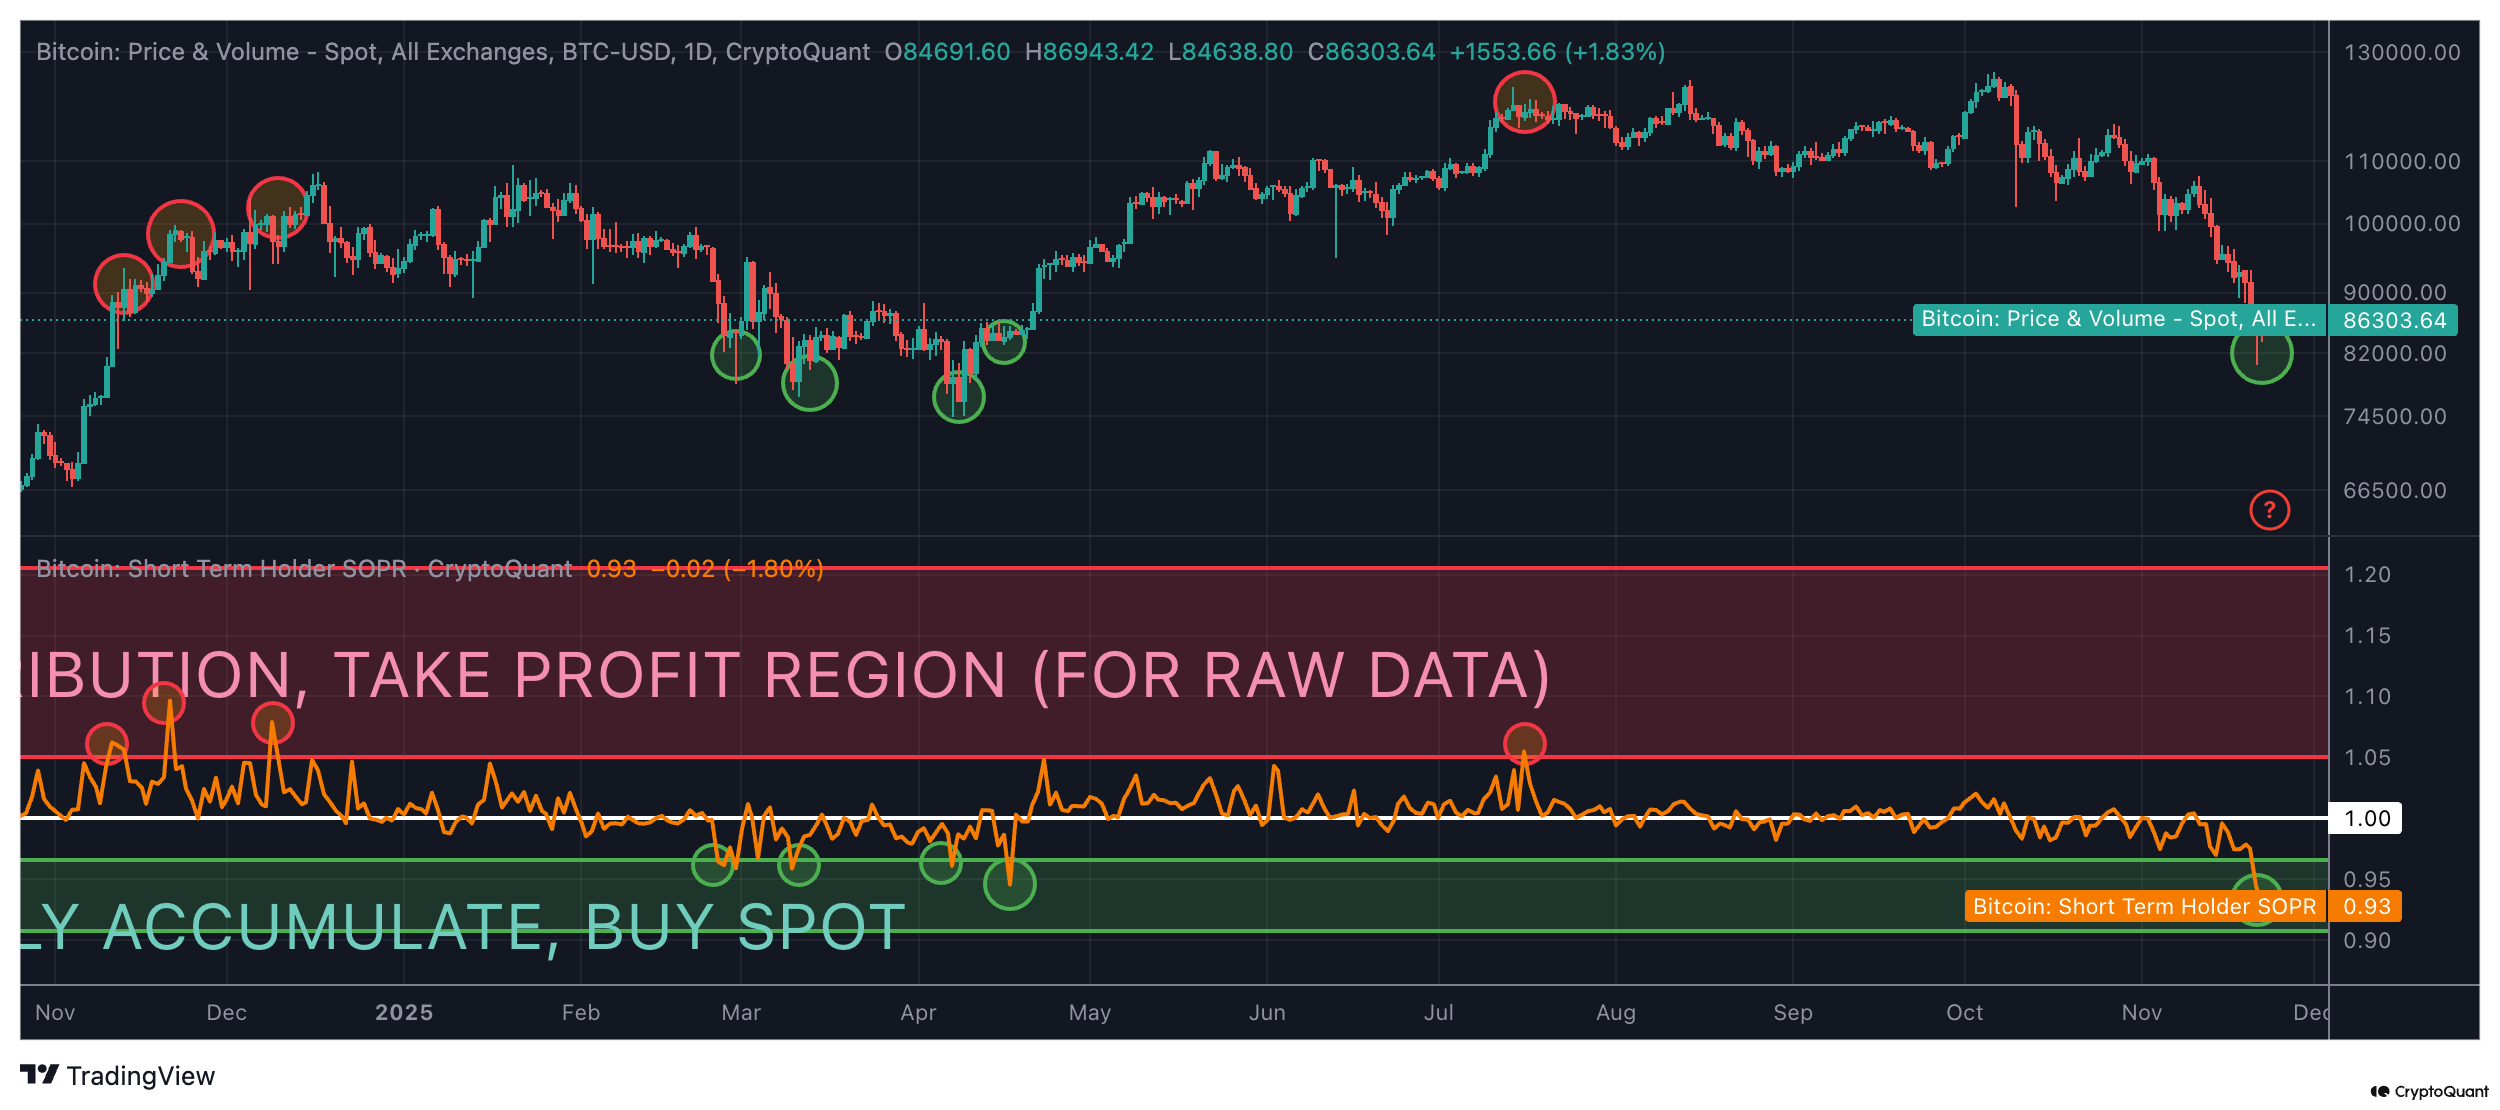
Tonight an alert on short term SOPR popped up and since it has been quite reliable in the past to indicate local and cycle tops and bottoms, every trader or investor should not ignore it. Although there were no significant spikes to flag tops this year, as with pretty much every metric onchain, signal levels flatten out.
That is why we should take this spike under 0.94 with even more confidence as a sign of current leg down dying down. (see screenshot from ProChart by @CryptoMe
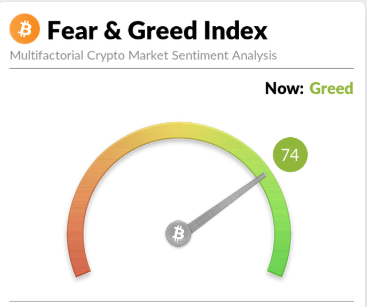
This has also confirmation in technical analysis as Bitcoin is oversold on 3D and Daily timeframes, as well as simple sentiment fear and greed index has been at Extreme fear levels for quite some time.
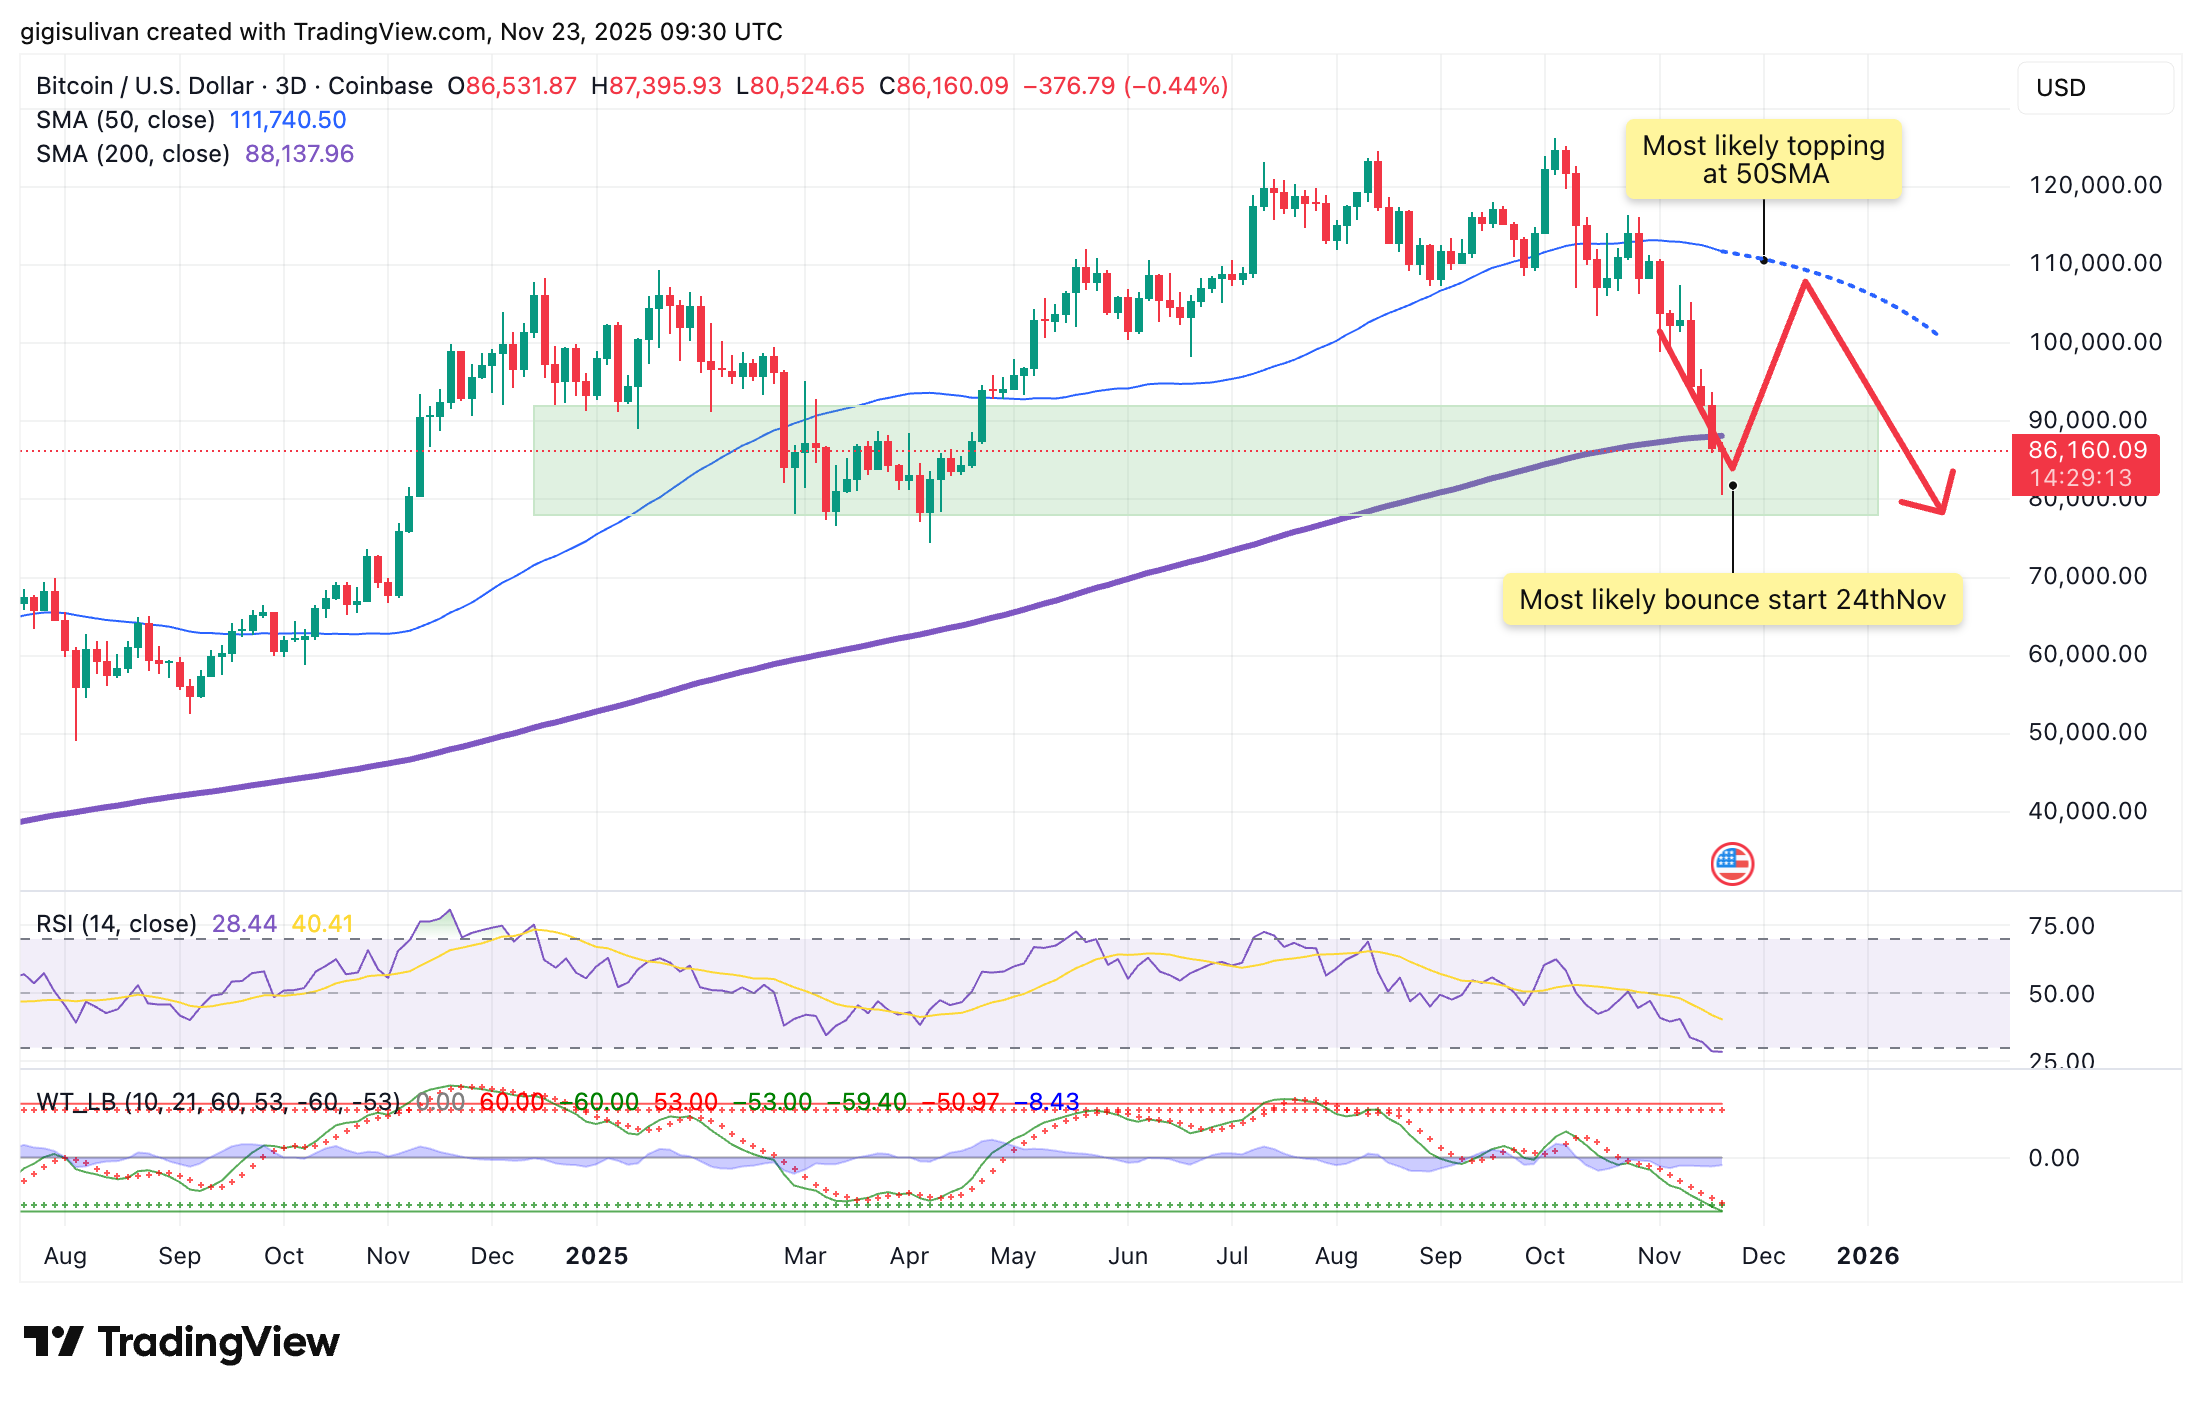
It highly corresponds with "dead cat bounce"/death cross setup I was outlining couple of weeks ago. Only thing that needs revising is the most likely range for this move up to end before continuation to down trend, considering how low we have gone this week and how previous setups post BTC bull run tops, most likely range sits between 99-105k, with lower probability of some move closer towards 50SMA on 3D to mimic the 2021 setup.
Next 15 days should give us the main boost up, although it is very likely Bitcoin's price will then range between 78-105k for the next few months until mid February. A lot of course depends on Stock Market volatility and the likes of SPX has quite a lot of room to fall before calling it even mildly oversold.
If Bitcoin's price pushes up above 100k quite fast, be prepared to see Bulls coming out with "Santa's rally" narrative and if we see over 105k, more people calling for new ATH and other bullish posts to get retail folks back into the market on false hopium.
This phase is just normal part of Bitcoin "preparing" for the next main phase of Bear phase.

View original →For those that already came to terms with Bull run being over, but are not into shorting Bitcoin what is next?
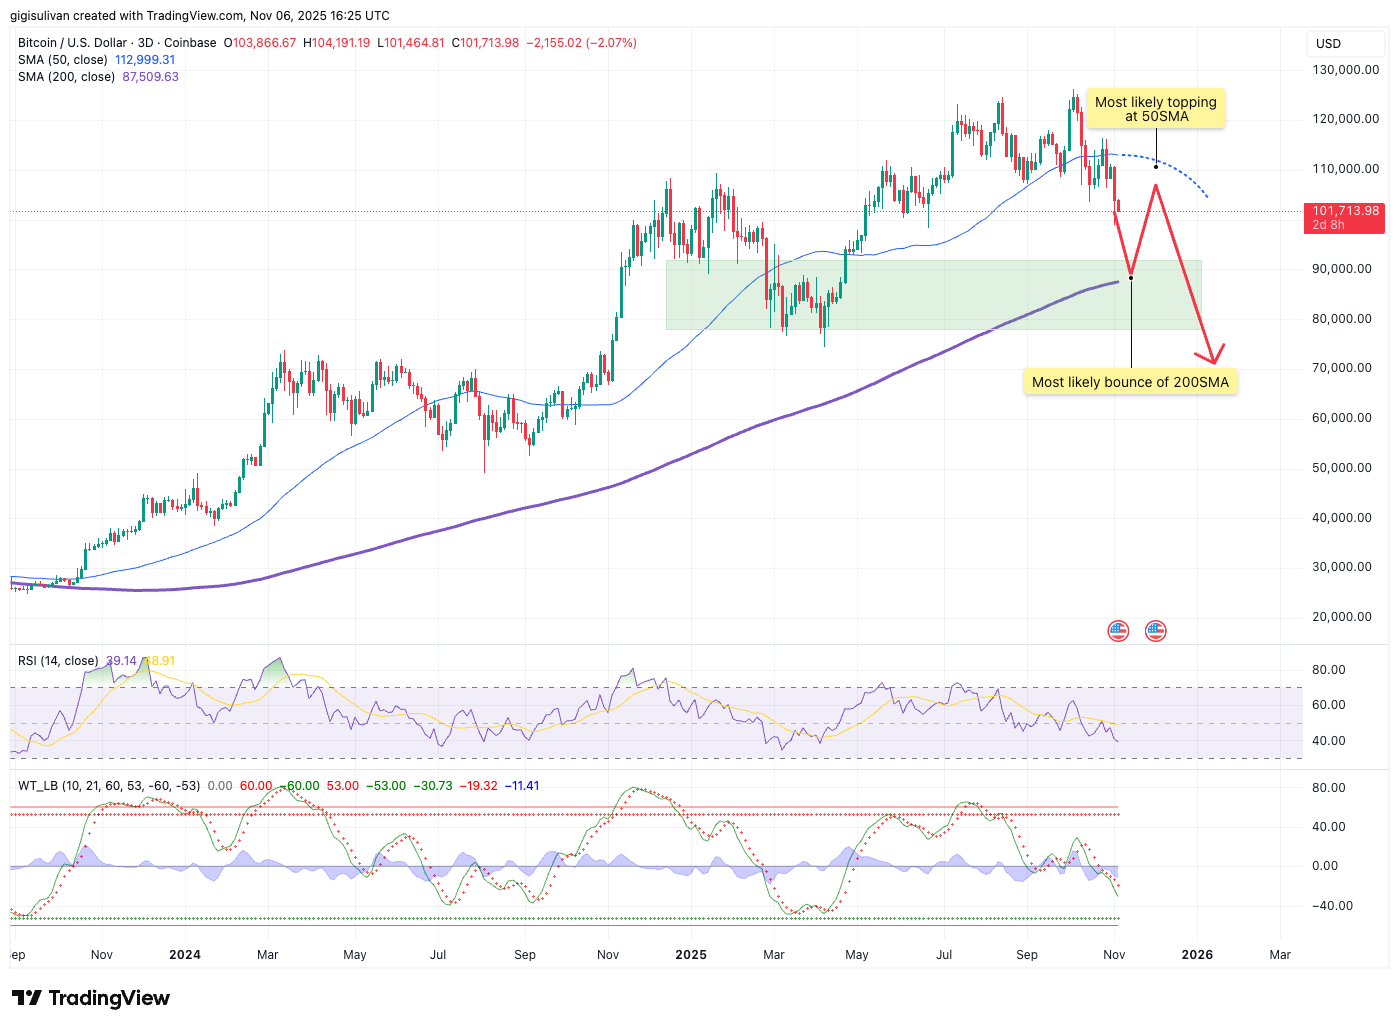
Dead cat bounce, or we should rather call it "dead bull bounce", is the next natural setup to give traders/investors last chance to exit market at reasonable prices before Bears kick into 2nd gear. Best timeframe to capture this movement is on 3day chart, where the 200 and 50 SMAs give us the most likely entry and exit targets.
As you can see in my screenshot, the potential zone for the bounce is between 78-92k and most likely time to hit it is in November. The length of bounce is harder to predict, but it is most likely to top out at 50SMA, so keep that in mind as the longer price will remain below it the lower the target exit. A reasonable range for exit sits between 105-110k. When/if price reaches there, expect media to hype about a new ATH incoming again, don't fall for it, it is a trap ;)
This setup will likely coincide with a "death cross" on Daily timeframe, that in most cases is a contrarian signal, but often it is a bit harder to pinpoint the support from which it will have a short recovery period.
No animals were harmed in this analysis in case anyone is worried.

View original →I wrote about it a month ago, and all signs continue to point to the fact this Bull run was over in October. There is plenty of social media posts about US legislation, FED rate cuts, the usual Institutional adoption etc. "reasons" for BTC to hit a mythical supercycle and go to 150k tomorrow and 500k next month.
Those that have been in this space long enough, know this is desperation calling, especially considering the fact we did not have a proper alt season and BTC's dominance remained high and you should stay calm and just analyse what is in front of you.
1. The cycle timelines
To date most reliable way to estimate when Bull runs end is to measure number of weeks/days between Bull run tops (consistently around 1425 days) or from Bear market bottom to Bull run top.
Even if you don't want to bother counting days, a clear pattern of BTC topping up every cycle a month earlier is hard to be missed, Dec 2017, Nov 2021, Oct 2025 .... next Sept 2029.
2. Technical analysis
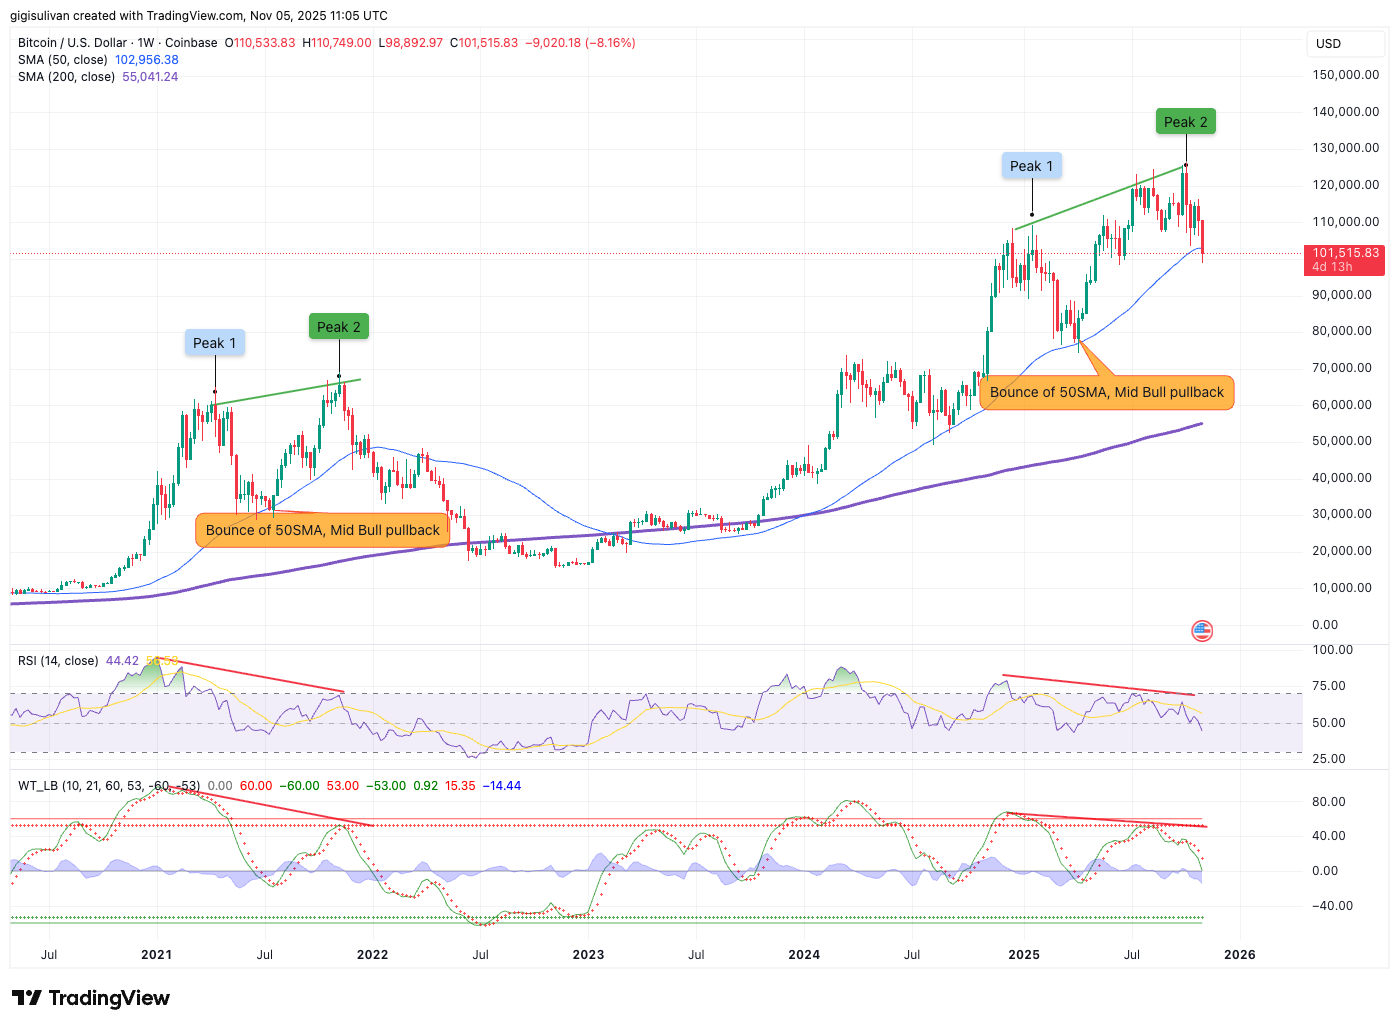
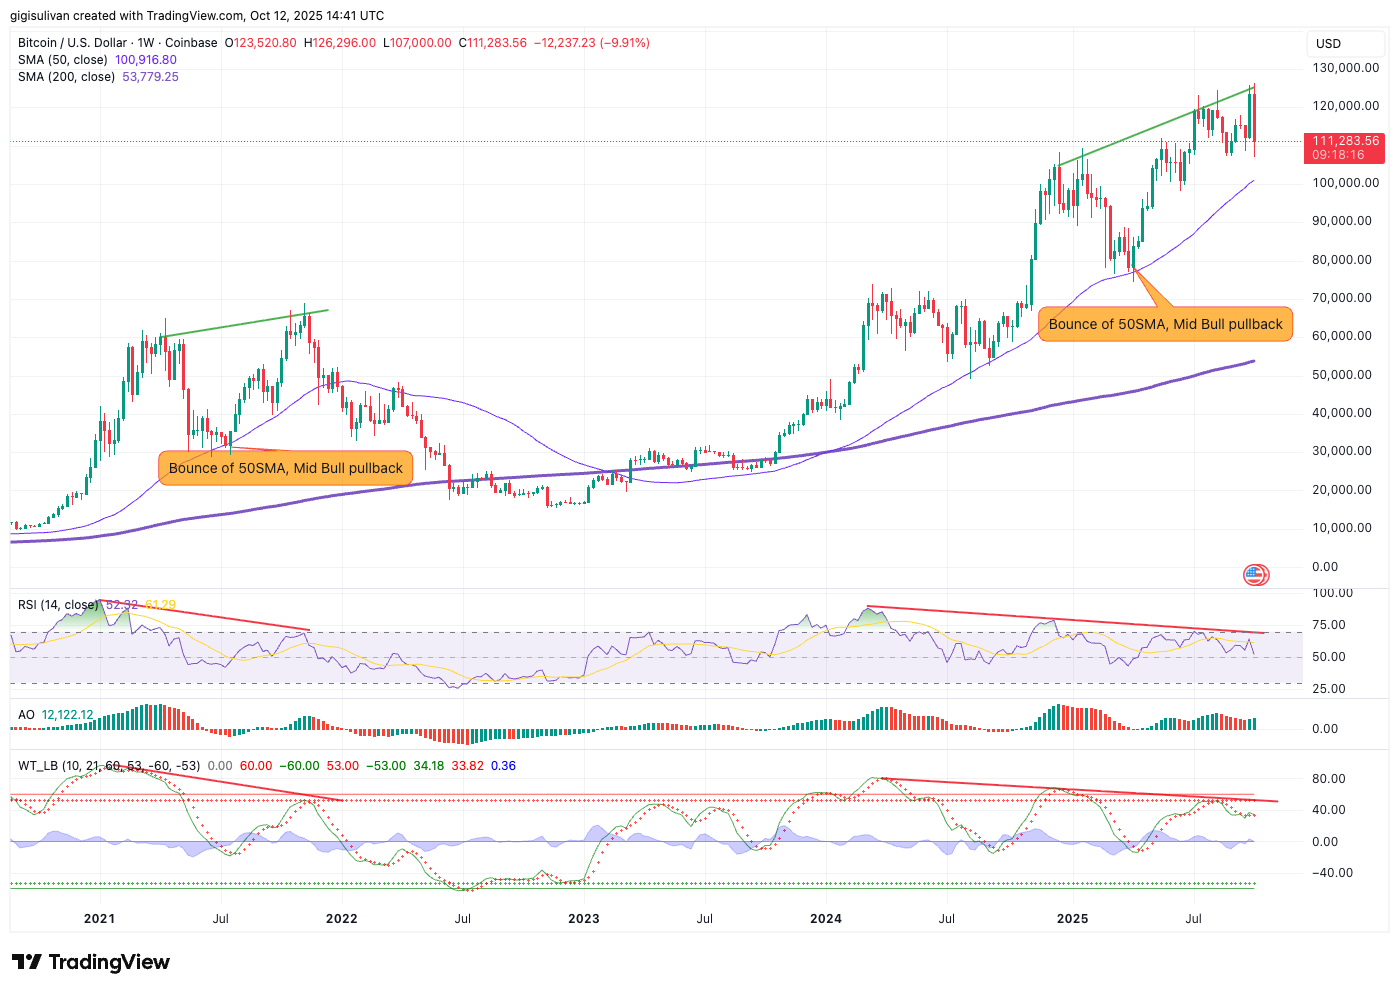
Since these are long term moves, always zoom out for better view and to filter out noise. 2025 was pretty much a copy/paste from 2021 Bull run, with two distinct peaks and a mid bull correction. Breaking below 50SMA and closing on Weekly as you see happening this week (blue line) will just be a final "nail in the coffin" (confirmation of Bull run ending).
Additionally what I've mentioned before, negative divergence is always very strong signal it is time to take profits, especially if paired with cycle timelines mentioned above.
3. Onchain Metrics
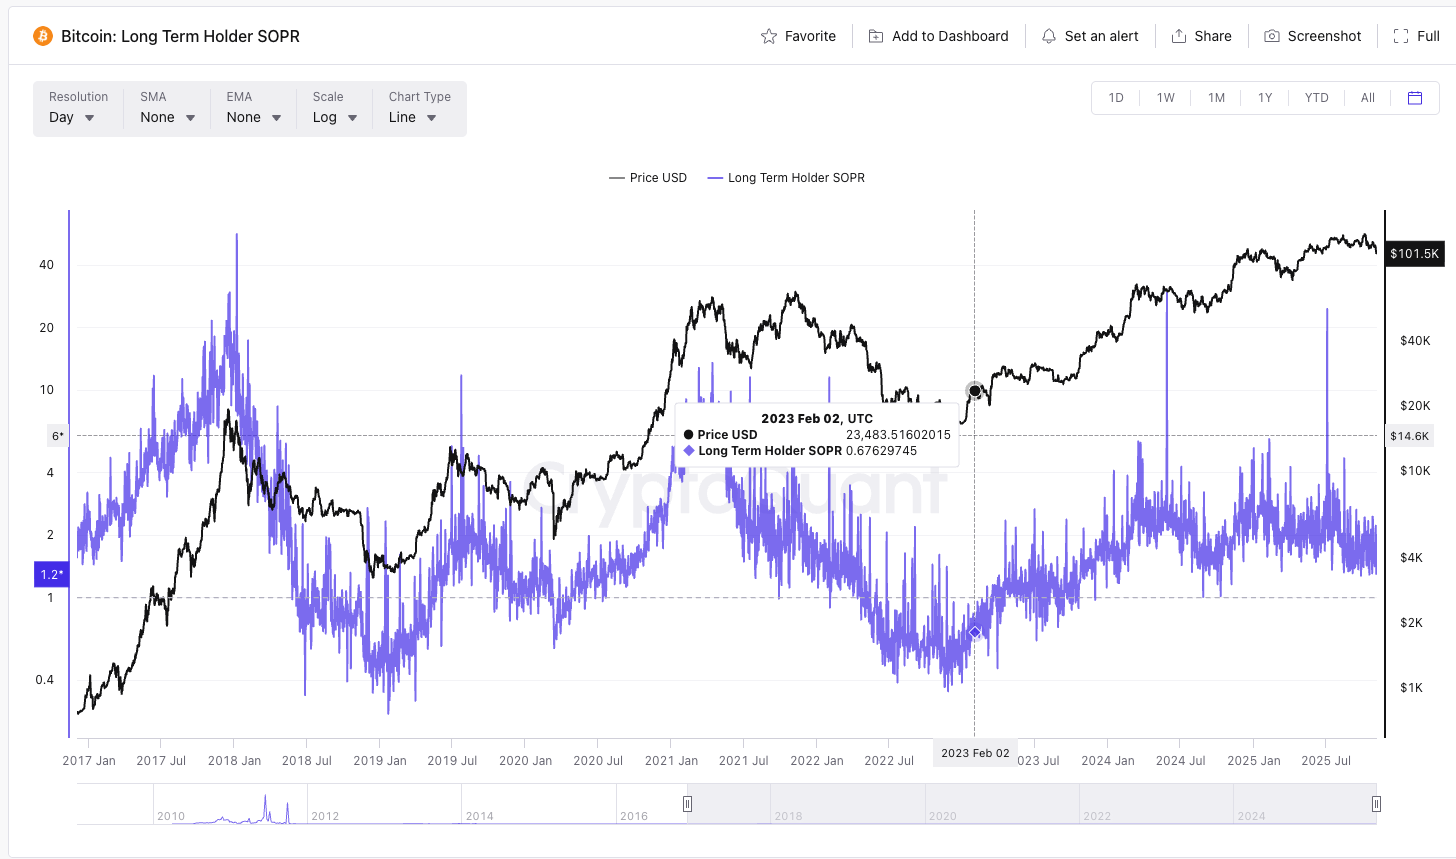
Everyone familiar with those, likely had alerts set at certain levels on MVRV, Puell Multiple, NUPL and few others, but none of them hit this cycle, apart from Long Term SOPR sending a warning above "6" value in July. As me and others pointed out recently, other metrics are flattening out so you should not take them at face value anymore and hope that ie. NUPL will hit 0.7.
Best to combine all that is available to you and not focus on one type of metrics.

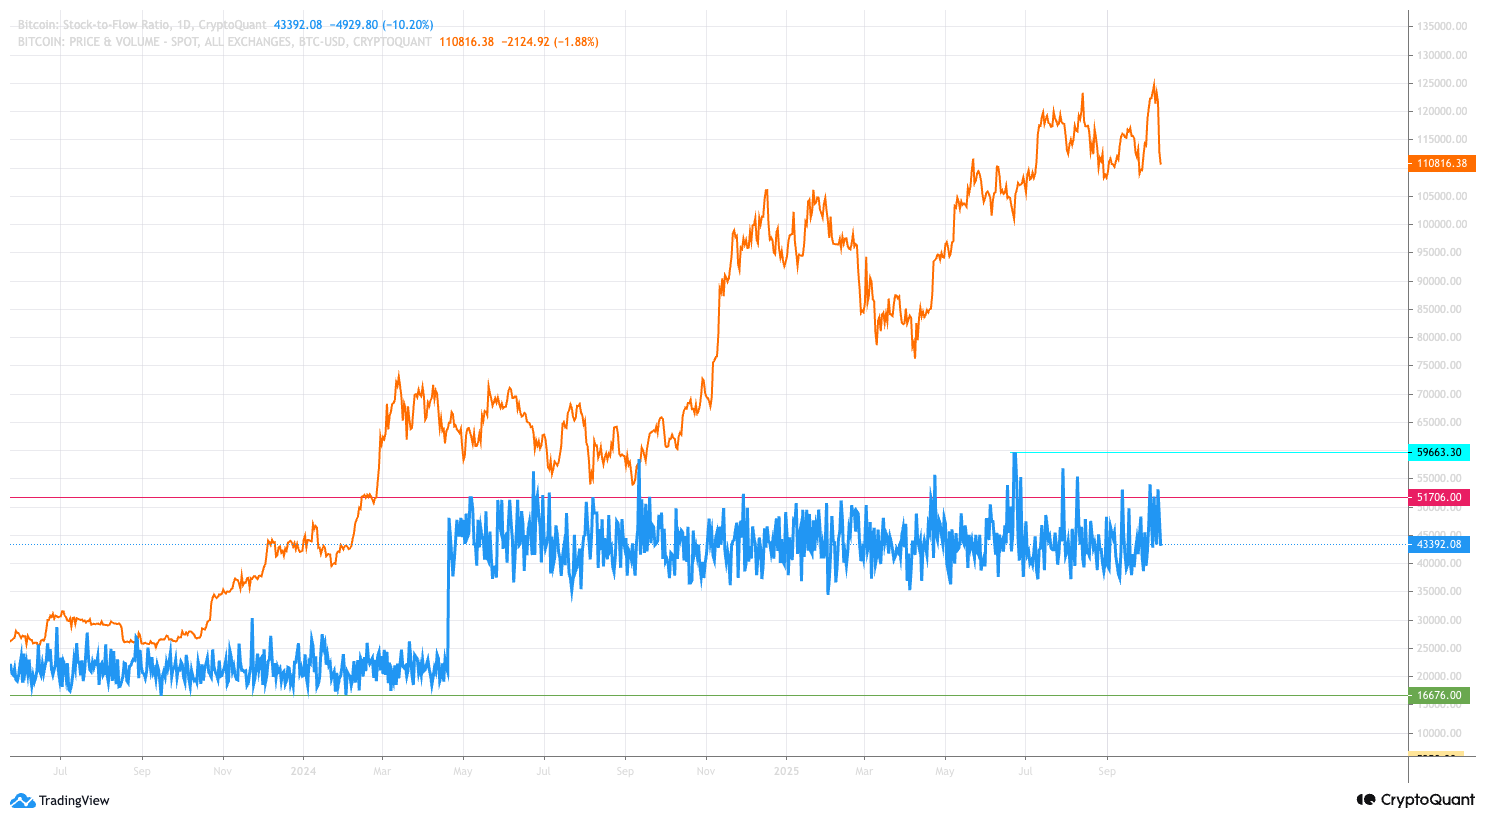
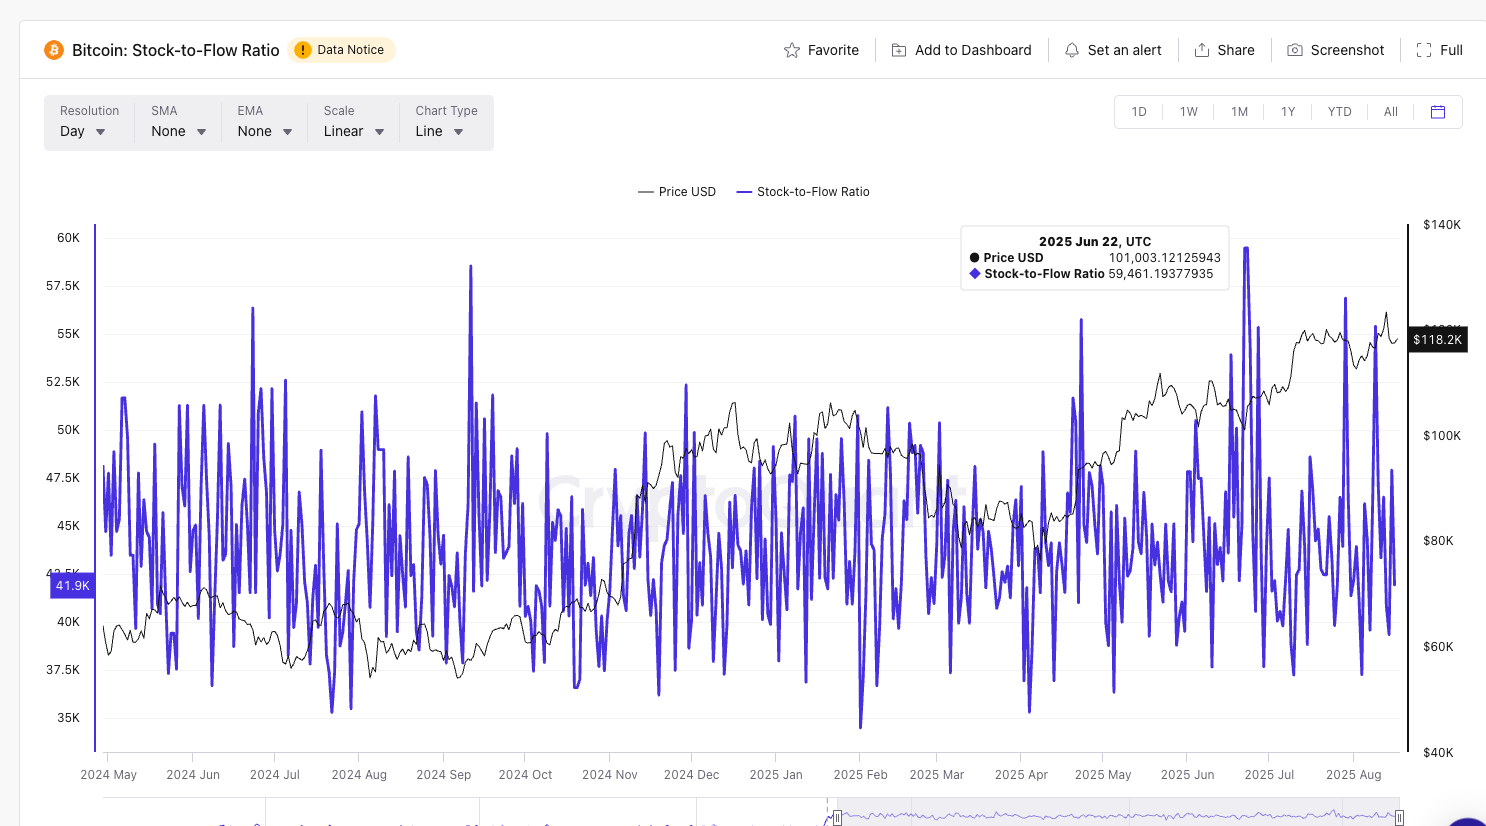
View original →I wrote about S2F multiple times in past few years as it is extremely reliable when finding the right entry price ranges during Bear market, and for Bull runs at least all but this current one, for exit points.
My long term prediction based on that metric for current cycle was a top between 150-200k and to get a more accurate range I was waiting for a spike in S2F ratio during the usual post 1st bull phase top pullback (see BTCUSD chart comparison between 2021 and 2025). This s2F ration spike unfortunately did not happen this time and I would be surprised if it pops up to signify another strong attempt at getting BTC price closer to 150k.
A week ago I wrote that we are likely into last 2 weeks of Bull run and with China tariffs "war" coming back into the picture and heavy impact of China restrictions on the semiconductors/chip production market that is heavily correlated with Bitcoin, this week's red candle is IMO marking the end of Bull.
If you look again at the attached BTCUSD weekly chart screenshot it clearly shows a very strong bearish divergence that similarly marked end of 2021 2nd Bull phase. It is hard to ignore such strong TA setup, paired with the usual timeline of end of Bull runs since BTC halving (or as some measure since top of previous bull cycle), even though the usual onchain metrics aren't exactly flagging the end.
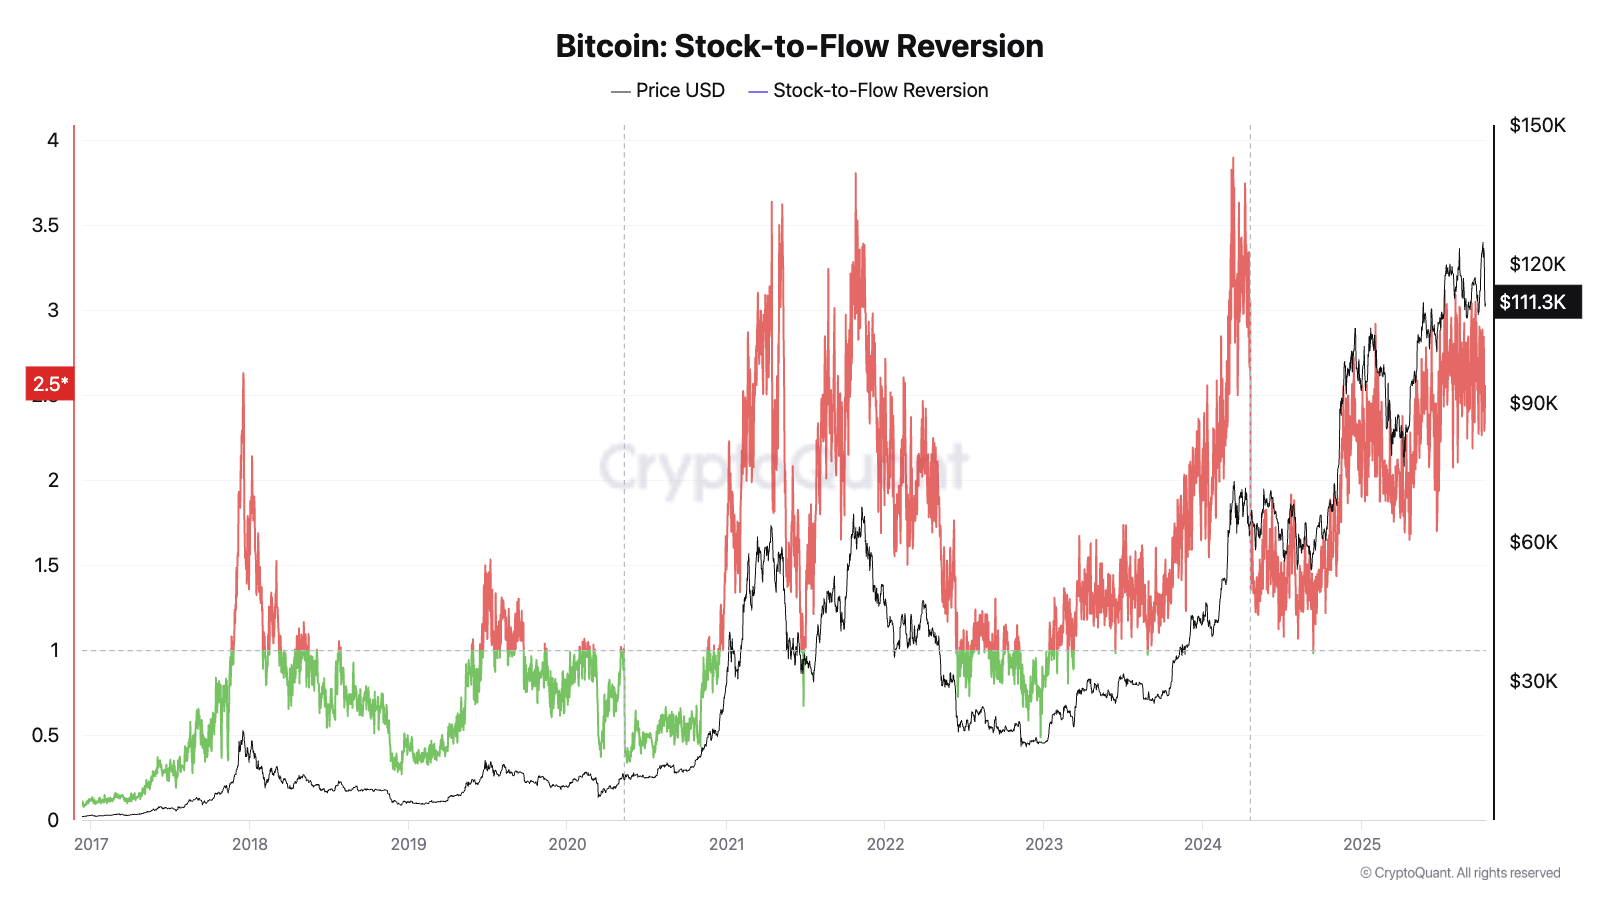
So if this is the end of gains, how low will BTC go by end of 2026? That is where S2F ratio chart is coming in handy again, just like it did when I predicted 2022 lows hitting below 16.7k. The spike from previous cycle should be the "value" range top at 51.7k (an absolute minimum where I think we will see BTC for a prolonged time in Q3/Q4 next year), with a reasonable bottom of range around 32k. I would expect a relatively short period of time when we would see BTC price below 32k, but for those with low patience, use S2F Reversion chart as your guide to when hit the BUY button again.

View original →Some call for a super cycle (just like 4 years ago) some for extended bull into 2026, but unless proven otherwise, so far BTC cycles are pretty consistent in terms of when bull and bear phase tops/bottoms occur.
The timeline for end of Bull the final push calculated based on previous cycles was known for a long while (you can see my previous posts or older newsletters, but it's usually around 546 days since halving), falling on around the 20th of October this year.
Whether you want to believe it or not, considering we are seeing another push into ATH, those next 2 weeks are likely your best shot at taking profits and then waiting patiently around 12 months for nice low prices to re-enter the market during Bear phase.
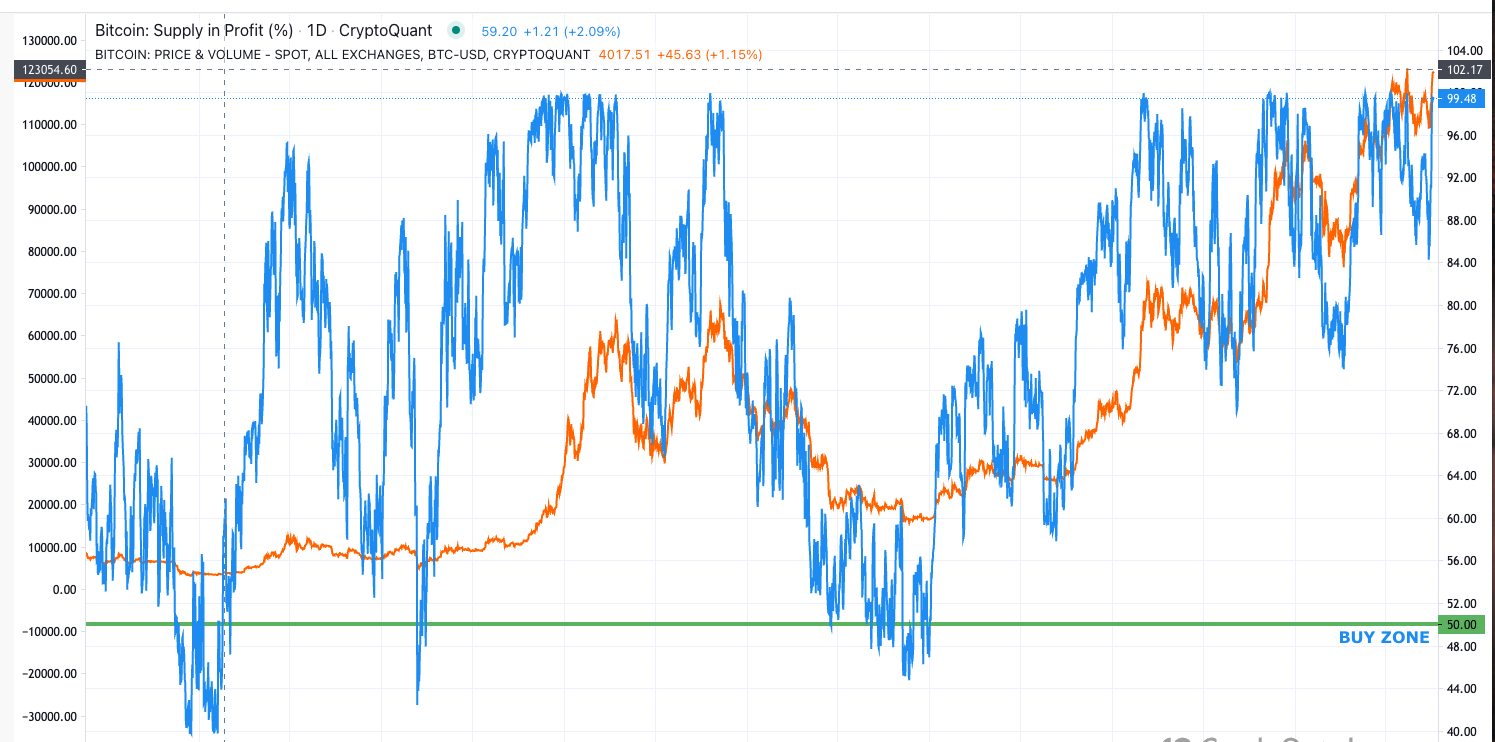
I am expecting to see Fear and Greed Index to pop over 80 just like in last days of Bull in Nov 2021. Take it as a very strong Sell signal, especially when paired with Supply % in profit running almost at 100%.
That said I did not see clear Onchain signals as I would normally expect to see similar to previous cycles, although every cycle the metrics like MVRV were always trending down, just as gains for BTC also trending down from cycle to cycle.
My expected top was between 150-200k, is looking less and less likely considering my estimated short time left, but that should not stop any reasonable trader/investor from taking profits at current levels regularly over the next few weeks.
Another thing that never happened was the alt-season, but maybe that is for the better and we are finally going to stop seeing overhyped projects that deliver no value with extreme market caps with Bitcoin holding on to it's dominance for a prolonged time. If you are holding altcoins, don't count on 2017/18 scenario happening, where BTC topped almost a month before a surge in alts happened, it might not this time and holding a bag of useless tokens will feel much worse than cutting losses or taking smaller profits now.

View original →Bullish(Nuanced)BTC
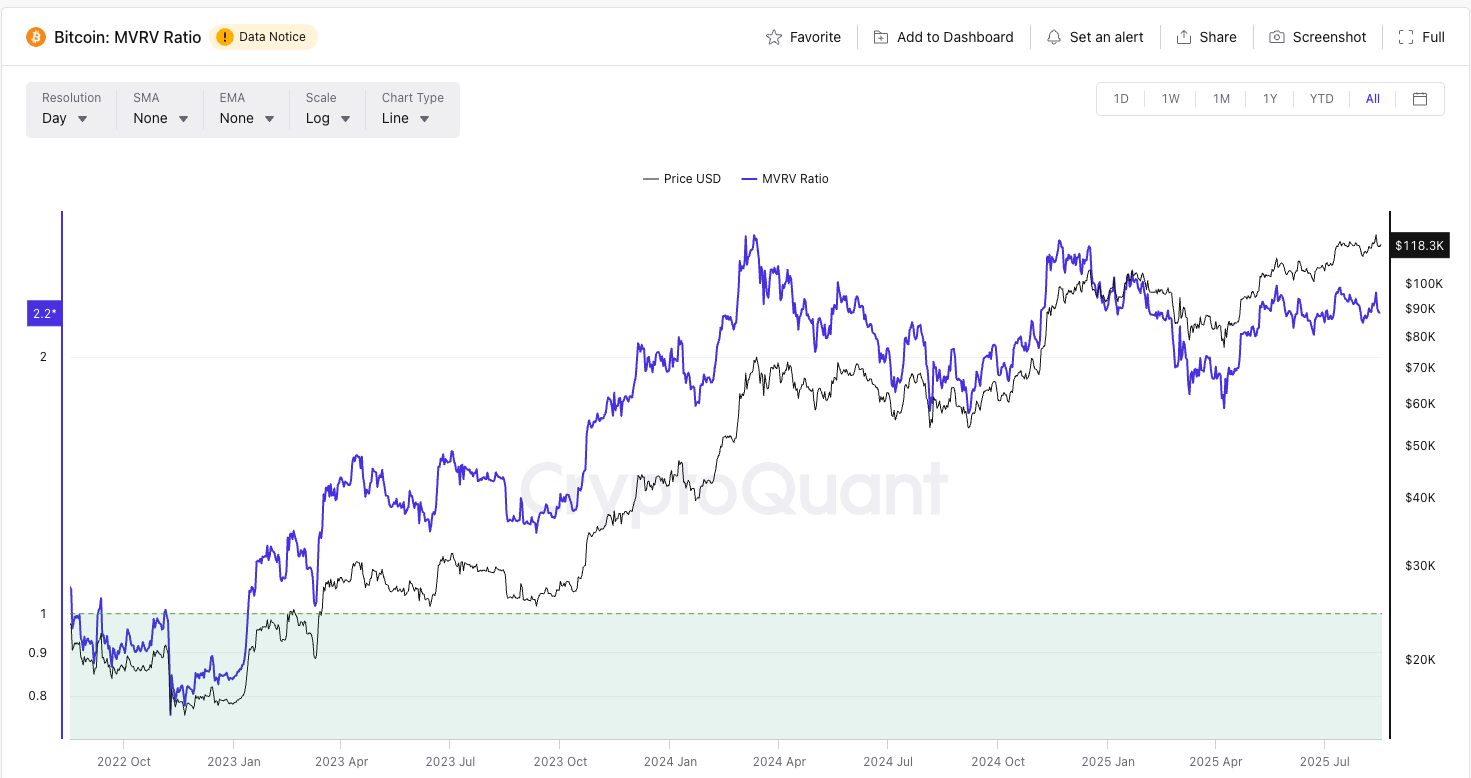
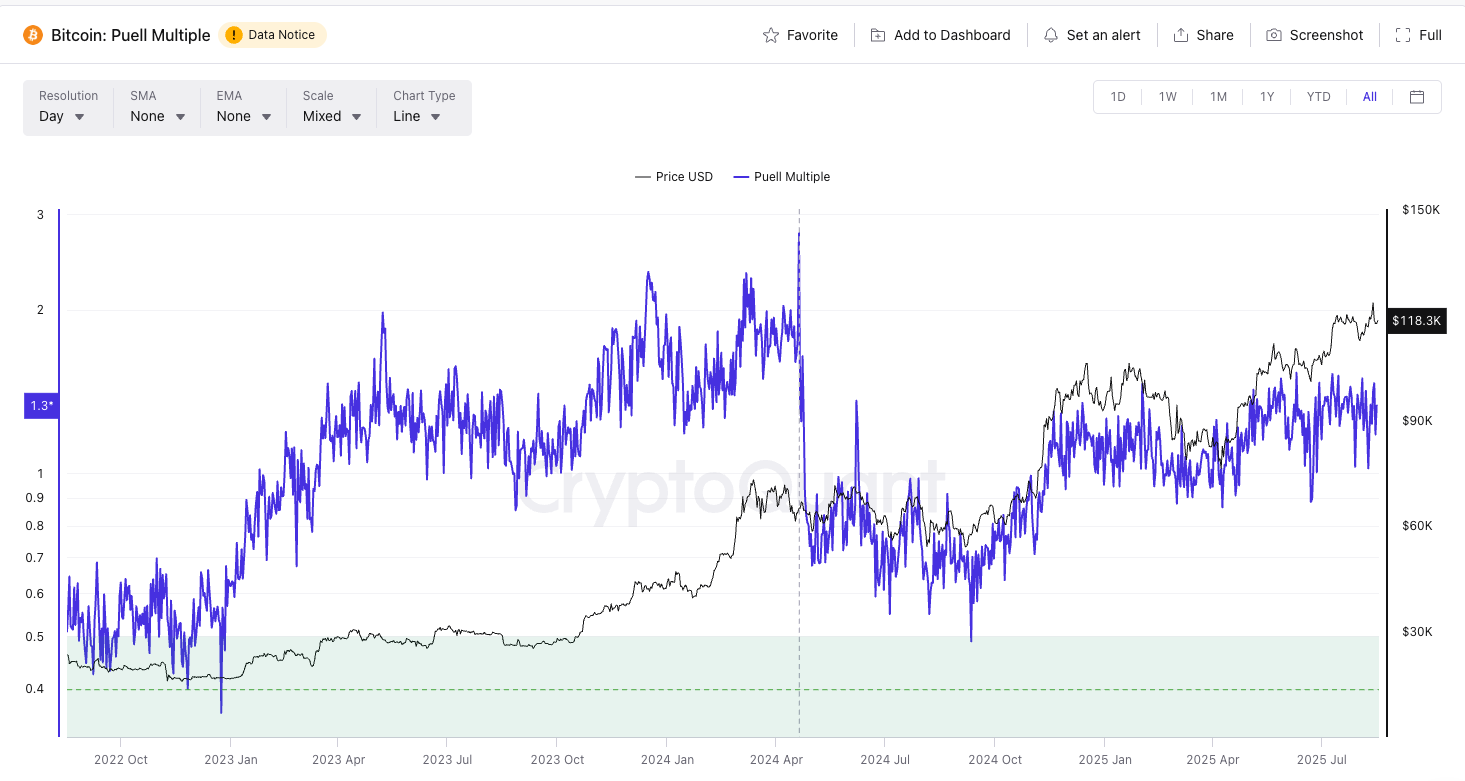
8/17/2025 In this last part today, I will look closer tat MVRV and Puell Multiple, two very clean onchain metrics that anyone can use to spot ending trends and timing the exits or entries in the Bitcoin and Crypto market. Please note that for best analysis you should get the Advanced Plan to be able to compare with historical data of past cycles.
MVRV
While most indicators flatten out a bit over time, meaning past top values indicating end of Bull or Bear run, I still think we are going to see MVRV popping over or much closer to "3.0" in the next 2 months.
If you have an option to set an alert on your CQ account, please do and take it seriously if it does pop over 3.0 and especially if closer to 3.5.
You can also clearly see how without fail MVRV flagged best time to buy in 2022, so definitely one metric you should not ignore.
Puell Multiple
While this onchain metric seemingly moves very much like MVRV it focuses on miners and can often even trigger buy signals outside of main Bear phase as seen in Sept 2024.
Current values are still quite moderate, aligning with other analysis that we likely still have 8-12 weeks before this Bull run is fully over.
As with MVRV, I highly recommend you add an alert to trigger if this value hits 4.0. While this is a bit below the usual top, it will let you know to observe all different metrics more closely (think daily vs weekly).
As always past performance does not ensure future results will repeat, but even if one metric fails to alert us, others are highly likely to still flag end of Bull run is near.

View original →One of the best if not the best indicator for cycle tops and bottoms for Bitcoin, has been Stock to Flow Ratio. If you have not read my past analysis that predicted the bottom range of previous cycle to be below 16.5k it also indicated this cycle's tops to reach 150-200k range.
The final piece to be able to pinpoint the top was always a spike during initial pull back after first main push up. It is very likely we are already past that step considering new highs after the March slump. That usual spike has not happened in similar way it did in past cycles, as you can see on screenshot, remaining well below 100k and even below tops from 2021.
I still think we have a good chance of reaching 150k although ideally I'd like this metric to spike up before end of September for confirmation.
Regardless of what happens this year, I can already say with high degree of confidence (good news for those that still hope to buy cheaper BTC) that during next Bear phase (likely bottoms Oct/Nov 2026) we should expect a retrace back to under 35k USD.
In Part3, I will look at two reliable onchain metrics for timing your exit from Bull run.

View original →In this 3 part Bull run check looking at current state of onchain data, I will try to give you some indication of what metrics say and how much time is left for you to reap any rewards if you do hold some crypto assets or whether it still makes sense to buy anything.
For those that followed my insights from previous years, you will know I have a set of onchain and technical analysis metrics/setups that time and time again give very accurate entry and exit signals. (note: most of these are for long term traders only, but as we are close to the end of Bull phase in this halving cycle these are medium term).
Offchain metrics that give you medium and long term signals is Fear and Greed index, and not only the crypto one but also the Stock market one. Contrary to some Bitcoin maxis or crypto hopefuls, neither is anywhere near decoupling from the Stock market and continue to be highly sensitive to global macro economic impact.
Where are we then on both in recent weeks?
Stock Market F&G Index: 64 (Greed)
In general still trending up, any return to 75+ values will be one of your signals that some profit taking should occur especially if combined with Extreme Greed on crypto index
Crypto F&G Index: 64 (Greed)
No surprise here and still some room for movement upwards, again anything 75+ you should consider taking small profits and if BTC hits close to 150k and this will be in 85+ range it is highly likely the END is near.
I will focus bit more on the onchain metrics in part2, but as today one of my alerts triggered lets look at Long Term Holders SOPR.
In the past repeating values of 4+ were an indicator of any larger move up exhaustion and eventually end of bull phase. We had a very strong spike early July a 4+ spike yesterday which potentially means a retrace from recent tops towards 100k before Bitcoin makes any further journey up to new highs.

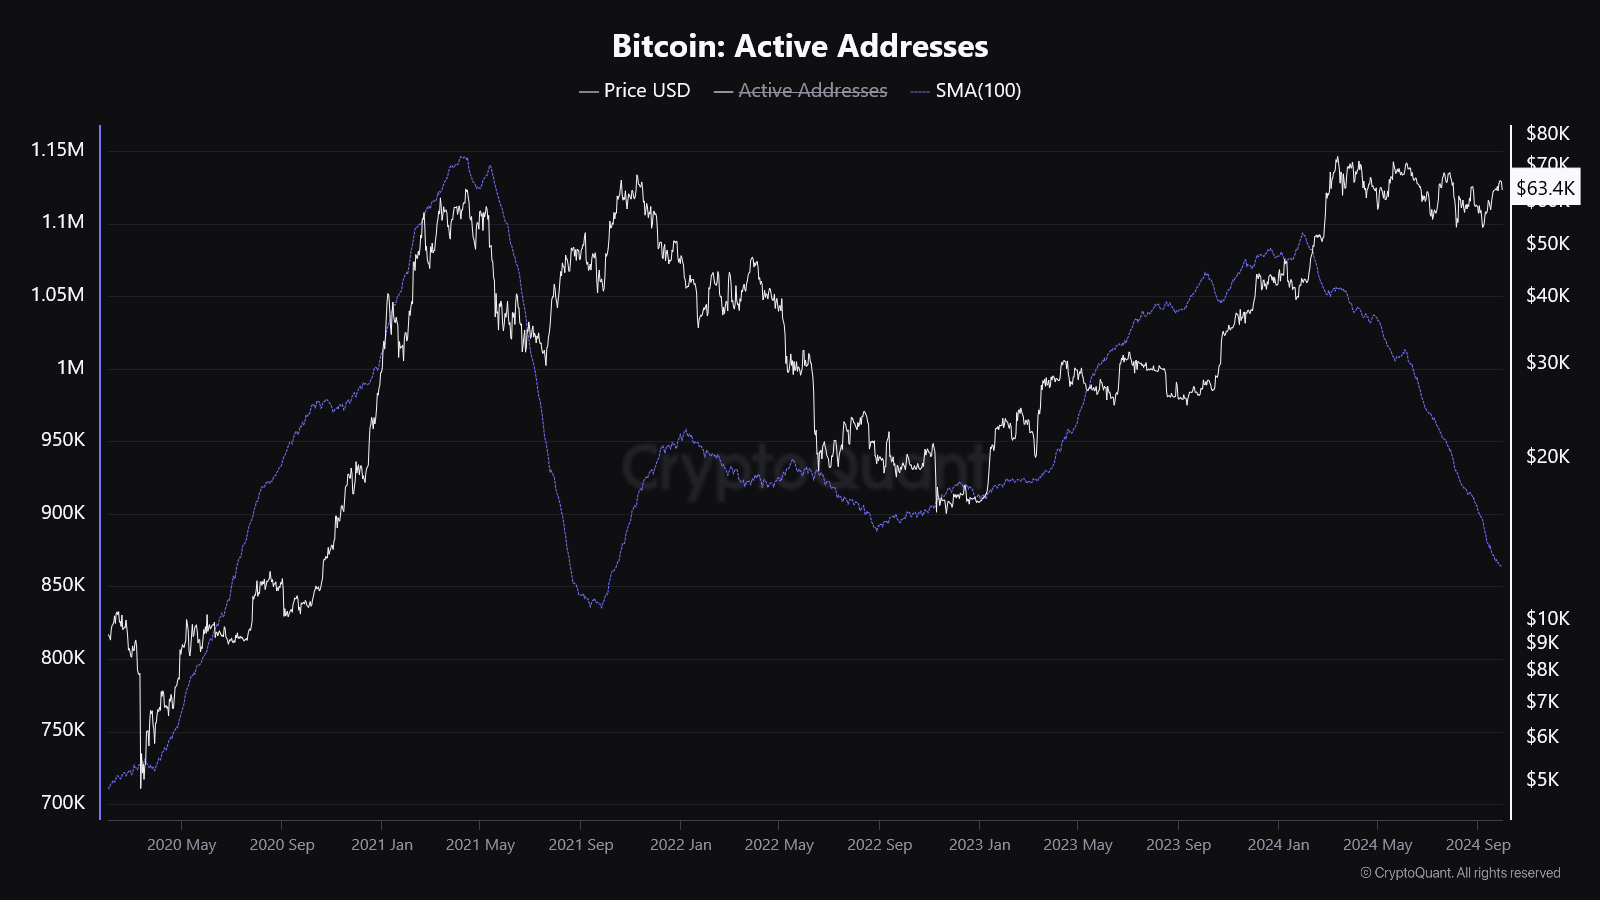
View original →Total number of unique active addresses has been in a steady decline since March this year and has to be taken as seriously negative signal. While Bitcoin's price remains in a sideways sloping down movement in same time frame, growing worries in US around employment data, FED cutting rates (never a good medium term sign for risk-on assets) that did not boost stock market significantly, add up to a bearish sentiment for crypto.
As you can clearly see this is the biggest decline since 2021 and unless reversed soon, looks heading for under 650k that we have seen in 2018 bear market.
You should not be surprised if BTC's price starts catching up with address activity trend very soon.

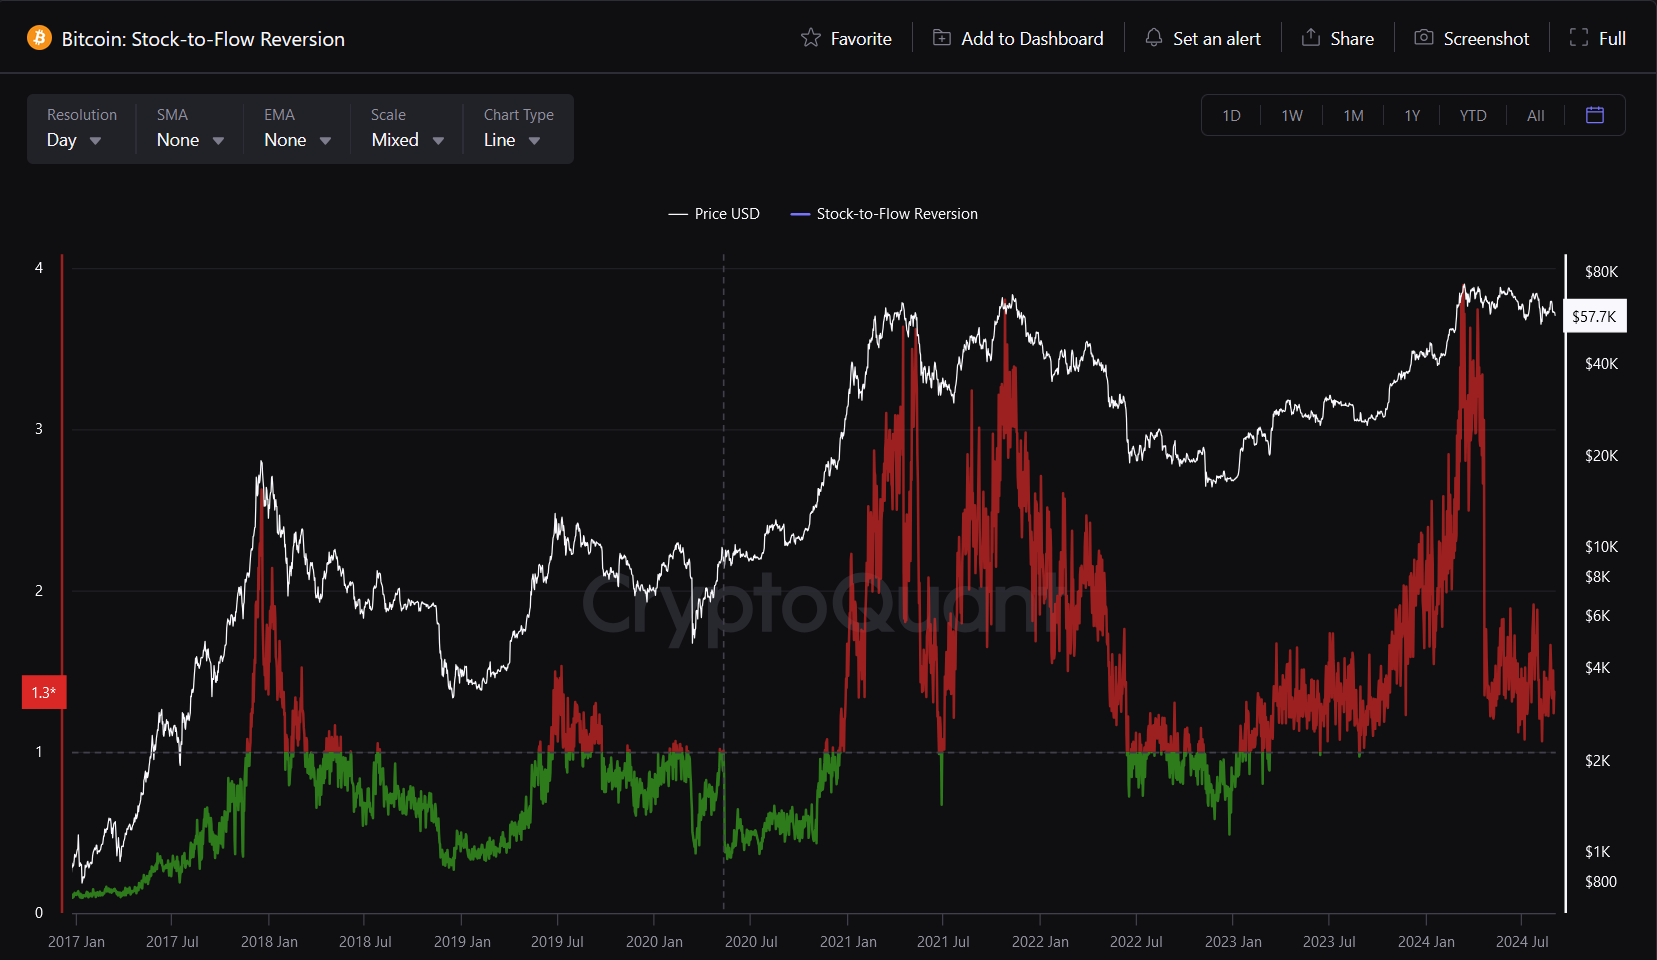
View original →S2F Ratio is an extremely valuable indicator for spotting best buy and sell opportunities. If you read my previous posts, you know I was able to predict low range for previous cycle's Bear market as well as showing you how to calculate likely price top. With this I was also able to estimate current halving cycle Bitcoin's price range between 150-200k (closer estimation will be possible most likely next year).
Even without deeper analysis, anyone using the S2F reversion chart can spot best times to Take Profit and when to Buy Bitcoin.
General rule of thumb is to buy when it turns "green" (values under 1 and you can set an alert in CQ to monitor this for you). BTC is edging closer to that area again (post halving the S2F ratio went higher than last cycle, so most of the time anything under 45-48k will likely flag as green/buy signal as opposed to previous cycle where that threshold was much lower).
You should always take moderate profit when S2F Reversion shows above 2.5 and take even more when it is 3+.
This combined with other on-chain metrics is a very powerful tool for long term investors who want to maximize their gains that previously made mistakes of missing out on taking profits near tops of the bull phase/market.
In next article I will look a bit more into S2F ratio post halving and what this can tell us about top and bottom ranges for the remainder of the cycle.

View original →

