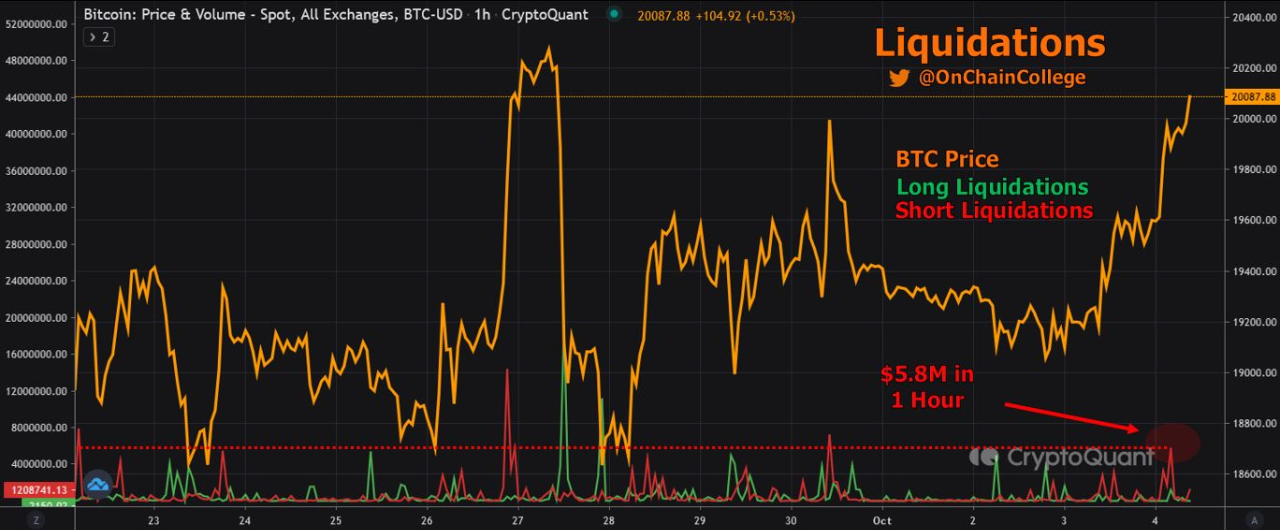
There was $5.8 million in bitcoin short liquidations in 1 hour on the move up in price recently. This is the 3rd highest level in about one and a half to two weeks. That said, liquidation levels have been relatively small lately excluding the big liquidation round trip on Sept 26th/27th, where there was over $14 million in short liquidations in one hour followed by over $19 million in long liquidations in one hour.
Open Interest has been rising since the June '22 bottom. The price has been ranging too much lately for these large liquidations to occur.
This is something to keep an eye on. With OI building up, there is potential for a liquidation cascade (on either shorts or longs) if price deviates far enough from this range.

View original →Bearish(Nuanced)BTC
5/11/2022 I'm assuming most of you are well aware of the Luna/UST situation so I won't go through a full recap.
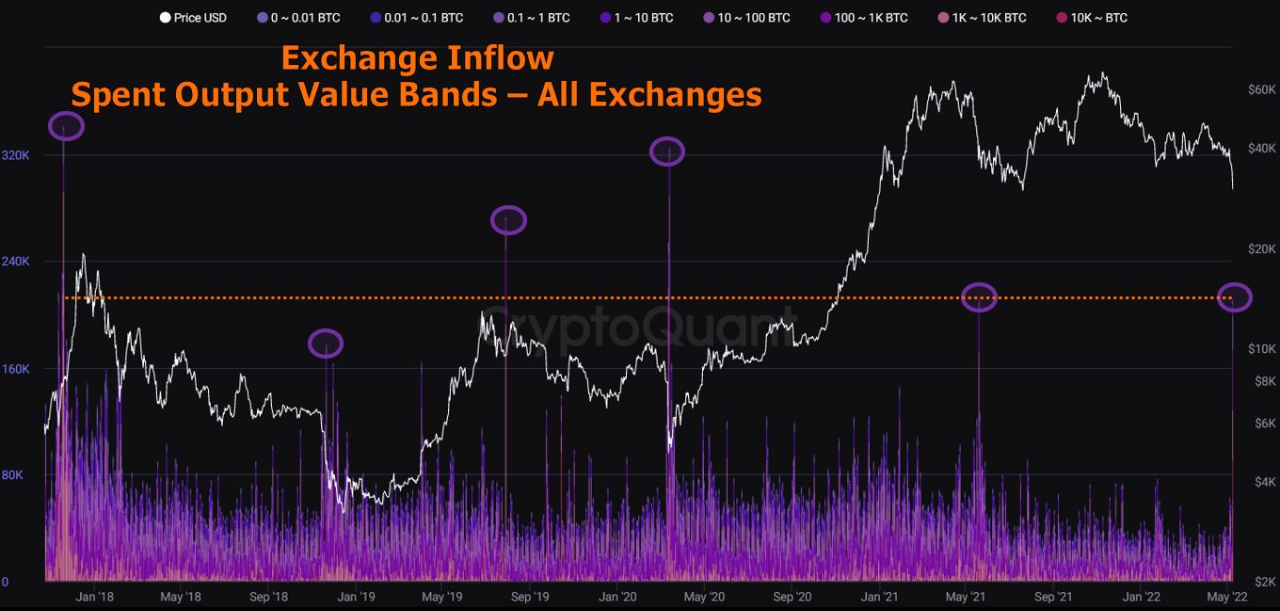
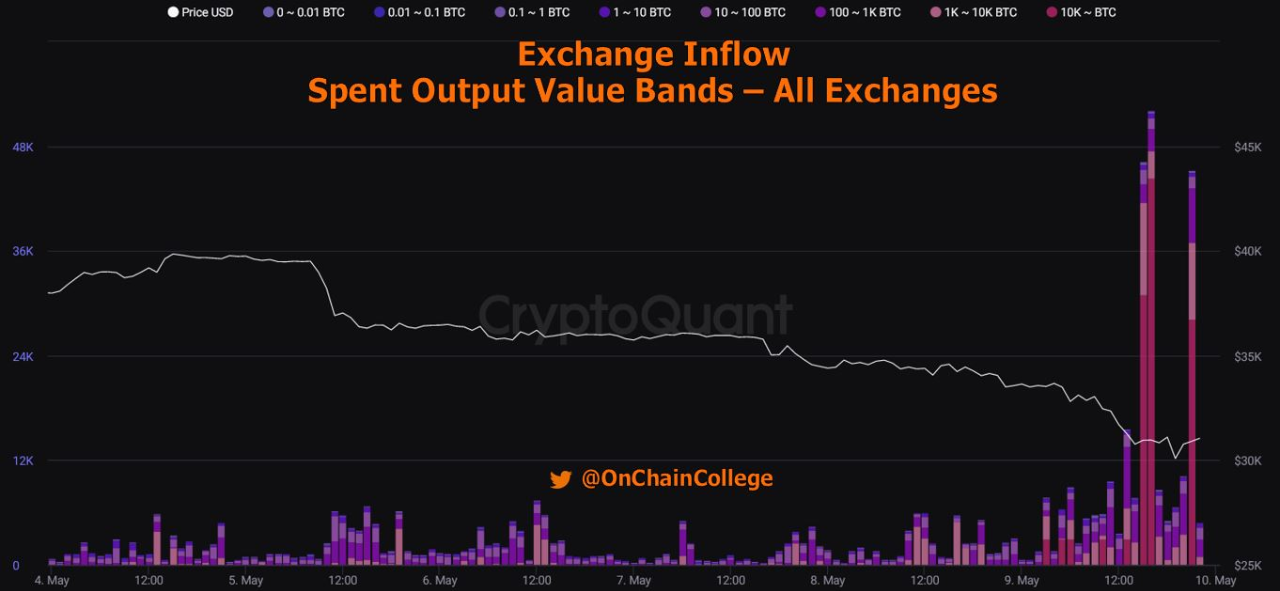
Looking at Exchange Inflow Spent Output Value Bands, we witnessed one of the largest inflows in BTC's history (picture 1) on May 9th. Large exchange inflows can lead to sell pressure if the BTC was sent to the exchange with the intent to sell.
Whales (picture 2) sent the majority of the coins to exchanges during the May 9th inflow. This metric is clearly affected by LFG but still important to monitor.
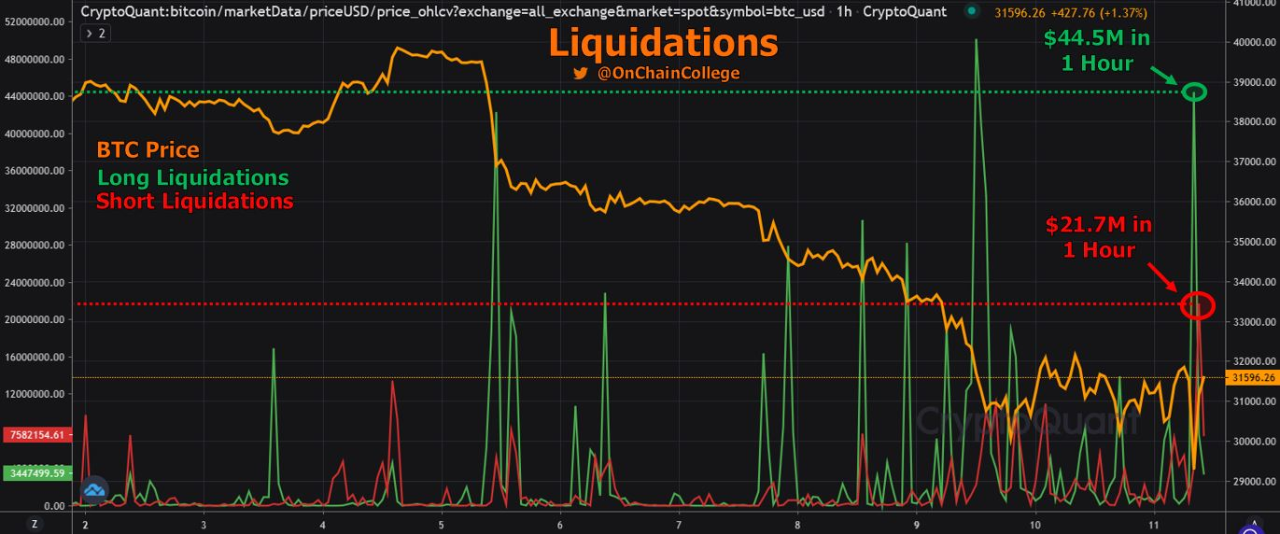
With all of the uncertainty in the market, speculators have continued to use leverage which has added fuel to the fire. On May 9th (picture 3), there was over $50 million in BTC long liquidations in 1 hour and over $91 million in a 2 hour period. With the CPI print of 8.3% YoY today, the drop in price was accelerated by $44 million in long liquidations in 1 hour.
Realized Price is now at $24,100. Do you think BTC will reach this or does it bounce before?

View original →What a day for Bitcoin.
At the time of writing this, the Bitcoin price is up 15% on the day and is currently hovering around $43.5k.
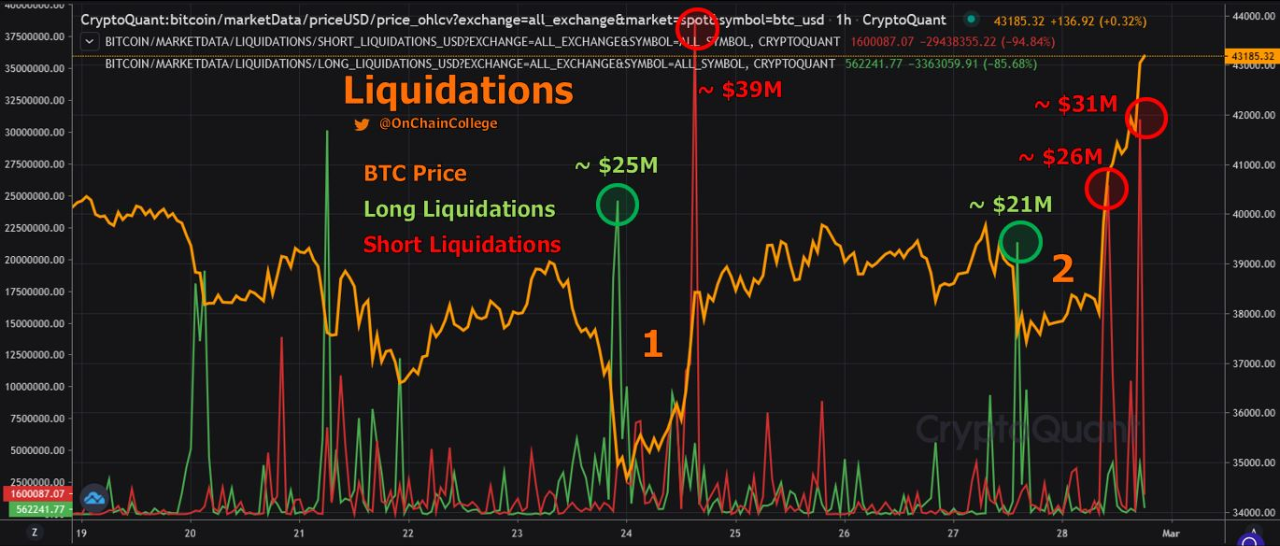
Leverage adds volatility to the market. As price started to drop on Feb 23rd, the move down was accelerated by $25 million in long liquidations. This is seen in the first picture by the orange #1. Price quickly made a U shaped move, and shorts that piled in were caught offsides, resulting in $39m in short liquidations in 1 hour.
We saw a similar U shaped move (2) yesterday and today, with an hourly peak of $21M in long liquidations quickly turning into an hourly of $26M in short liquidations. But price kept rising today, and another $31M in shorts were liquidated in an hour merely 7 hours later.
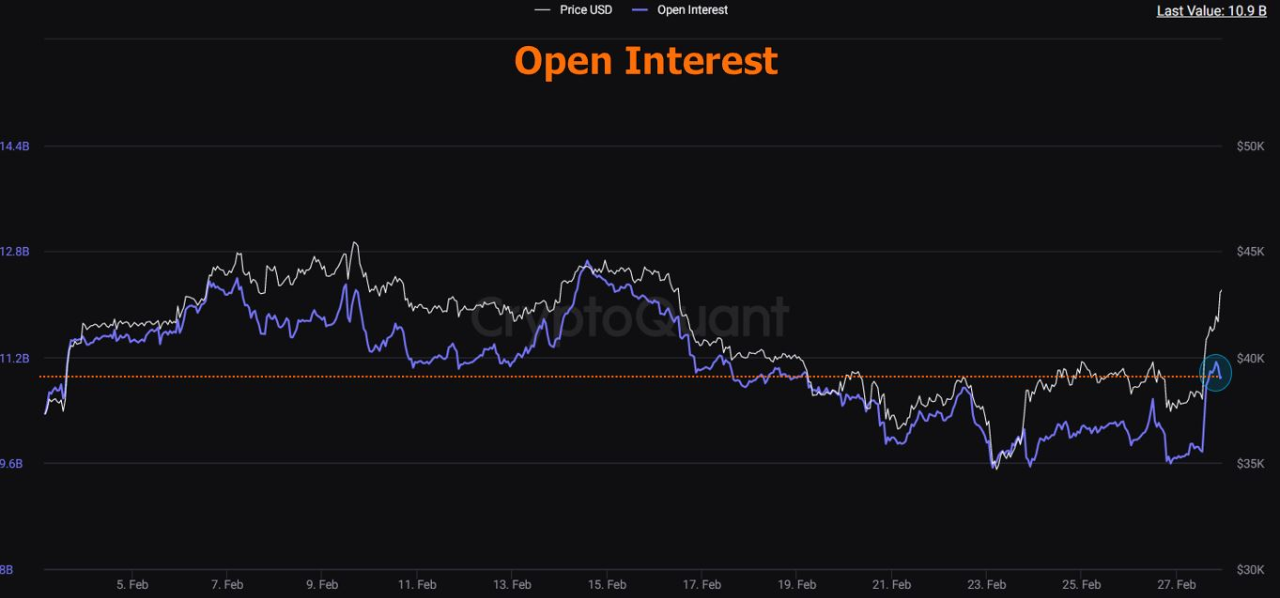
Additionally, Bitcoin Open Interest has risen to levels last seen a little over a week ago.
What does this mean? My interpretation is that the liquidations this week did not clear out a lot of leverage, and there could be more volatility in the short term.

View original →Bitcoin spiked up over 5% in 1 hour and is currently at $40.5k at the time of writing. That is up $3,200 (8.5%) on the day.
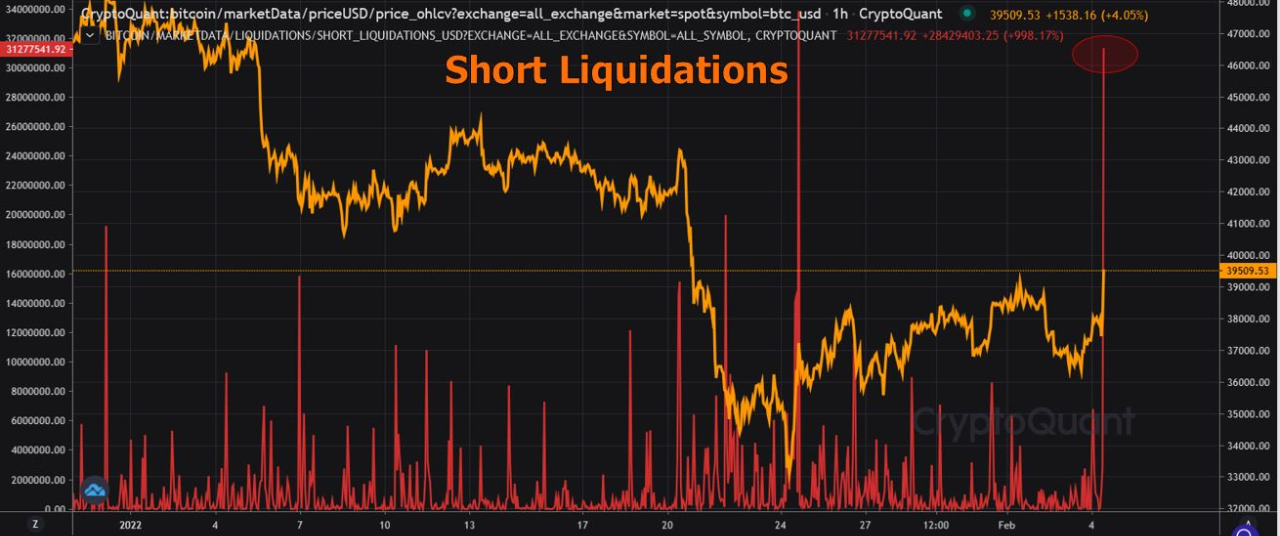
We saw a pretty heavy spike in short liquidations, almost $60 million within a 2 hour period. The $31M+ we saw within one hour was the third largest hourly spike in the last two months.
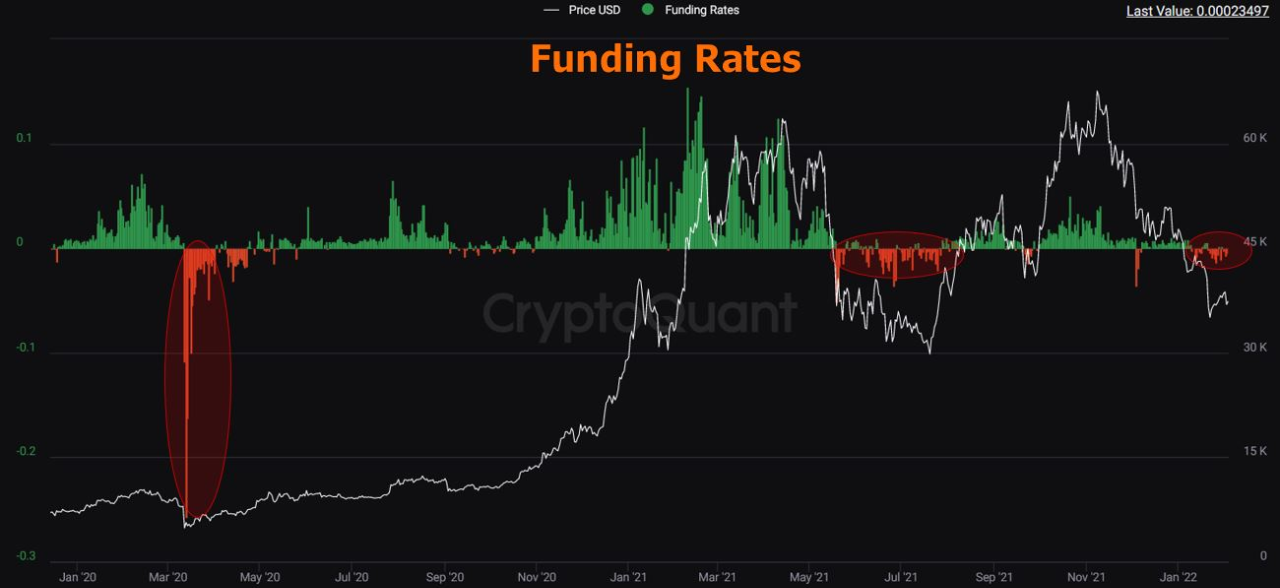
Funding rate has been negative for a couple of weeks. Bearish sentiment was easily seen throughout social platforms.
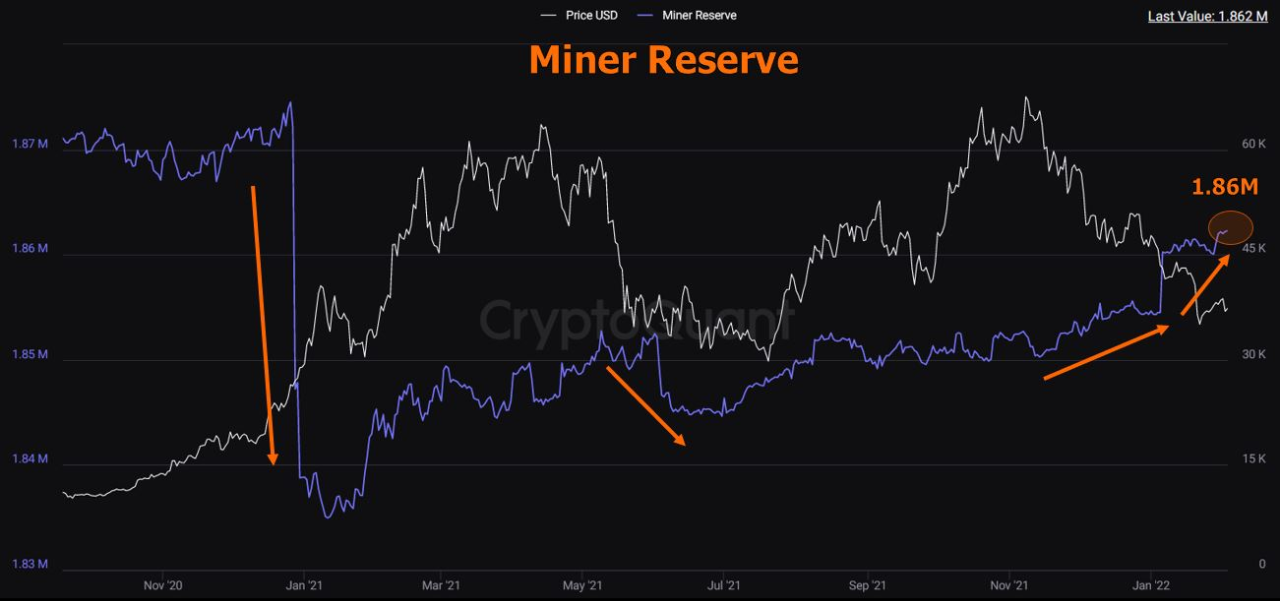
From a macro perspective, it's encouraging to see miner reserves increase. Miner reserves dropped drastically during the price discovery phase of early '21, but they've been accumulating on this prolonged drop.
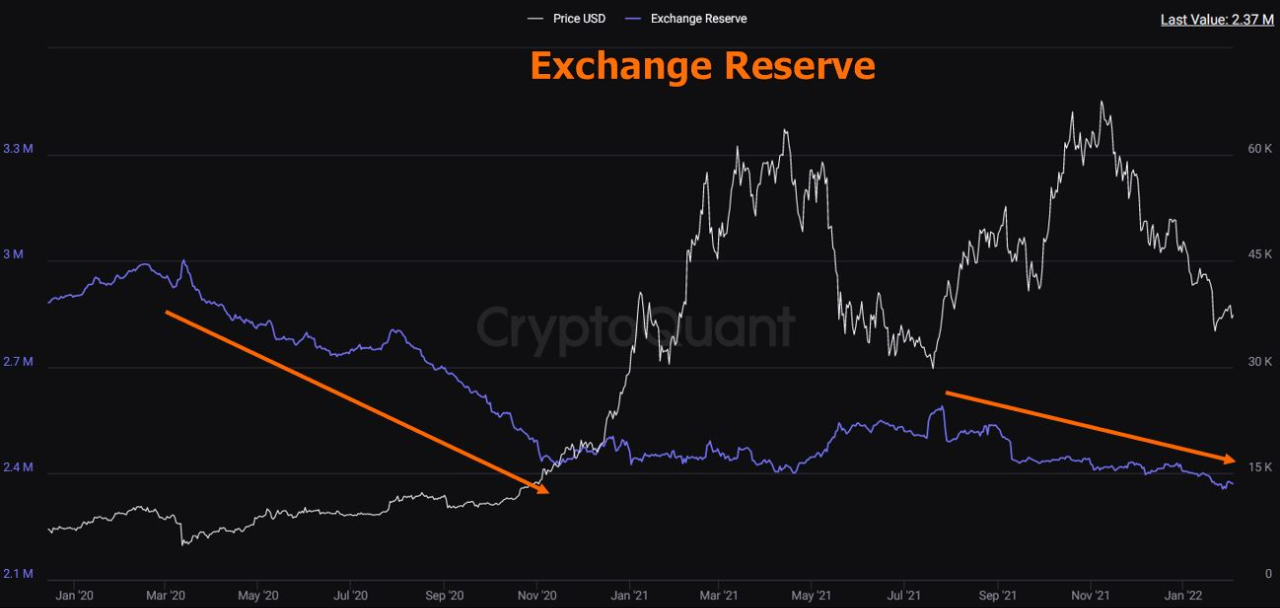
Exchange reserve levels continue to decrease from a macro view.
Overall, no way to know how this plays out but on-chain supply dynamics have been strong so let's see if we get continued, consistent demand...

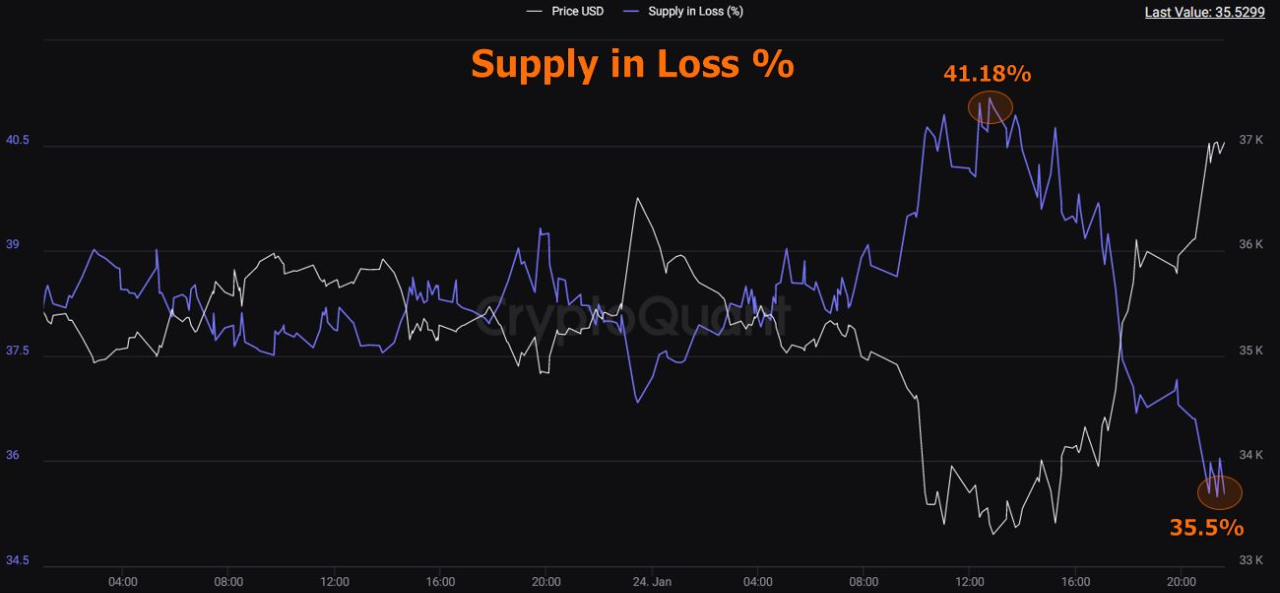
View original →Looking at the block level, we saw Bitcoin's Supply in Loss % hit 41.18% today. Currently, 35.5% of the supply is in loss after Bitcoin rallied from the day's low around $33k up to around $37k.
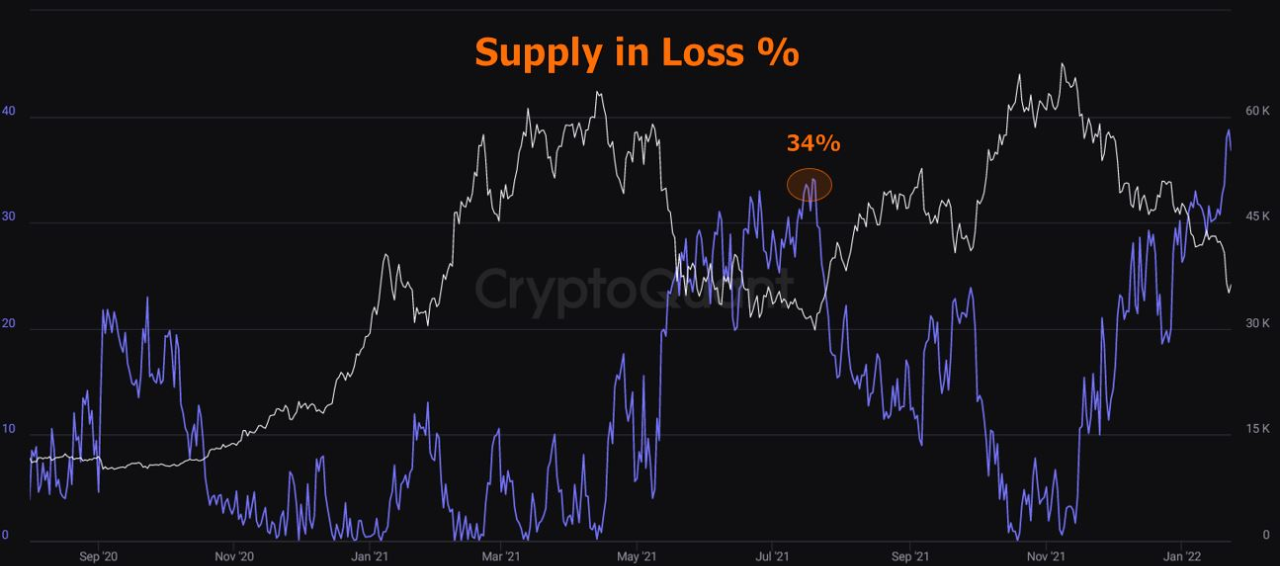
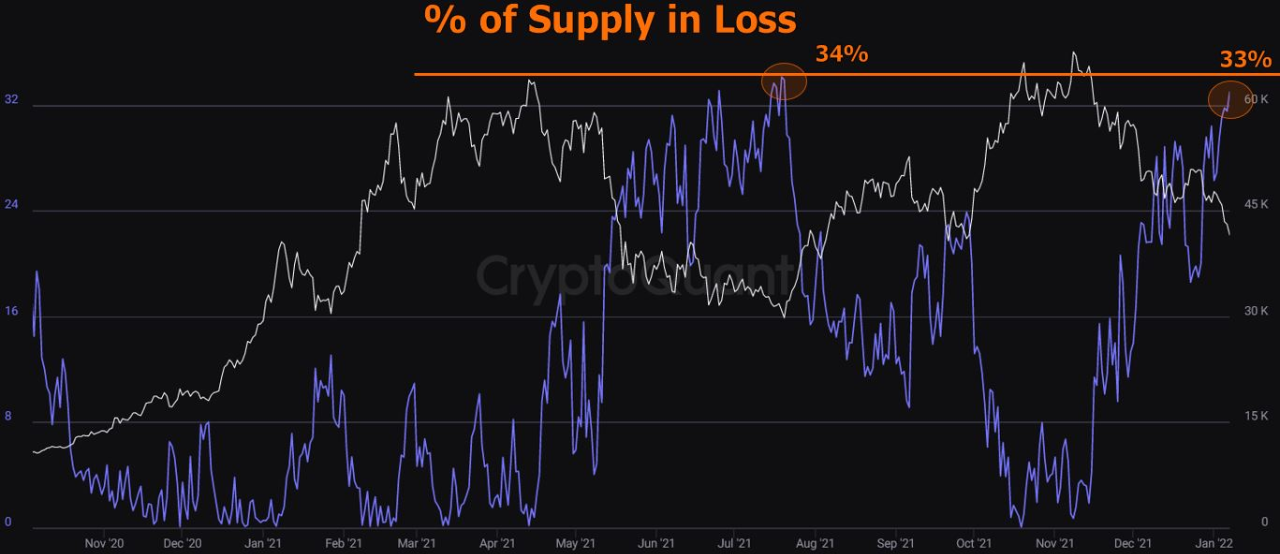
If we look at the Summer '21 supply in loss peak, we see that supply in loss % reached 34% at the highest level.
During deep bear market bottoms, this metric has historically crossed above 50%.
Hard to use this metric to make predictions but it is interesting to see the peak of this drop higher than the Summer '21 drop.
Do you think we've bottomed here or do you think Bitcoin will drop further?

View original →The percent of Bitcoin supply in loss is around 33%, which is approaching the July '21 high of 34%.
Your opinion on whether this is bullish or bearish reflects your bias on the direction of the market, imo.
If you think the market is bullish, you may think we're approaching a bottom before a price reversal.
If you think the market is bearish, this is just the beginning of a downtrend. Historically, we have seen the % of supply in loss cross above 50% during bear market bottoms.
If I had to guess, I would say it's possible for us go higher than the 34% based on the derivative data and then see a reversal. Who knows what will happen in the short term, though.
Do you think this is bullish or bearish?

View original →Bearish(Nuanced)BTC
12/24/2021 Let's keep it simple and look at macro supply & demand on exchanges for both Bitcoin and Stablecoins.
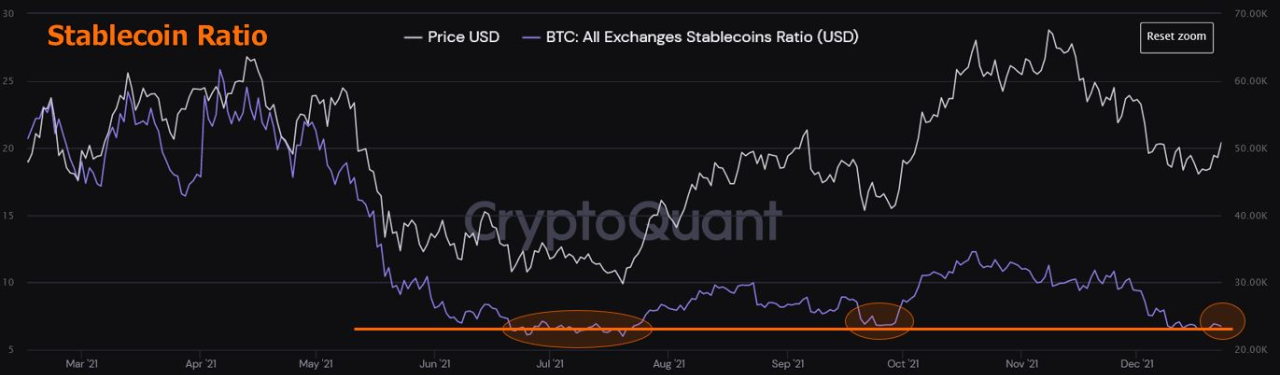
The BTC: All Exchanges Stabelcoins Ratio (USD) divides the BTC reserve by the stablecoins reserve. Low levels could indicate buy pressure. We're currently at levels lower/comparable to the Sept. '21 price drop and throughout the Summer '21 price drop (pic 1).
Price was around $30k during Summer '21 & around $40k in Sept '21. We're now around $50k but at the same stablecoin ratio level.
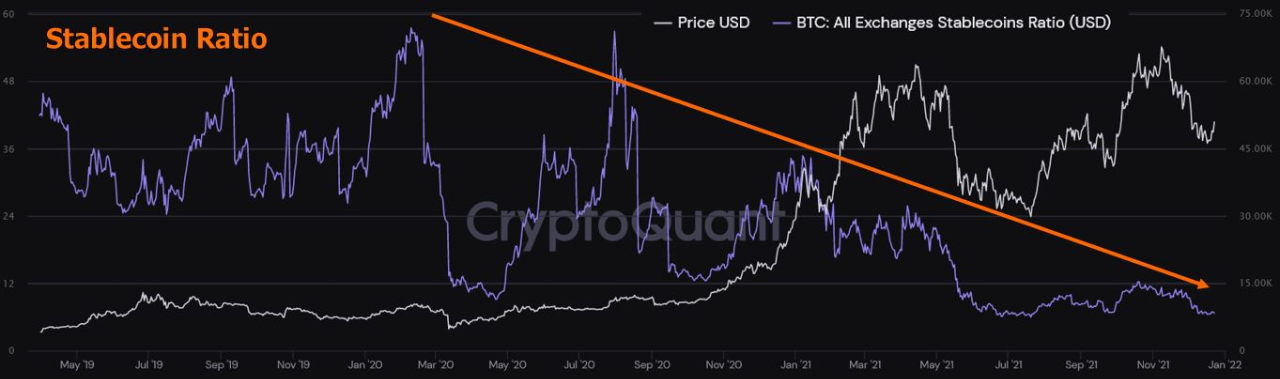
Zooming out (pic 2), we can see this ratio has been in a macro downtrend since the March '20 crash.
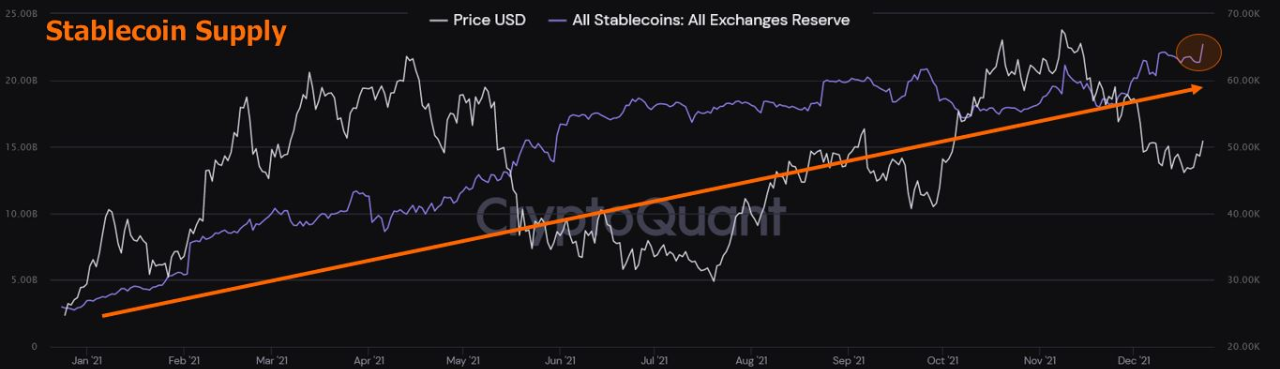
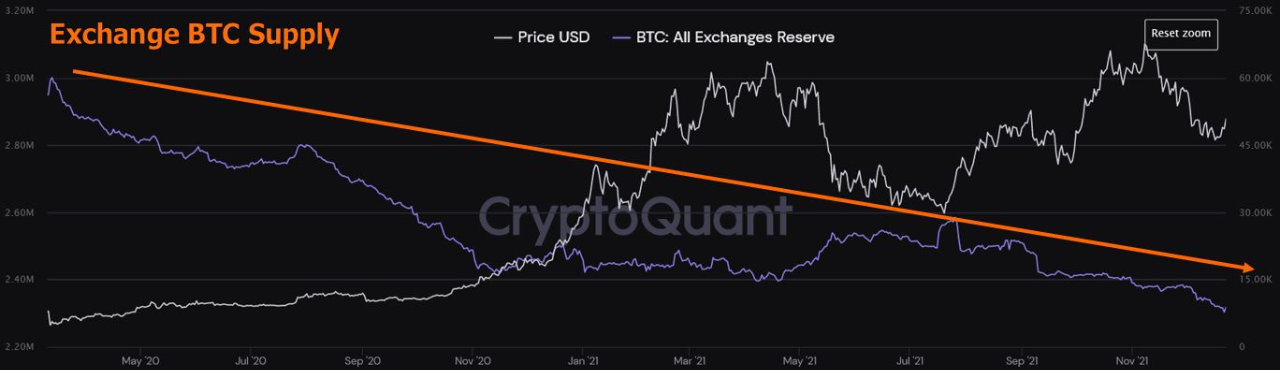
We can see (pic 3) that it is because the supply of stablecoins has been increasing, but we also know the exchange reserves of BTC have been decreasing (pic 4) since the March '20 crash.
Keeping it simple-
-BTC exchange supply macro down
-Stablecoin exchange supply macro up
-Stablecoin ratio at levels from price crashes earlier this year
Macro bullish in my opinion

View original →

