Bullish(Nuanced)BTC
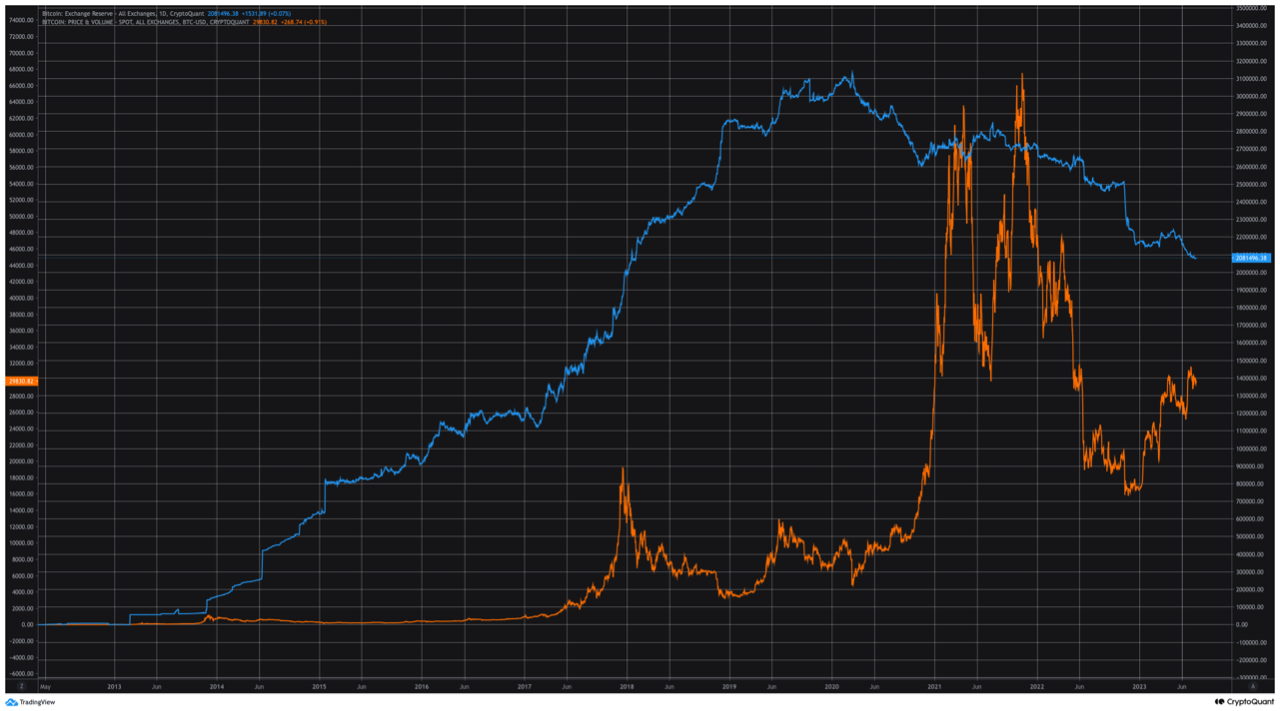
7/21/2023 Bitcoin exchange balances are down to levels last seen around Jan/Feb 2018.
Exchange balances declined by about 32% from its peak in Mar 2020, down from 3.1 mio to 2.1 mio $BTC.
11% of the circulating supply is currently on exchanges (on Mar 13, 2020, 17%).
The unprecedented trend of declining Bitcoin exchange balances continues.
Some of it may be related to the usage of alternatives such as DEXs and funds not covered in the data, but overall there appears to be a common trend of people taking their bitcoin off of exchanges.

View original →Both Bitcoin exchange in- and outflows have been in a macro downward trend since the bull run in 2017, considering the 365-day moving average.
It picked up during the last bull run but was not as strong as in 2017.
Overall an unusual trend as before 2017 the trend has been upward.
Reasons may be:
-decline in activity due to bear market (but does not explain overall trend)
-diminishing use of bitcoin for speculative purposes due to:
a) increasing availability of other trading pairs, such as stablecoins and
b) a change in the composition of bitcoin users, with fewer users using bitcoin for speculative purposes and short-term trading.
Both overall, leading to fewer deposits to and withdrawals from exchanges.


View original →Bullish(Nuanced)BTC
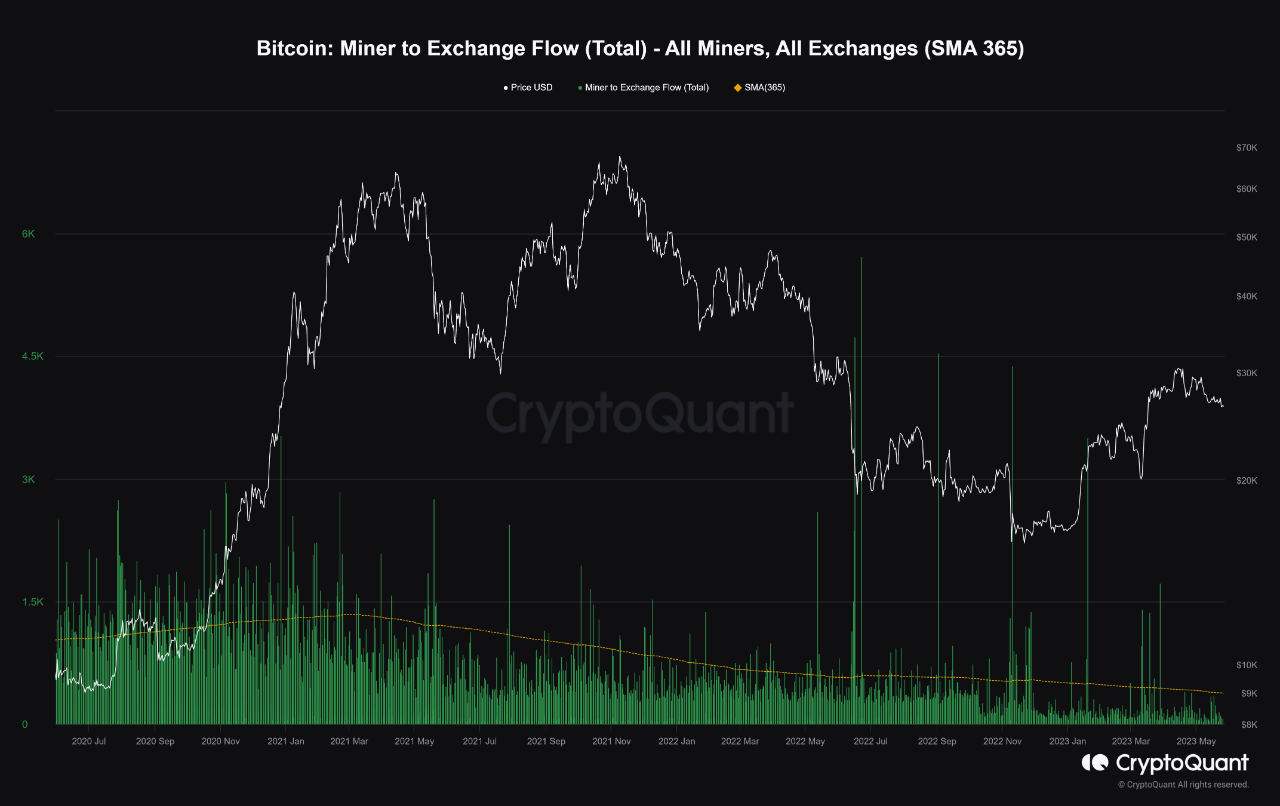
5/25/2023 The amount of bitcoin send to exchanges by miners is in a clear downward trend when looking at the 365-day moving average and the 7-day moving average. Both are trending lower since the last bull run.
Part of that may be miners increasingly conducting over-the-counter deals instead of selling on exchanges. In that case, the selling pressure has just shifted elsewhere.
Another factor is the professionalization of the mining space, with more and more companies that are potentially well-capitalized and have less pressure to sell their mined bitcoin to cover their operating costs at the moment.
For example, Marathon increased its bitcoin holdings by 20% from 9,673 BTC in March 2022 to 11,568 BTC in March 2023. Still, they sold 600 BTC in April to support monthly operations etc.
The professionalization may have also led to a shift from exchanges towards over-the-counter deals not showing up in the data.
But on average, it seems reasonable to assume that part of that decline in the data is due to reduced selling pressures by bitcoin miners.

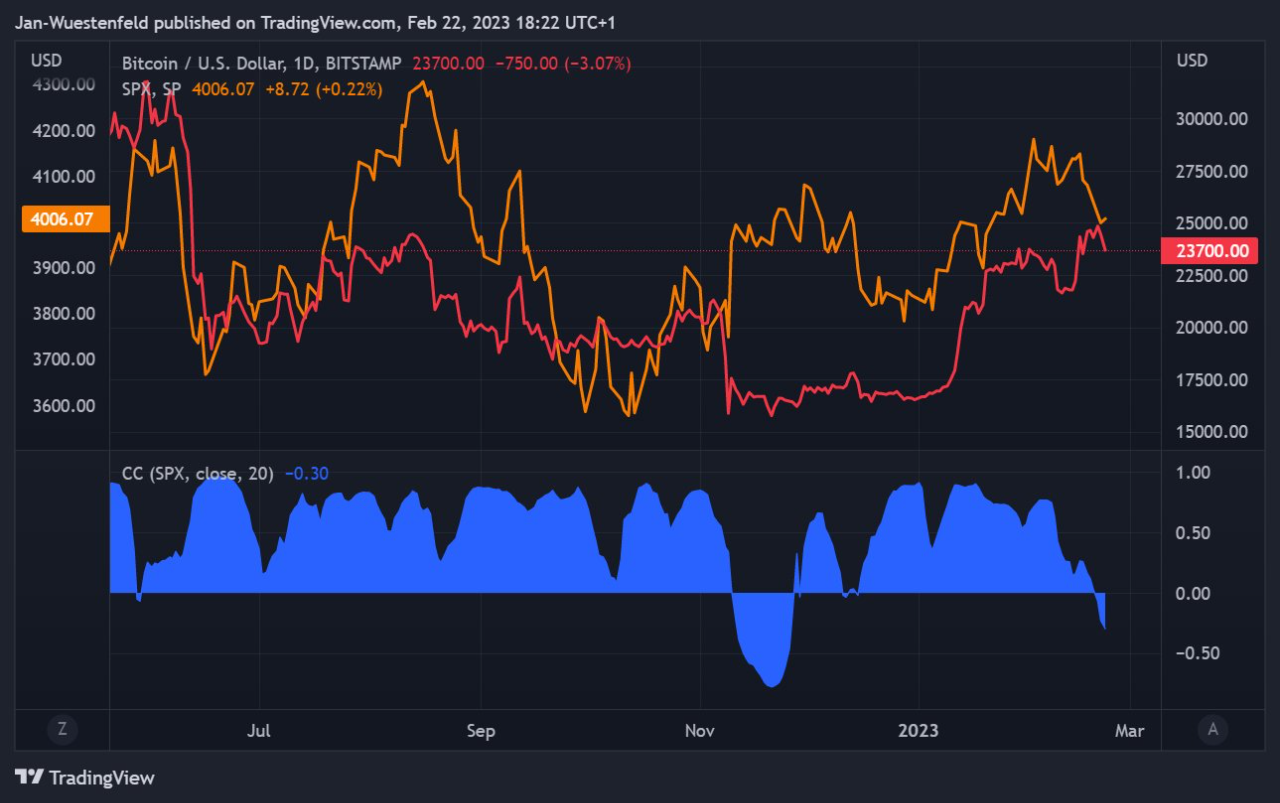
View original →Bitcoin is showing a negative correlation to the S&P 500. It has been some time since we have seen that.
The last time it was significantly negative was around the FTX crash in November.
Then it was mostly bitcoin pulling away to the downside; recently, it has been more to the upside.
But today, Bitcoin is down while the S&P 500 is slightly up. It will be interesting to see how long the negative correlation lasts and whether it will predominantly be to the upside or not.
Note: The time period used to calculate the correlation is 20 days.

View original →Bearish(Nuanced)12/8/2022
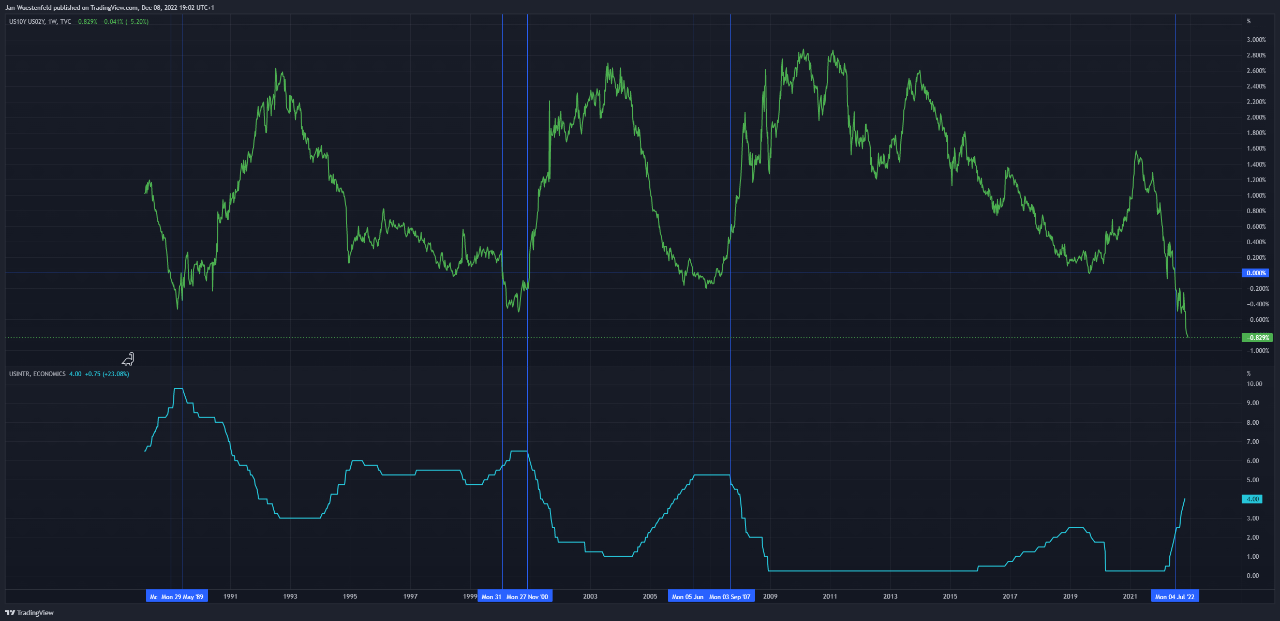
Once the US yield curve inverts, it takes the FED some time to cave.
In the latest history, that reaction window lengthened by quite a bit:
Inversion to interest rate top:
02. Jan 89: 21 weeks + rate hikes
31. Jan 00: 43 weeks + rate hikes
05. Jun 06: 72 weeks + rate hike
We are currently 22 weeks into the yield inversion and have yet to see the Fed showing signs that they intend to pivot. Considering that year-over-year inflation in the US is still at 7.7%, that likely is still some time away.
If history is a guide, the Fed will hike a few more times and then keep the interest rate at that higher level for a prolonged time before lowering it again.
Just going by the graph, that time window has lengthened as well.
Note: In 2006, it is hard to pinpoint the exact time of the yield curve inversion as it hovered below but close to zero for some time and even went slightly above zero at times.
So rather use the weeks to get an idea of the duration and don't take them too literal.

View original →Since this cycle, monetary policy has become relevant for Bitcoin.
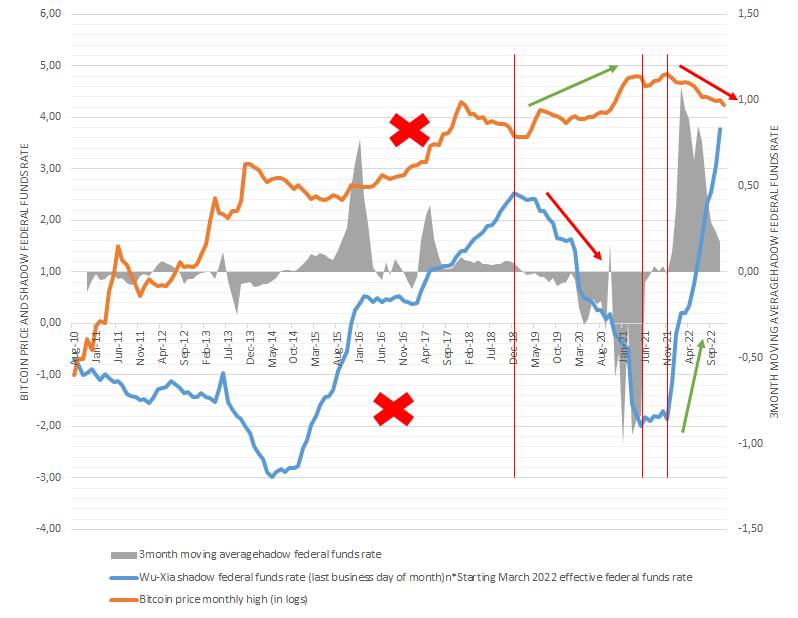
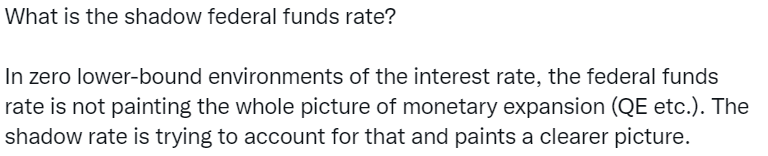
The peak of the shadow federal funds rate in Dec 18 has more or less marked the bottom of the bear market.
Similarly, with it moving up sharply in Dec 21, bitcoin's bear market started.
Why were monetary conditions not as relevant before this cycle? Is it coincidental? It may well be, but I would argue this is not the case.
We have seen more widespread adoption of Bitcoin over the last years. Futures markets being introduced, institutional interest rising etc.
So naturally, Bitcoin has become more connected to the traditional financial markets and is not only driven by retail investing anymore.
With the latest price moves, media and even the ECB have declared Bitcoin dead AGAIN. 🤨
Is Bitcoin dead?
Ask yourself this. Given that monetary cond. appear to matter, do you believe the effective federal funds rate will continue to rise indefinitely or that, ultimately, it has to come down? There you have your answer.

View original →Bullish(Nuanced)BTC
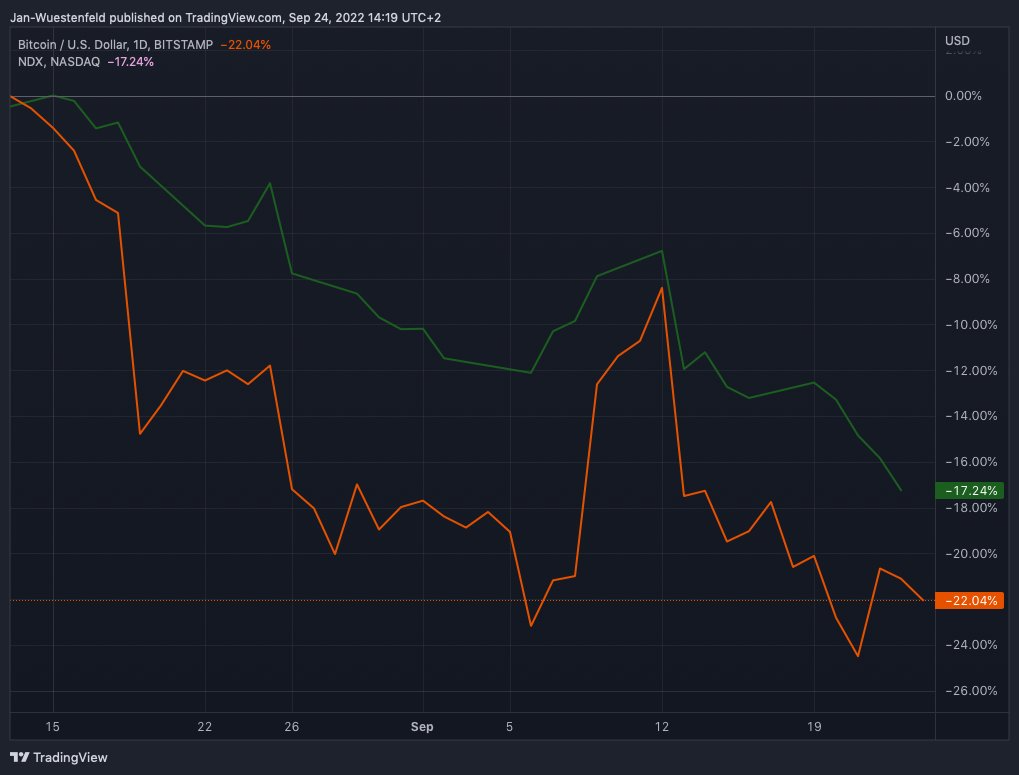
9/24/2022 Bitcoin's price has been holding up relatively well since the start of the present correction after Aug 13:
Bitcoin: -22%
Nasdaq-100: -17%
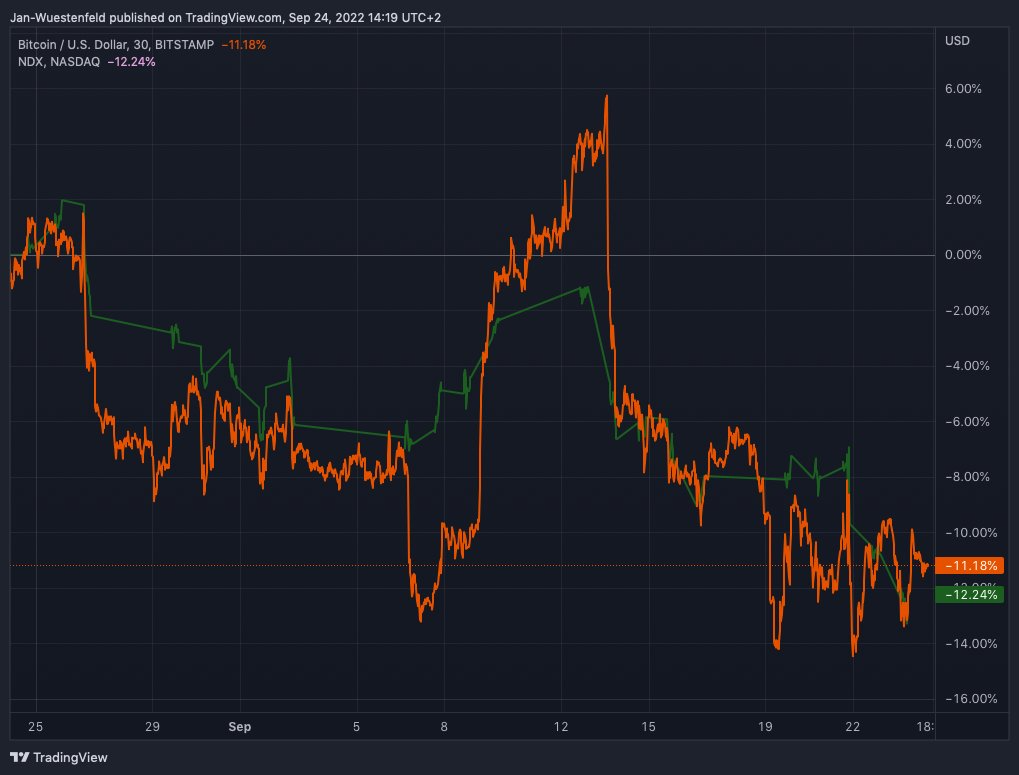
From one month ago, it looks even better:
Bitcoin: -11%
Nasdaq-100: -12%
It looked much worse at times this year when bitcoin's price dropped much faster than the Nasdaq-100.
This does, of course, not mean all is good, just that prices may be dropping less fast compared to the Nasdaq-100 than previously. Further, it is just a snapshot in time, and as we know things can change fast.
Markets are not in a good place currently, and if you were to ask me, it is more likely than not that the bitcoin bottom is not in yet.
So this post is more to give some perspective on what has been happening over the last weeks price-wise and that things could be worse.

View original →The 30-day moving average of the Bitcoin hashrate keeps trending higher and is not too far away from previous all-time high levels.
Note: I use the moving average here, as individual spikes in the hashrate are not necessarily actual increases in the hashrate. The hashrate can only be estimated and not observed. Spikes may, e.g. occur if blocks are discovered faster by chance.


View original →Bullish(Nuanced)BTC
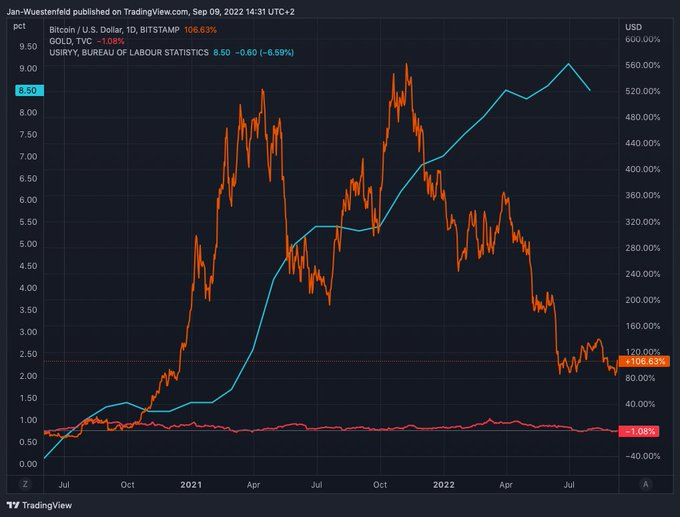
9/9/2022 Too many people confuse monetary and consumer price inflation and call Bitcoin a failure regarding it being a hedge against inflation. But is it?
Considering the 12-mont rate of change, the RoC for money supply M2 peaked in Feb. 21. and bitcoin's RoC peaked with a two-month lag.
To me, it seems like it is working as it should. The growth of the money supply is accelerating and bitcoin's price follows. Central banks step on the brakes and bitcoin follows.
It might well be that it is coincidental as we don't really see this relationship in the previous cycle, but generally, a broader interest in bitcoin this cycle and institutional money entering in particular and unprecedented monetary expansion have made that connection more relevant to my mind.
For these reasons I would expect to see this relationship to hold going forward.
The price performance of gold and bitcoin since June 2020 in the 2nd chart.
If you say bitcoin failed as an inflation hedge, what do you call gold then?


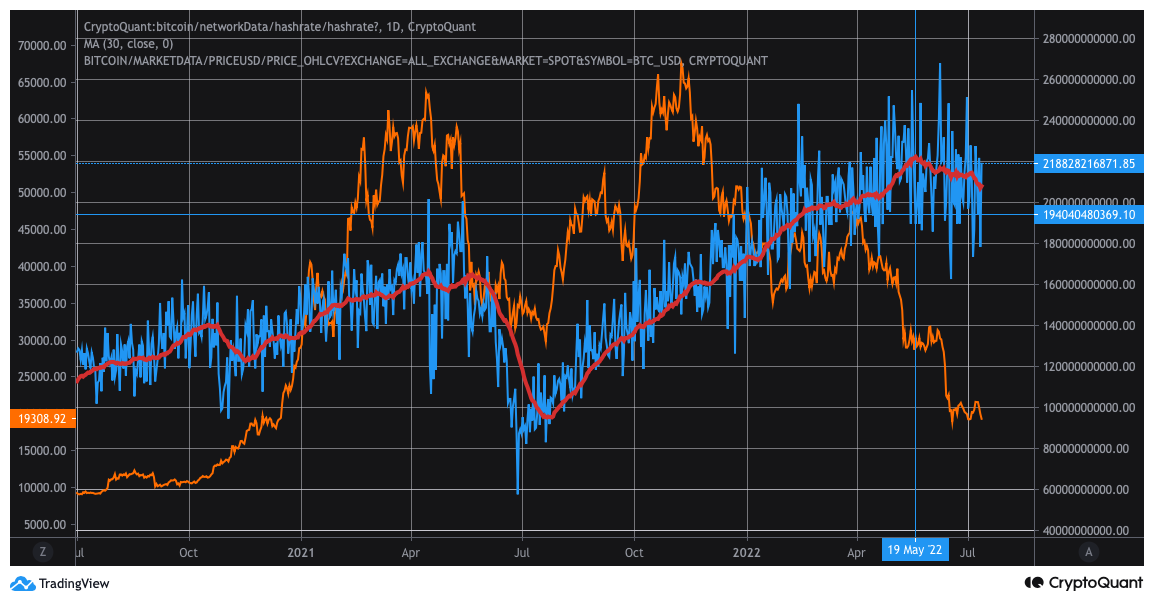
View original →The bitcoin hashrate has been in a slight downward trend since May 19 on the 7d moving average. Not surprising, considering that bitcoin's price is down roughly 70% from its all-time high, and some miners aren't profitable anymore.
Given the magnitude of the price correction, the hashrate still holds up pretty well.
This chart is also an excellent example of why individual data points should be ignored. Hashrate hit an all-time high during the downward trend. As hashrate is only an estimate, it can fluctuate heavily daily. Likely, blocks have just been discovered faster during that day by chance.

View original →

