Bullish(Nuanced)BTC
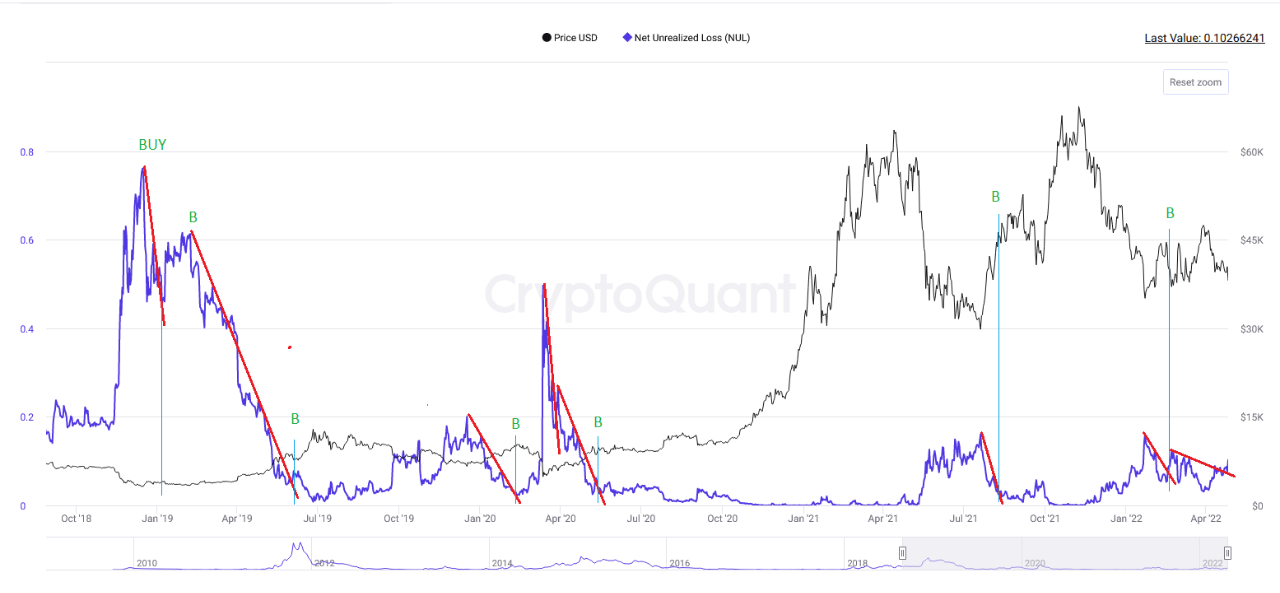
4/27/2022 In this chart I attach the NUL (Net Unrealized Loss) of all #BTC addresses. For now we can see that every time it has crossed lower we have had a rebound or upward movement. We should expect 4 things:
1) the crossing of the red line on the trend (BUY=B).
2) While crossing of red line we have a rise in price.
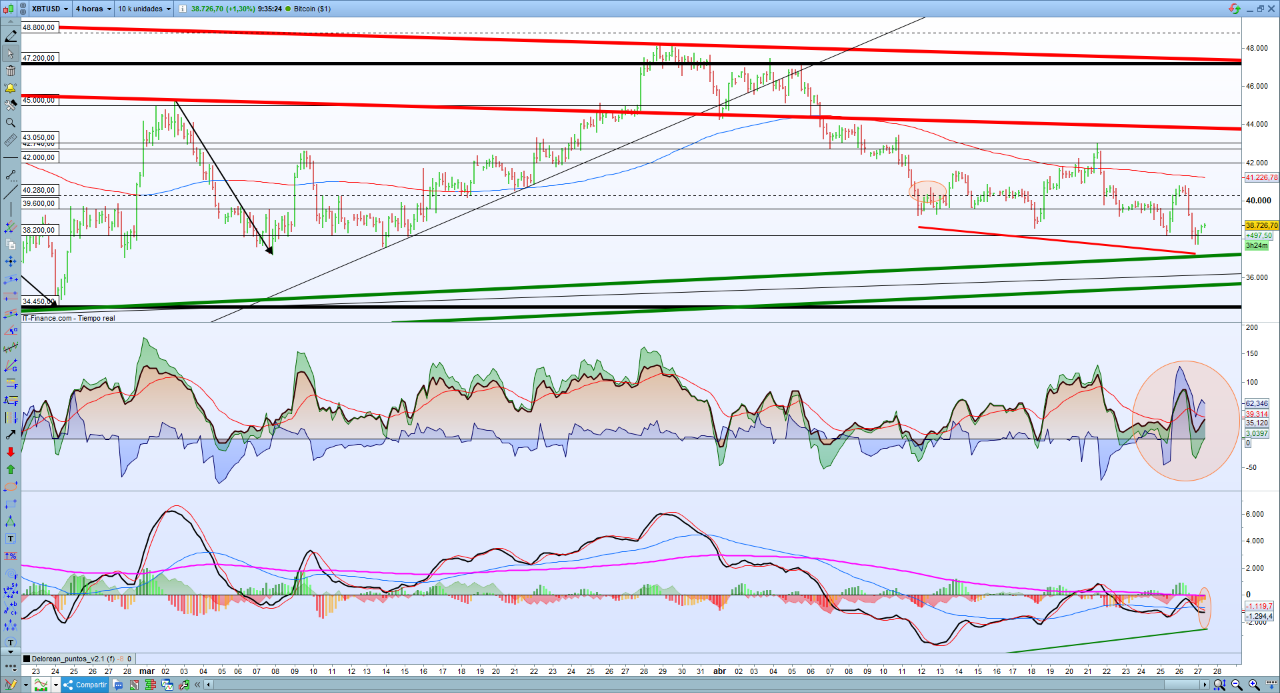
3) In reference to technical analysis, buying interest is observed in the area of 37-38k points due to strong hands (according to Konkorde in the average Bitcoin chart) but without reversal in strength or buying pressure according to Delorean (lower Bitcoin chart).
4) A big divergence in H4 move is ready, while price is going down (red diagonal line in price) we have a buying divergence in my indicator Delorean (low graph with green diagonal line). Soon we will have a bottom.
Have a nice week,
Marc

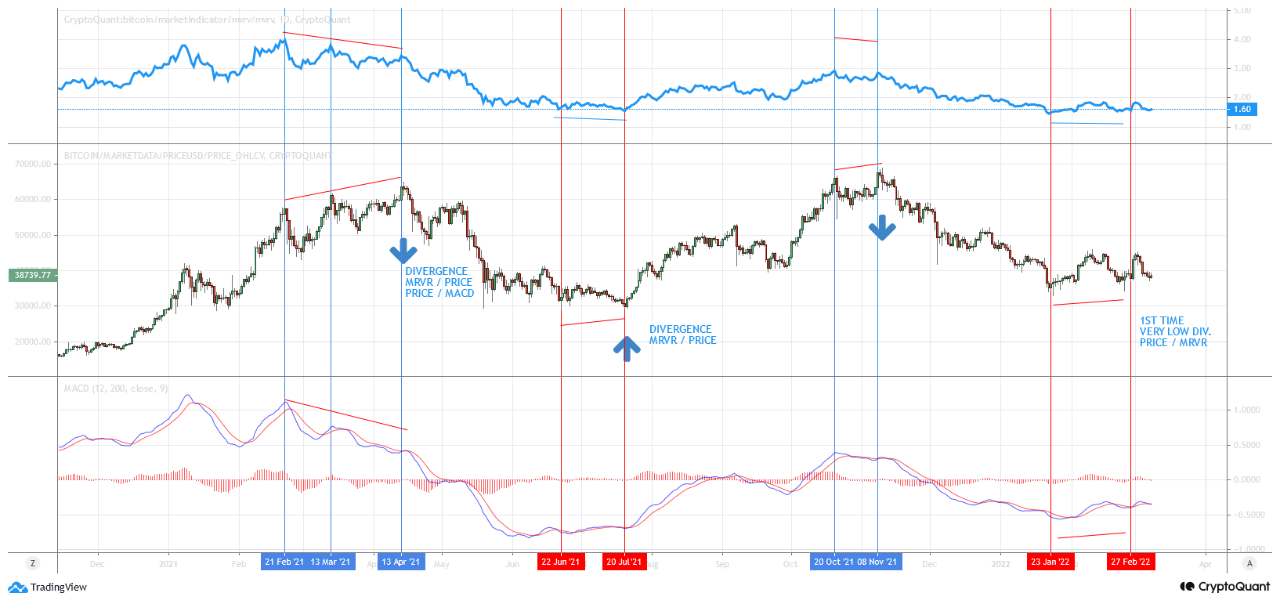
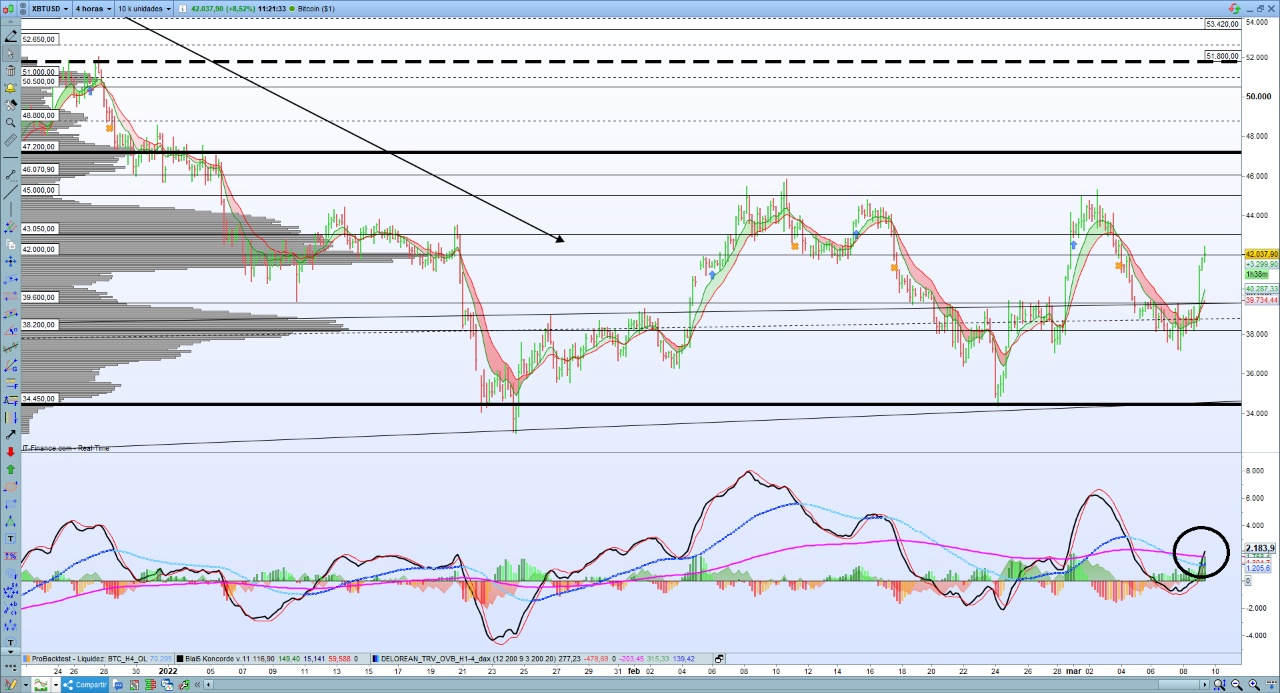
View original →Last 3 moves we had very big divergences as you can see in price graph, if we compare BTC between MRVR and MACD on MRVR (12/200/9).
This time we had low divergences between Price/MRVR. Will it be enough?
I attach 2 ways in bitcoin:
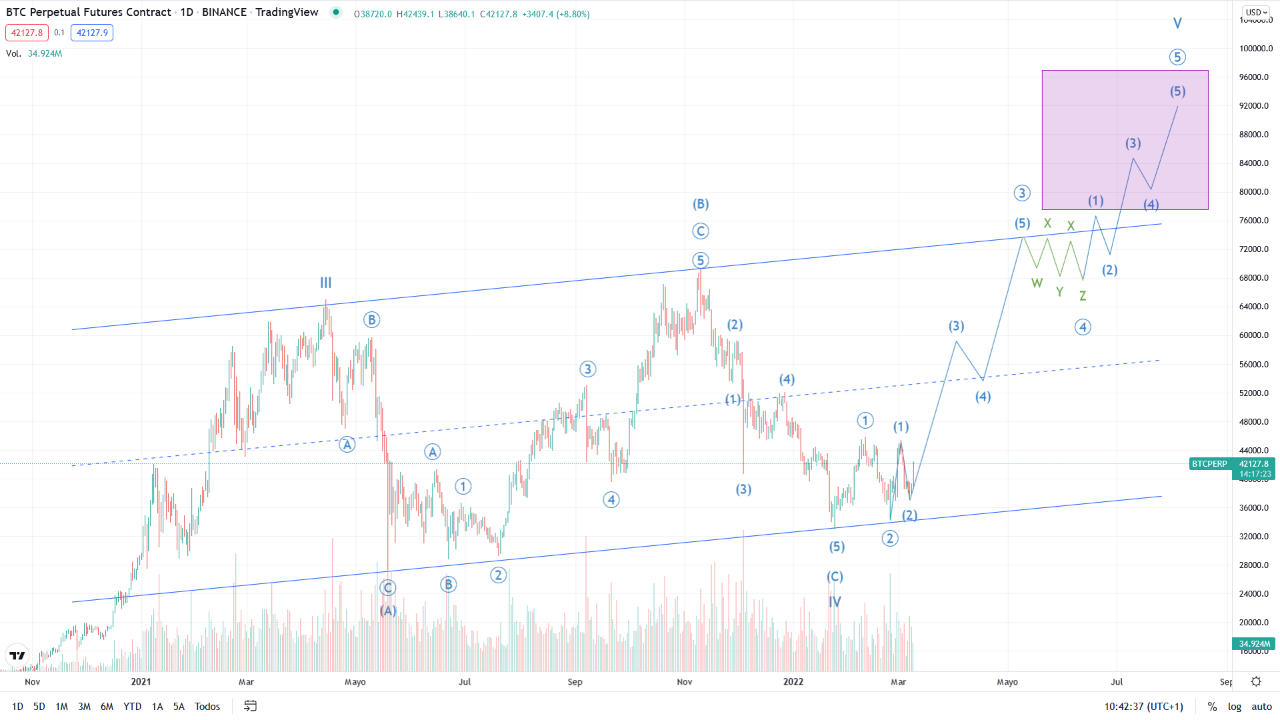
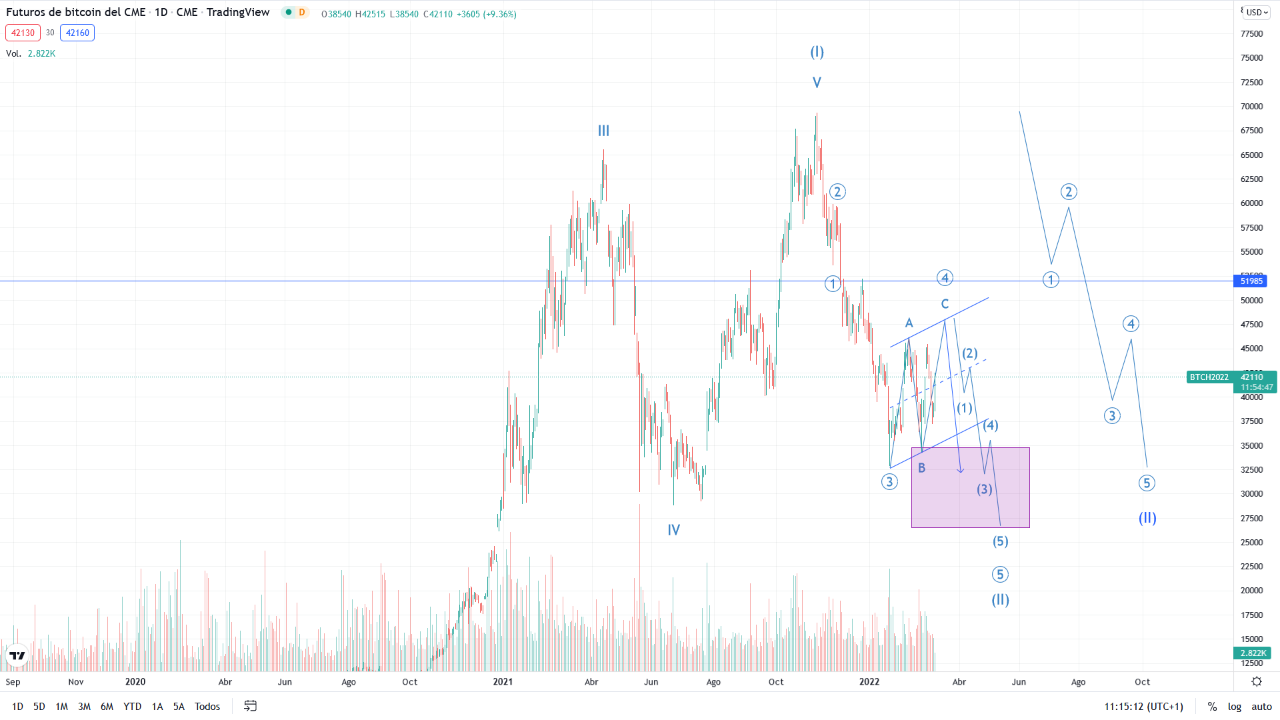
- Bullish: We have finished and abc to IV on "running flat" mode and now we are beginning wave 3-(5)-5-I.
- Bearish: We could have finished bearish move, but it will depend if we break 52k. In that case we will have a confirmation. Instead of this, If Wave 5-I has finished on 69k down move have to end between 34.740 (about 32k) to 50% on wave I to II. This movement could be ended. Or ... we could drop till 61,8% to 26.540 if it still need one more down wave.
- My own indicator are BULLISH as you can see in PRT graph, price (black line) is above 0, and above purple and blue line (slow and medium trend).
Let's Go BTC!

View original →Bullish(Nuanced)1/16/2022
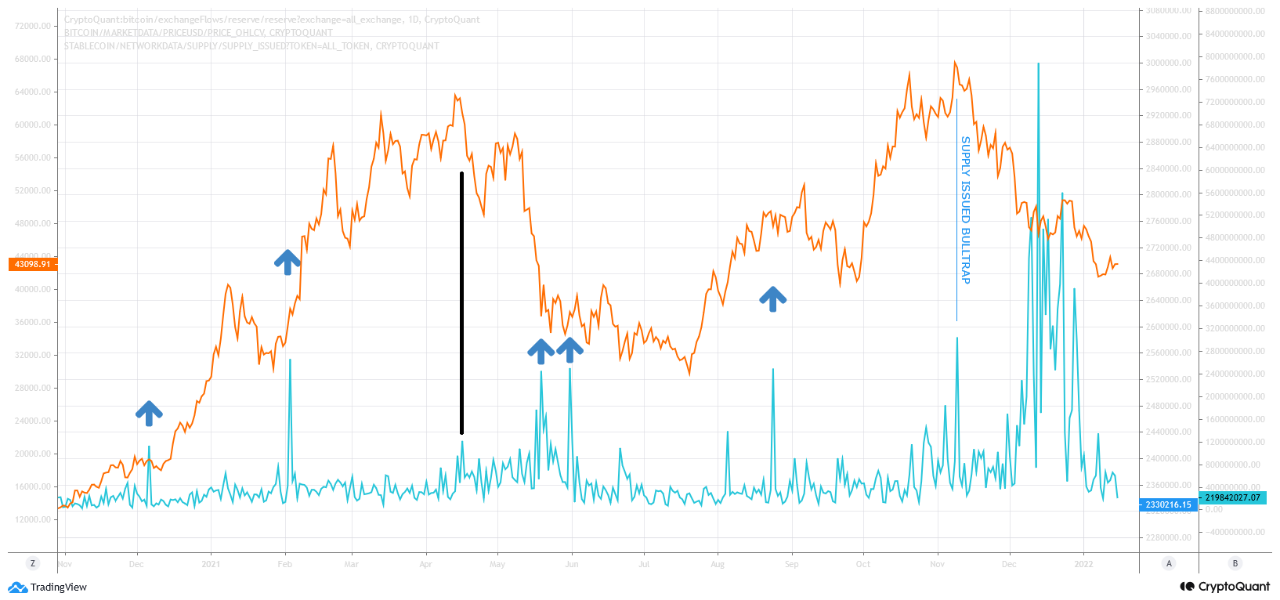
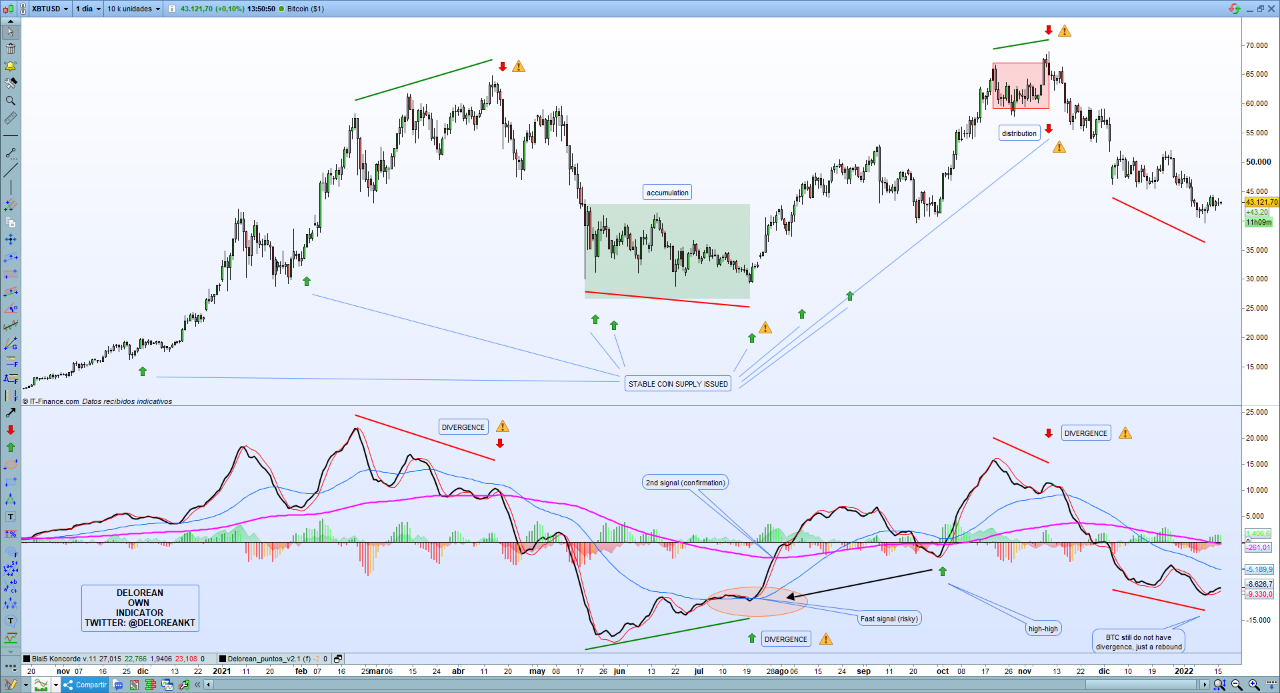
As an image give us more information than thousand of words, I will try to explain bullish divergences and bearish divergences with information about stablecoin supply issued mixed with my indicator created by me, called DELOREAN that it works with no delay in any frame time.
As you can see in last stable coins supply issued, we have had so many pumps! But we have two bearish movements:
- first one has been so many hard to detect (march - april 2021) with on chain information, but not if we use tech and quant information that I have with my delorean.
- Second one (nov'21) , was easy, we had two signals, bullish trap of supply issued on stable coin and my divergences.
By now we have no diveregences, so the downtrend could keep going down. Be smart with money and wait for signals.
Have a nice sunday!
Marc ( twitter: @deloreankt )

View original →We have two bad signals near the corner ...
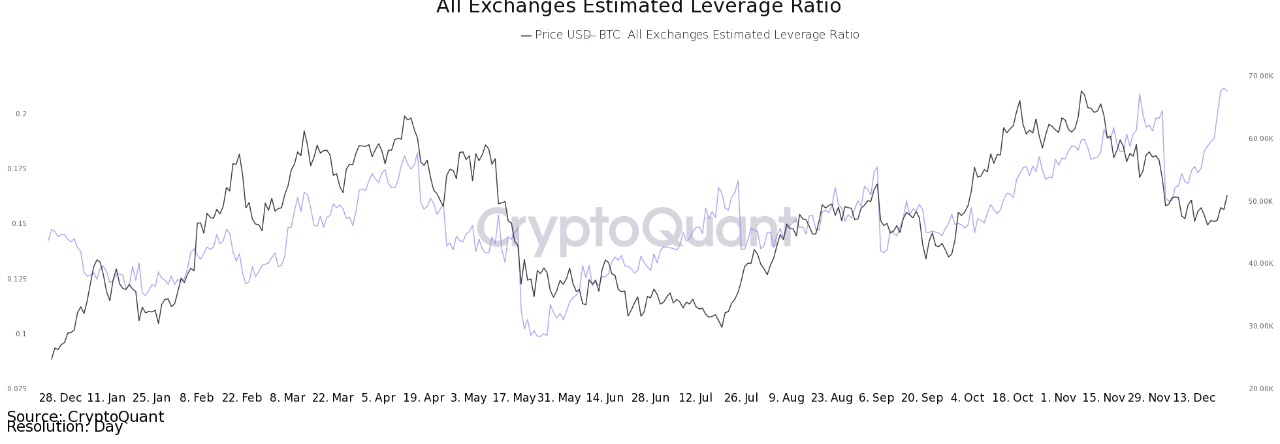
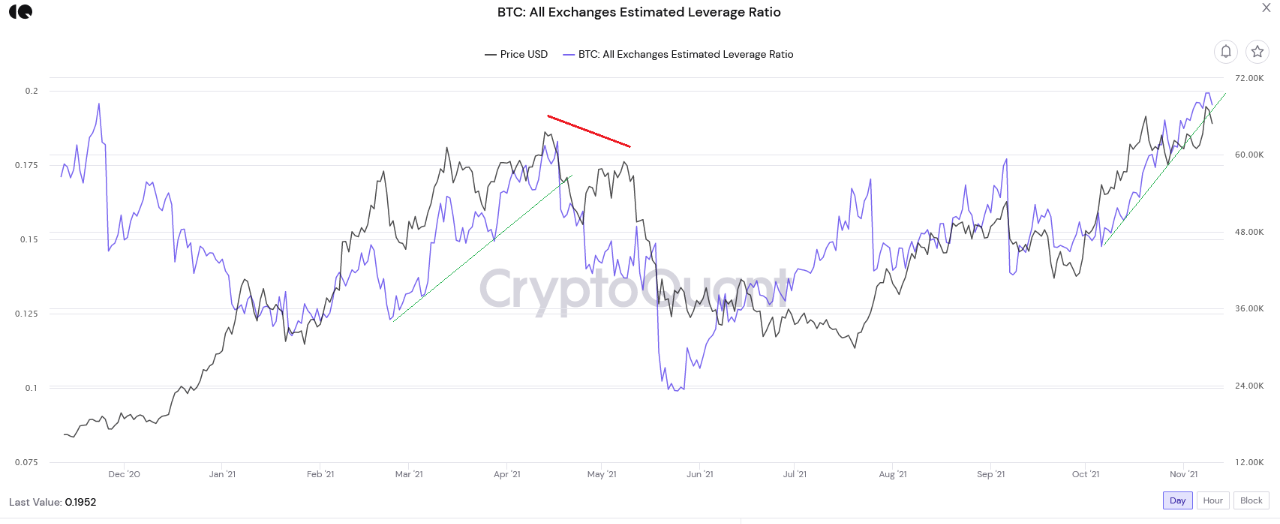
1st) Big leverage ratio. The biggest one in 2 years. So soon, we probably will have a drop, or long liquidation to clear retail investors in next days.
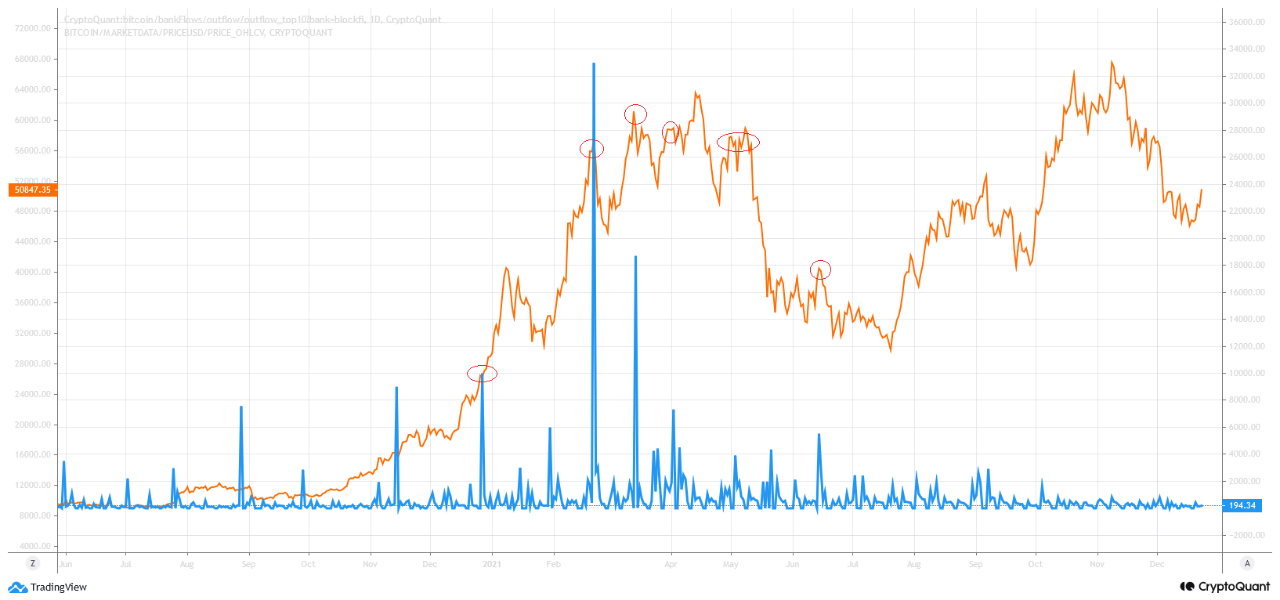
2nd) No big bank outflows since last drop on may'21. This is not normal and this is another bad signal along the 1st one.
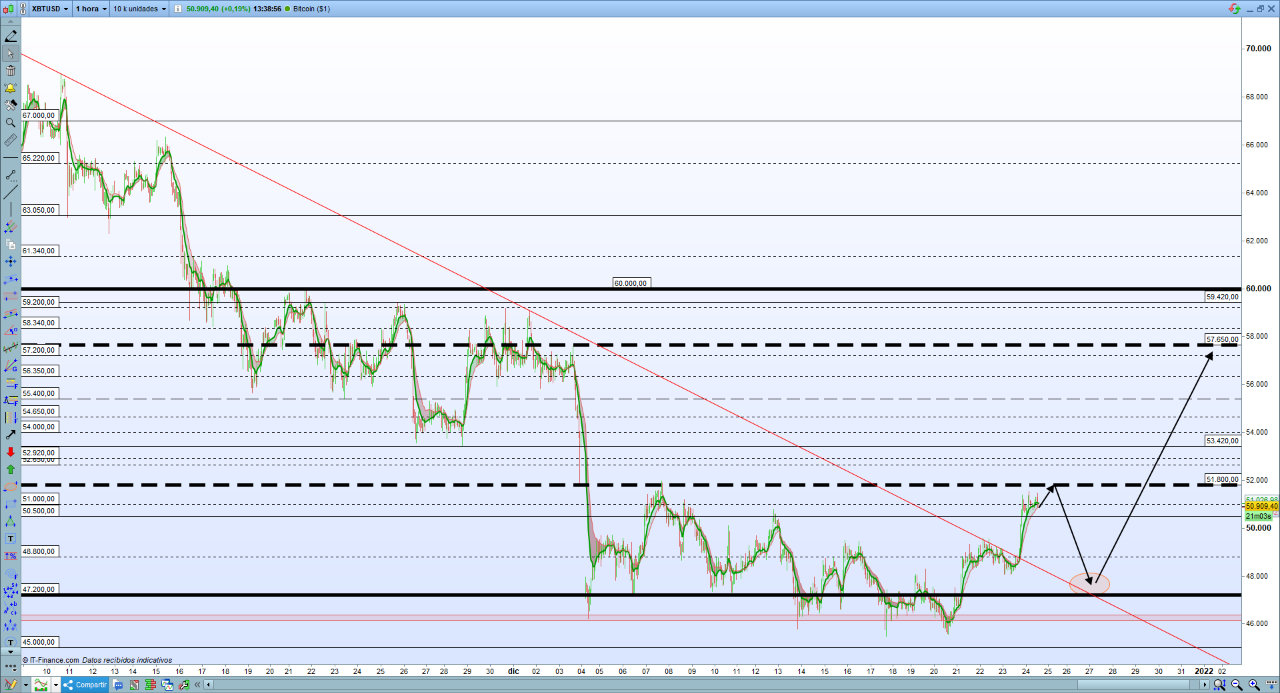
Last December 17th , when BTC was on 47.641 we alerted that we could have a closely rebound. We pushed up till 51,6k. Next resistances are on:
- 51.800 (BIG)
- 53.420 (LOW)
- 55.400 (MEDIUM)
- 57.400 (BIG)
- 60.000 (BIGGEST)
IMO, I think that before testing next resistances we could have a big drop to clean reatil leveraged positions if we are not able to break 51.800 (H1 confirmation).
Happy Merry Christmas to everybody!

View original →Bearish(Nuanced)BTC
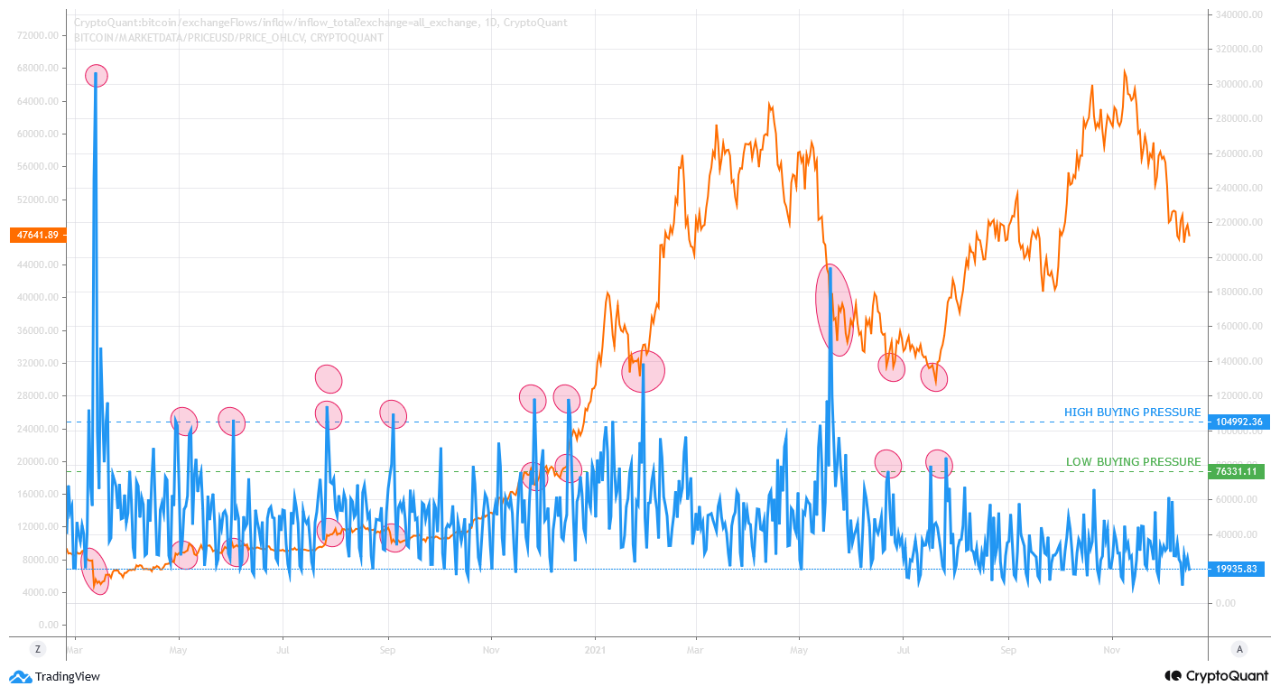
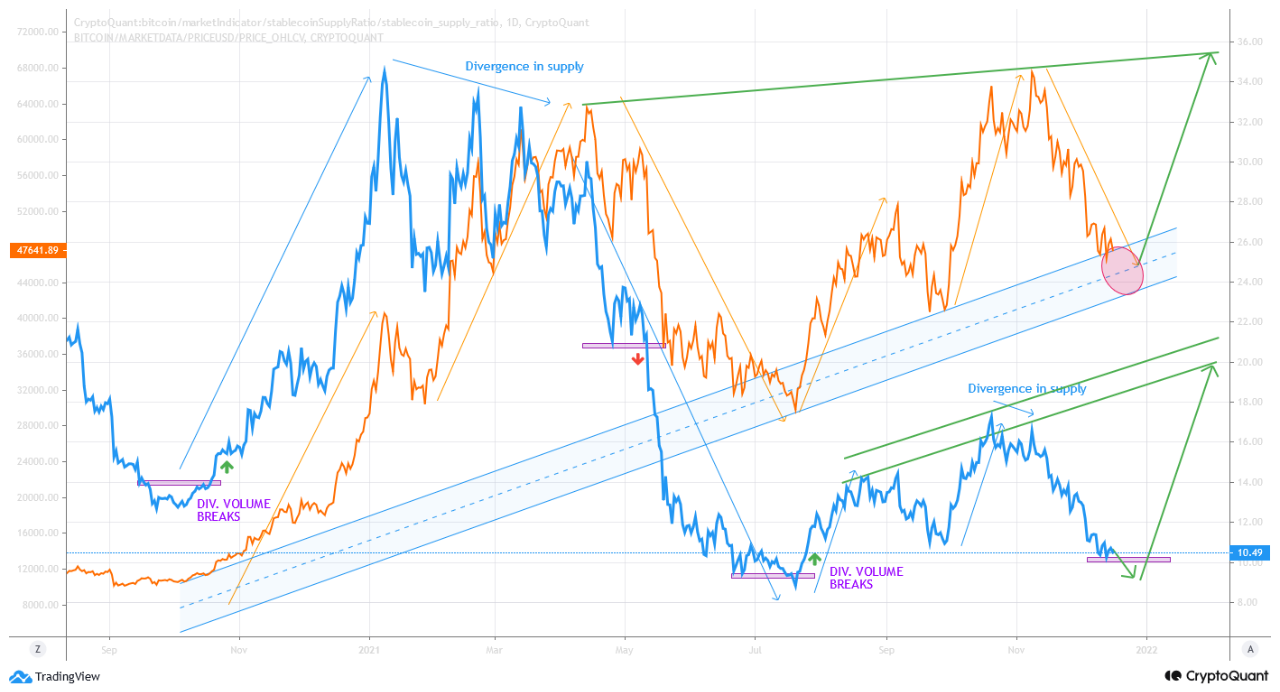
12/17/2021 If we analyze #bitcoin with the inflows dat we observe that there is still no buying pressure.
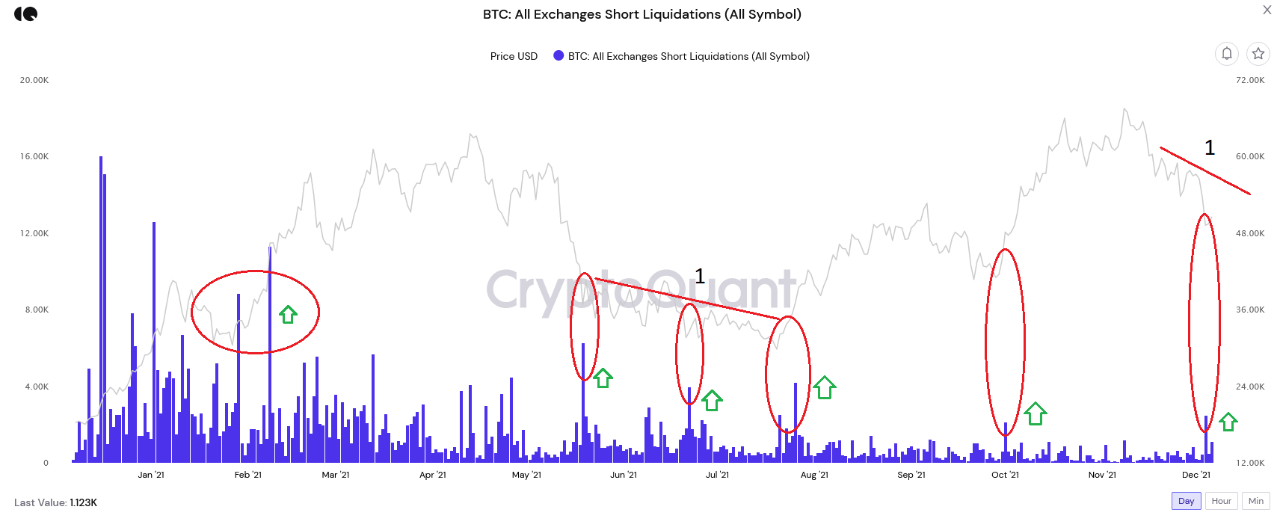
With long liquidation, We usually have two short sales in a row. At this moment, may be we need one more.
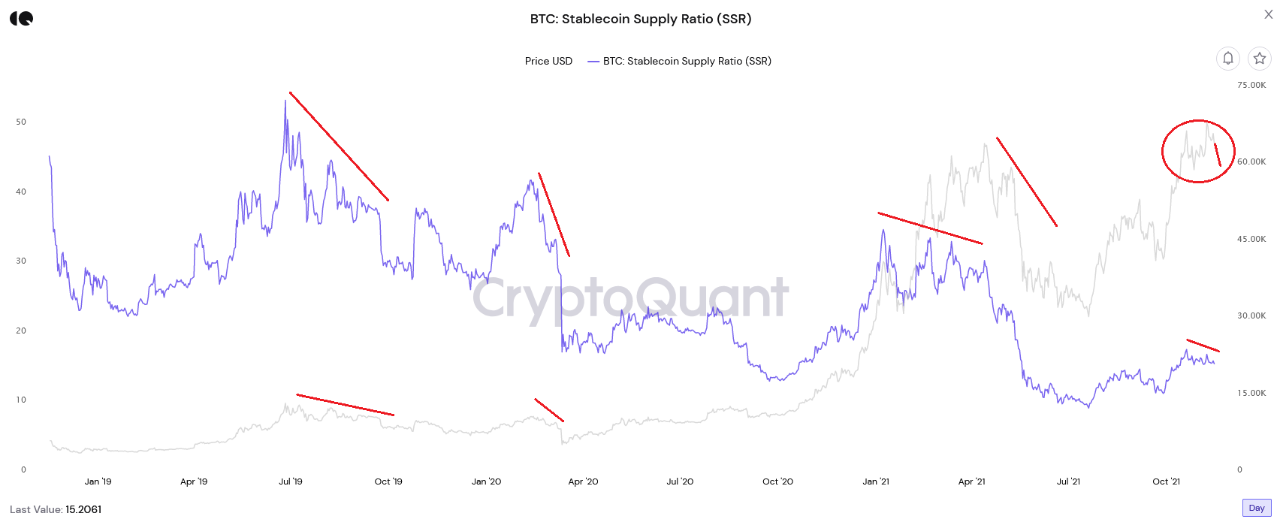
If we analyze the stablecoin supply compared to bitcoin at a technical level in the medium term, we observe that we are close to a support zone that in case of exceeding the selling divergence we could have a very important rebound.
I am usually bullish on #bitcoin , but this kind of dips, are very important to know if volume gives us some information. We will have to wait to a little break down on BTC and then start a bullish trend again.

View original →Bearish(Nuanced)BTC
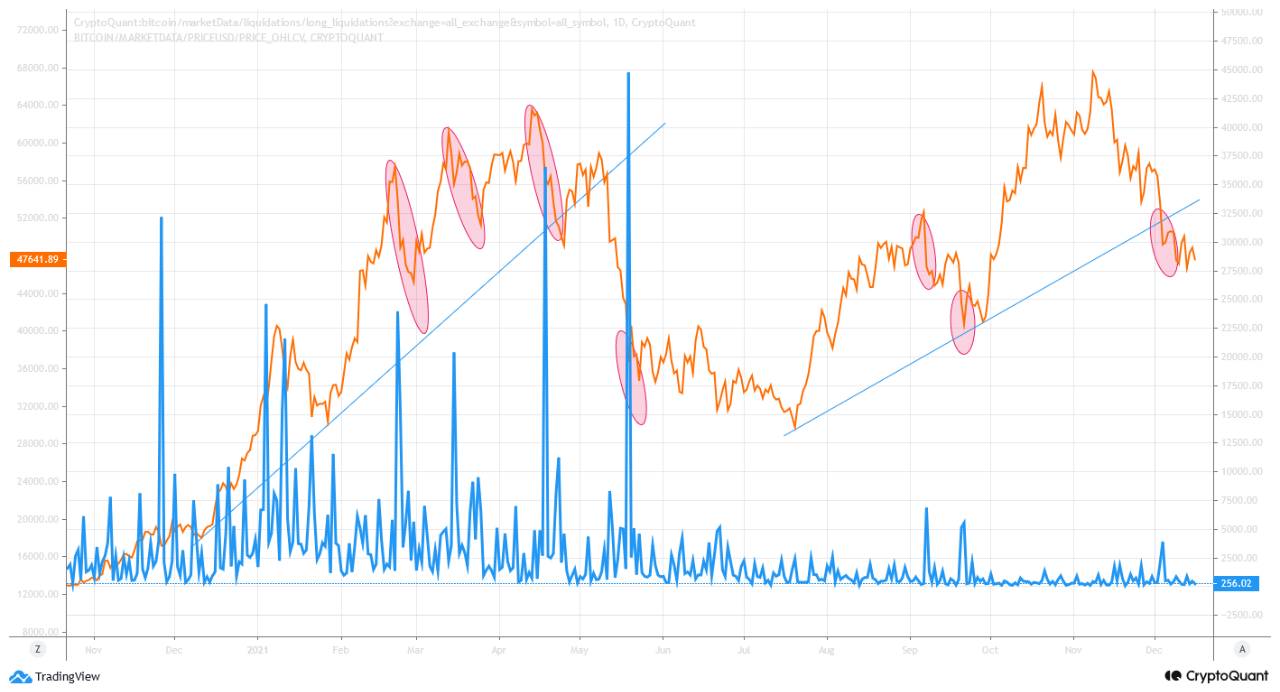
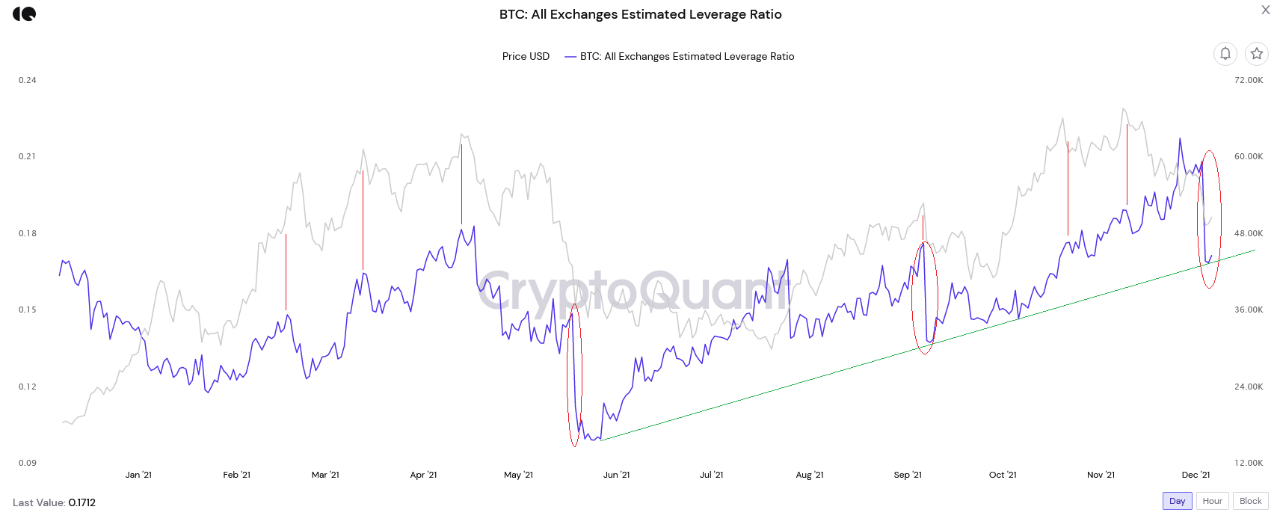
12/7/2021 Last saturday #bitcoin drop more than -15% in a big drawdown after long liquidations during european night. As we could see in all exchanges leverage ratio, when BTC is too leveraged, market go in contrarian way.
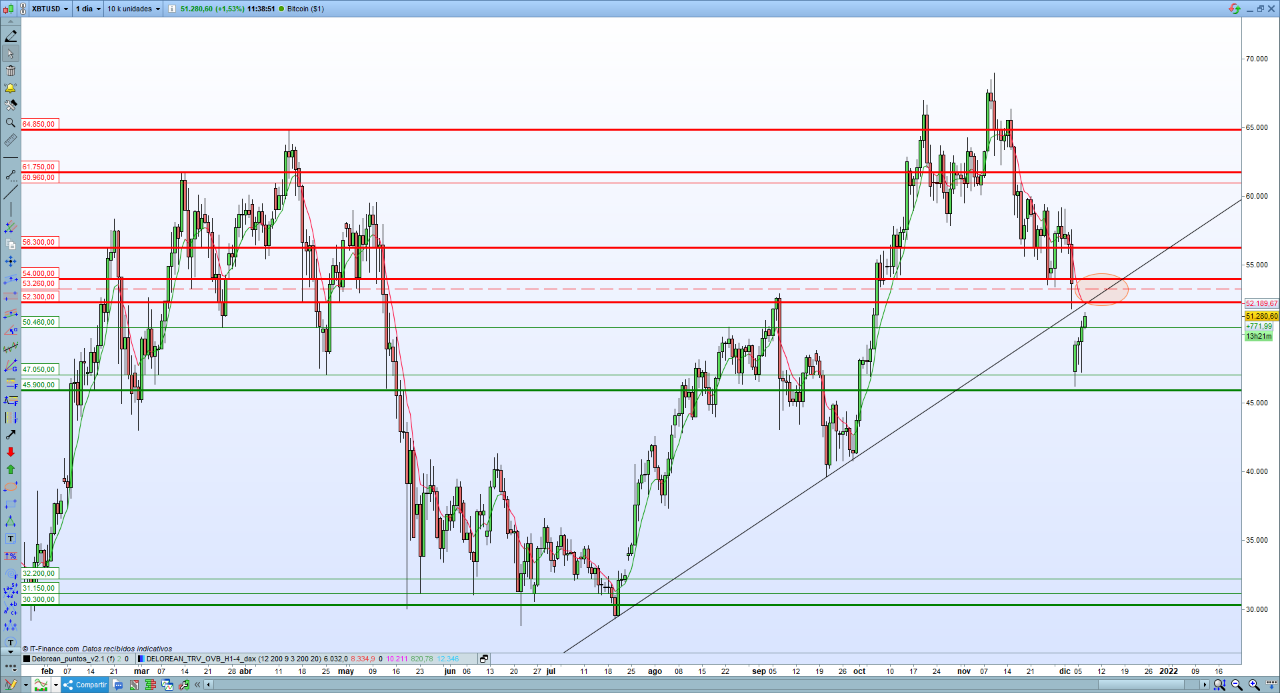
First graph inform us a similar correction of Q2 of this 2021.
BTC is still bullish but trend line is now broken, and it is important that we get back on top of it, and do not have a pullback near the circle zone in price graph.
Until bitcoin exceeds 54,000 points, the high volatility and the current correction will not pass.
Yesterday night i published in twitter my opinion of #bitcoin 10minutes before the push to 50k when #btc was at 49,3k and 2 targets have been achieved, now it rest 53-54k points. Here the tweet: https://twitter.com/deloreankt/status/1467973644588564482?s=20

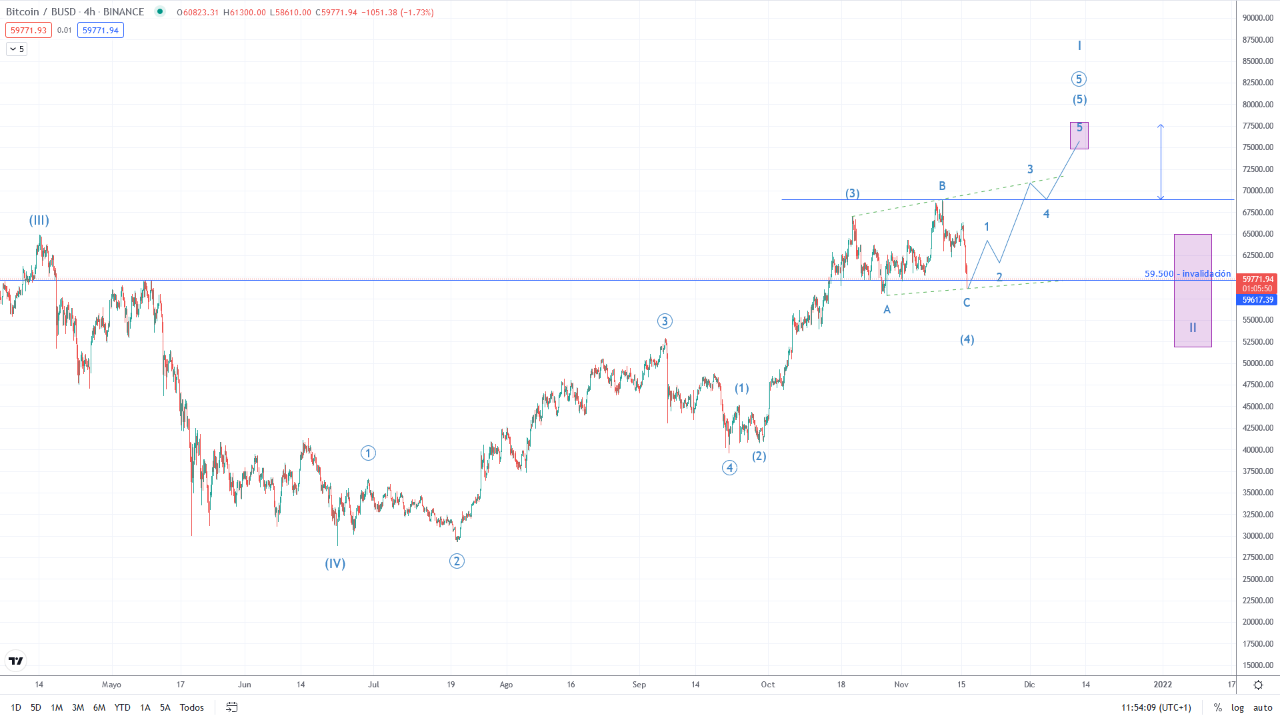
View original →There is a certain correlation between elliott waves and stable crypto issuance as you can see in the graph below.
Last week I told you that #bitcoin could correct on ABC down to 58-59,000 points as it has happened. But the count changed on ABC to 4th wave FLAT.
The goal remains the same: 74,000. We still are bullish on BTC.

View original →Bearish(Nuanced)BTC
11/11/2021 Dear readers,
This is my first post on cryptoquant as a CQ verified for this website. I will try to be as impartial as possible.
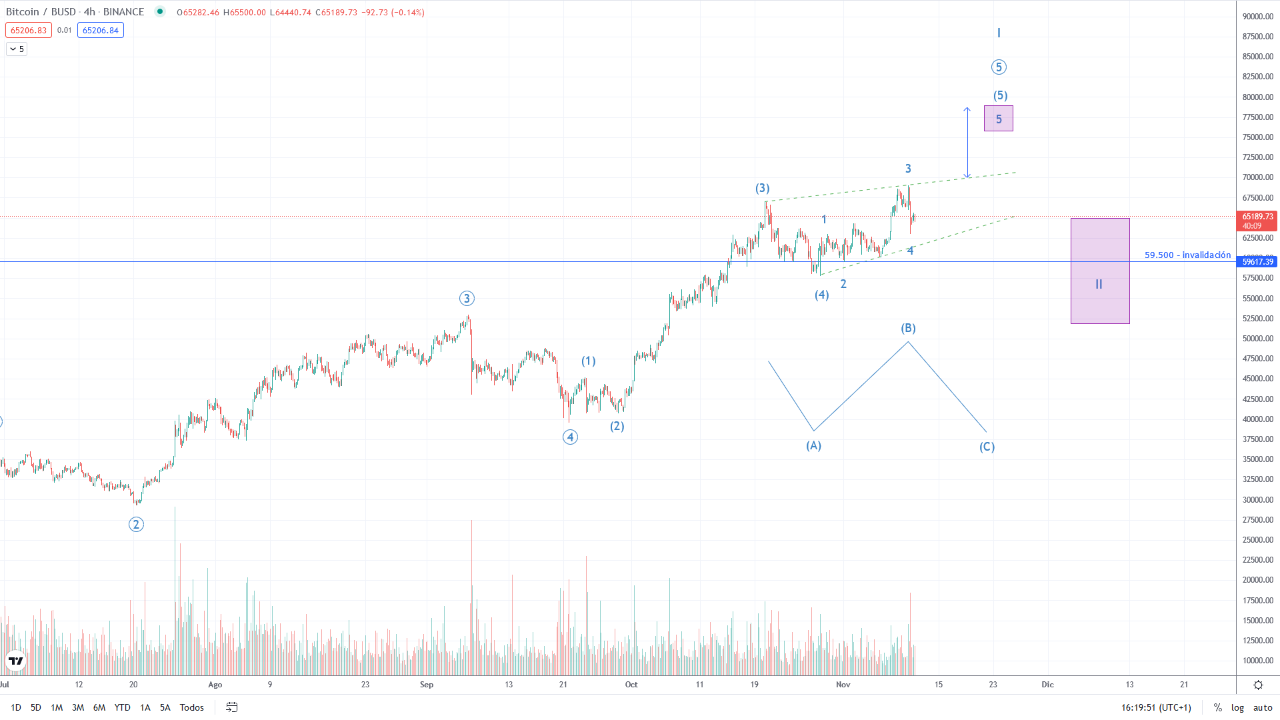
I attach an image of the possible current cycle of #elliott, which would be invalidated in ABC if it loses 59,500$, although if it loses the 62,950 it would give way to the possible correction to the base, in C wave. The extension of 5 wave of I, could carry bitcoin to $ 74,000 "target".
About quant level, we can see that leverage is reaching high areas.

View original →

