


Bullish
BTC
12/17/2025Exchange reserves down 15% as ETFs pull 850K BTC off market. SOPR shows rational profit-taking—none of the euphoric dumping seen in past cycle tops. Supercycle thesis gaining steam as institutions...
View original →Sentiment timeline shows relative sentiment within this analyst's history. A perma-bull showing 8 bullish : 2 bearish in a bear market sets that as their baseline. If you notice any errors, claim @cryptohell to submit corrections.
Exchange reserves down 15% as ETFs pull 850K BTC off market. SOPR shows rational profit-taking—none of the euphoric dumping seen in past cycle tops. Supercycle thesis gaining steam as institutions...
View original →The recent 155% tariff hike in U.S. imports could reshape global liquidity flows. Historically, protectionist measures like this tend to raise domestic inflation, strengthen the dollar temporarily, and pressure risk assets — including crypto. But on-chain data tells a different story. 📉 Exchange Netflow (BTC & ETH) has shown consistent outflows since mid-October, suggesting that investors are moving coins off exchanges. This typically reflects quiet accumulation by smart money, not panic selling. 💵 Meanwhile, Tether (USDT) Exchange Netflow (All Exchanges) recorded consistent inflows throughout October, with a few billion-dollar spikes in mid-month. This means buying liquidity remains healthy, even as risk sentiment weakened late in the month. ⚒️ Miner Position Index (MPI) remains low, showing that miner selling pressure is minimal. Historically, miners holding through uncertain macro conditions signal long-term confidence in Bitcoin’s value. 📊 In terms of valuation, MVRV Ratio is still below the euphoric zone, implying the market isn’t overheated yet, even with global risk sentiment turning cautious. Conclusion: While higher tariffs could tighten liquidity in the short term, on-chain data shows large holders are buying the dip, not exiting. As long as exchange selling pressure stays low and stablecoin inflows continue, Bitcoin may emerge as a hedge against U.S. fiscal and trade risks. 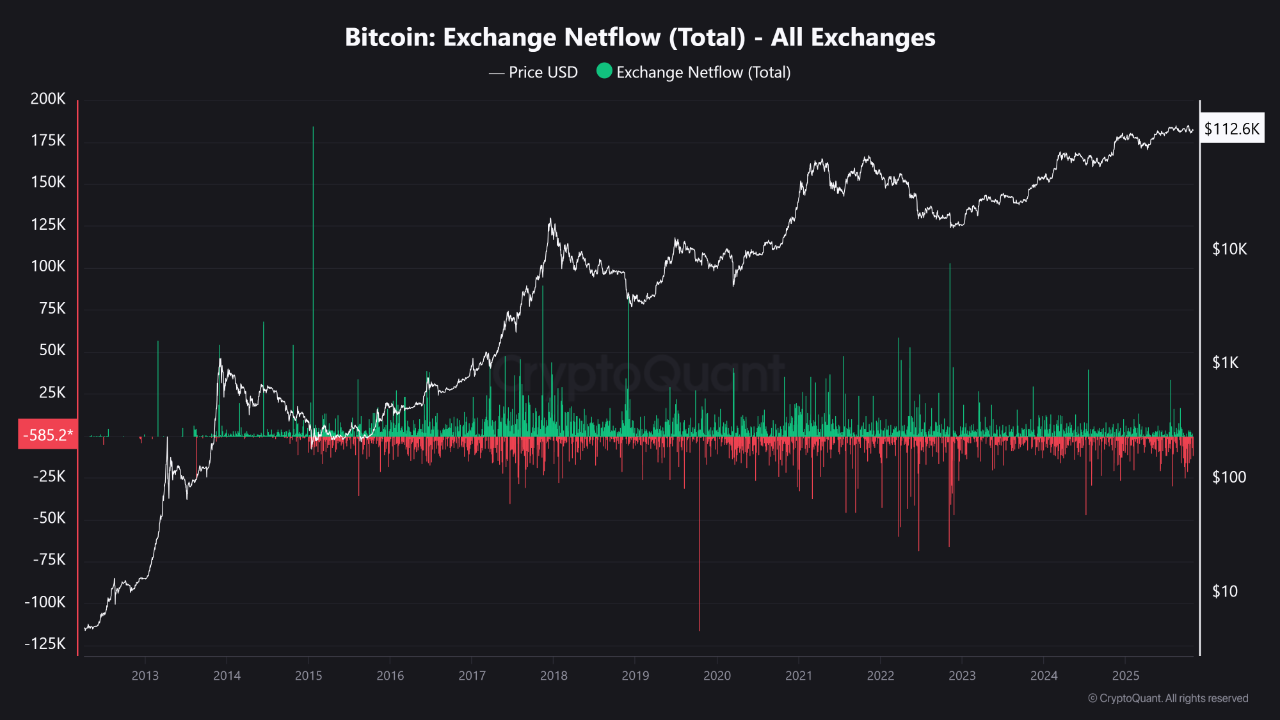 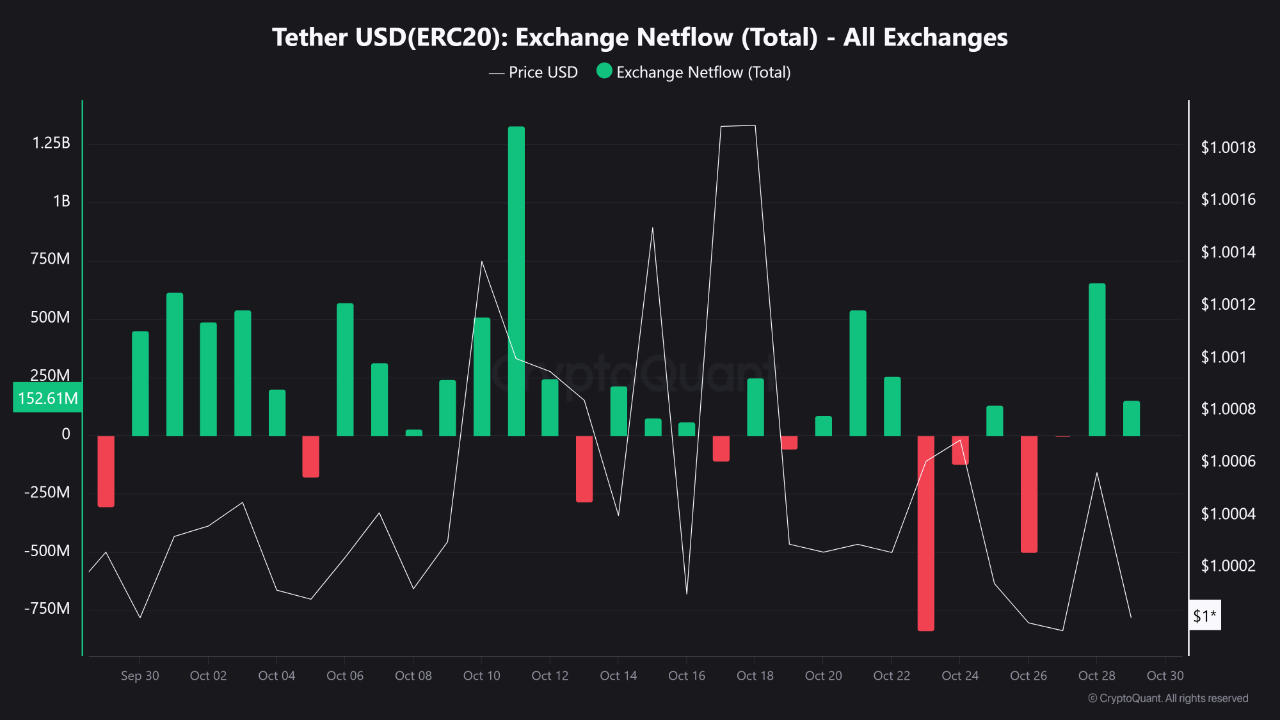 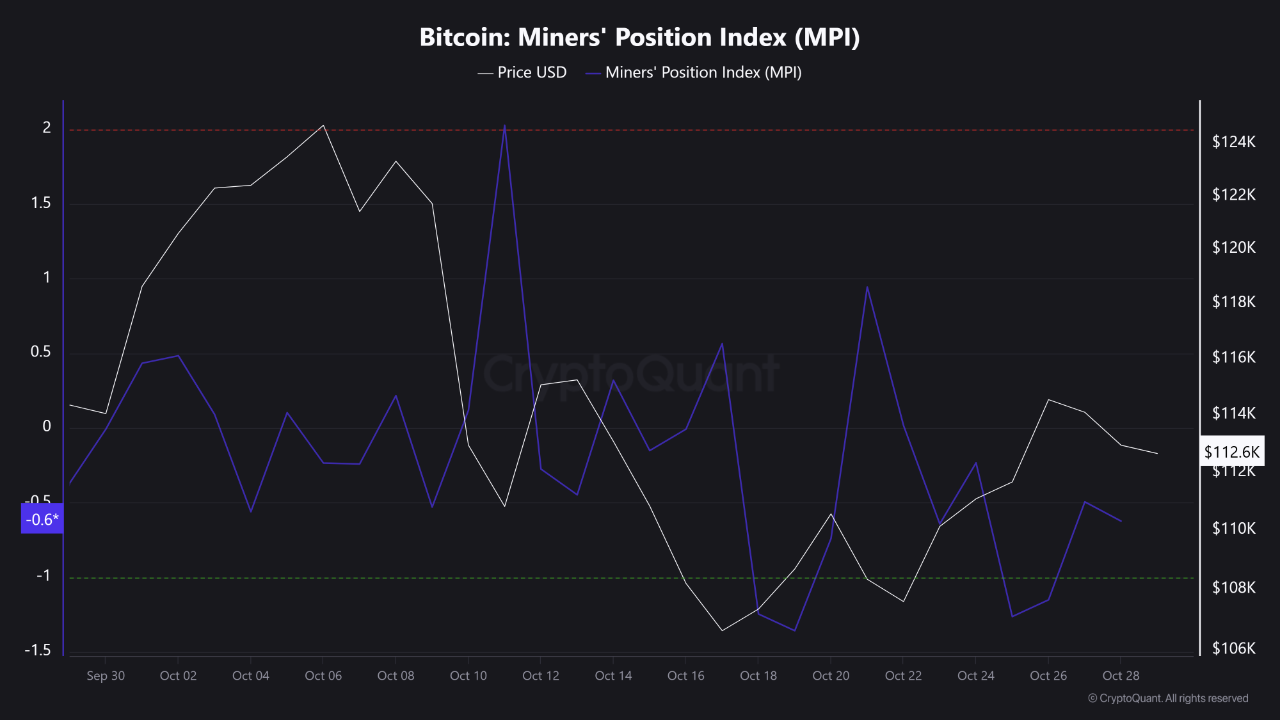 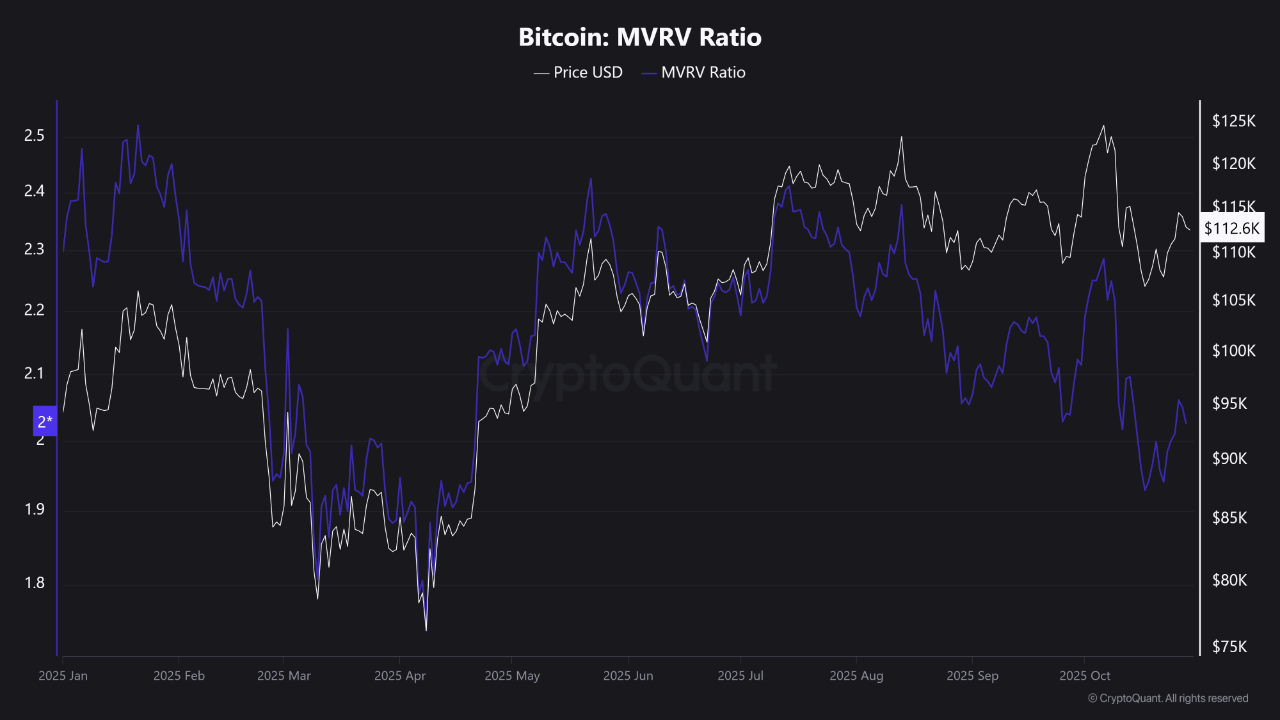 
View original →Overall, the data suggests that despite short-term selling pressure, some fundamental factors still show relatively positive signs for the Bitcoin market. Selling pressure from miners and long-term holders is low, but sentiment from institutional investors and the US market is somewhat weak. Volatility may continue, with technical indicators suggesting that the market might be nearing a short-term peak, especially due to overbought signals from the Stochastic indicator. Investors should remain cautious, as profit-taking and selling pressure are evident from several sources. However, there is still potential for a longer-term bullish trend if selling pressure eases and market sentiment improves. 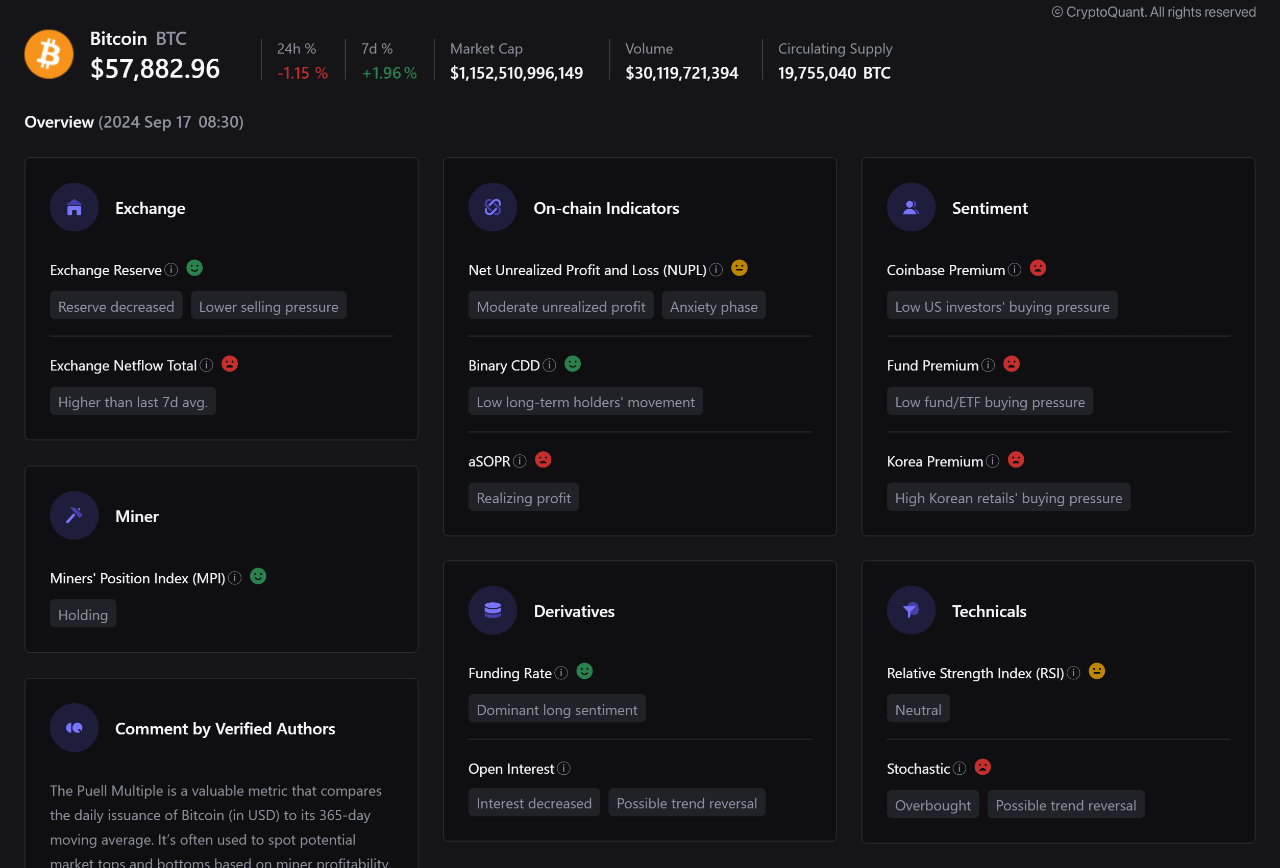 
View original →The bull-bear market cycle indicator from CryptoQuant illustrates the recurring cycles of Bitcoin over recent years, highlighting movements between overbought phases (Overheated Bull) and oversold phases (Extreme Bear). Each bull market phase is followed by a bear market, demonstrating how market volatility and sentiment heavily influence Bitcoin's price. As of 2024, Bitcoin is in a transitional phase, showing early signs of recovery from the bear market. However, there is no clear indication yet whether the market is ready to enter a strong bull phase again. This indicator is valuable for investors and traders, as it helps them determine when to enter or exit the market based on the current market cycle conditions. 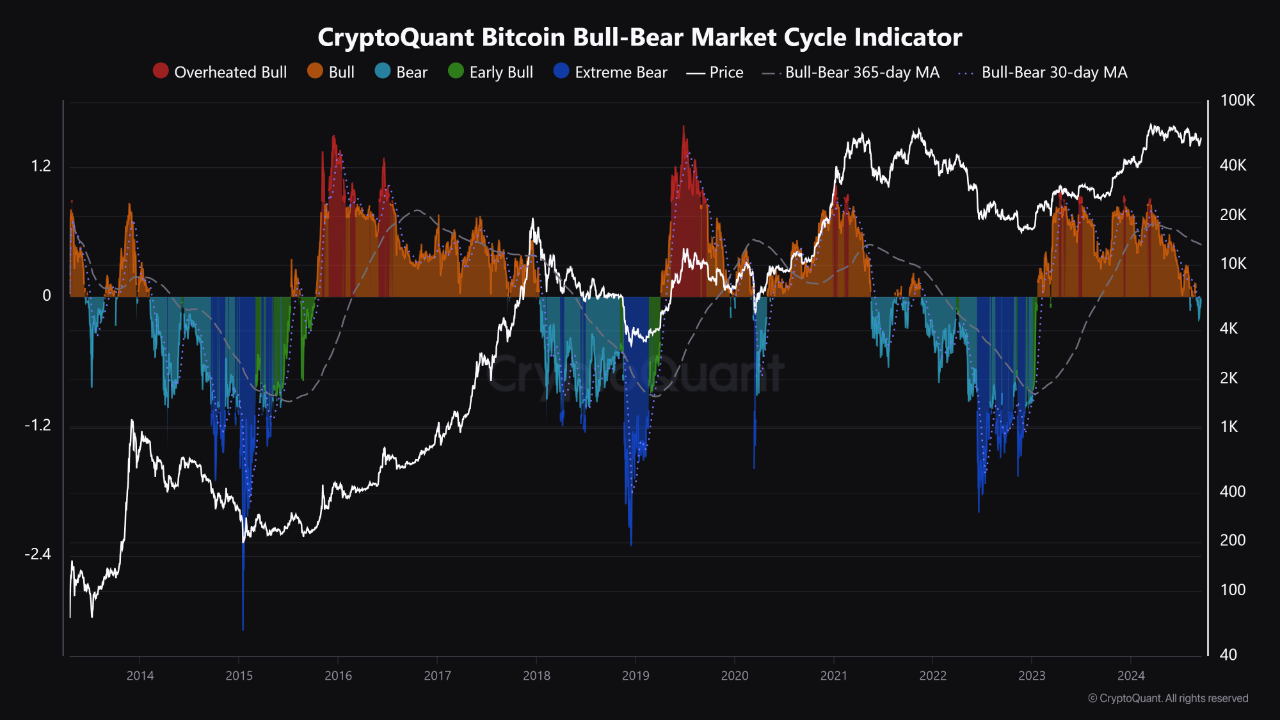 
View original →As of September 16, 2024, Bitcoin is trading at $58,650.75, showing short-term volatility with a 2.56% 24-hour decline but a stronger 7.09% recovery over the past week. The market exhibits a mixed sentiment. On one hand, on-chain data like decreasing exchange reserves, low Binary CDD, and miner holding behavior signal a bullish stance for long-term holders. However, there are cautionary signals, such as a high exchange netflow and profit realization as shown by aSOPR, indicating that some traders are taking profits after recent gains. The sentiment is split: U.S. investors are buying at a premium, but institutional buying pressure is weak, as reflected in the low fund premium. Korean retail interest is high, possibly leading to localized speculative buying. Derivatives data show a dominant long sentiment, with rising open interest further validating a market belief in upward movement. However, overbought technical indicators like the Stochastic Oscillator warn of a potential short-term price correction. Overall, the market is in a state of cautious optimism with some risk of short-term pullbacks, while long-term holders remain confident. 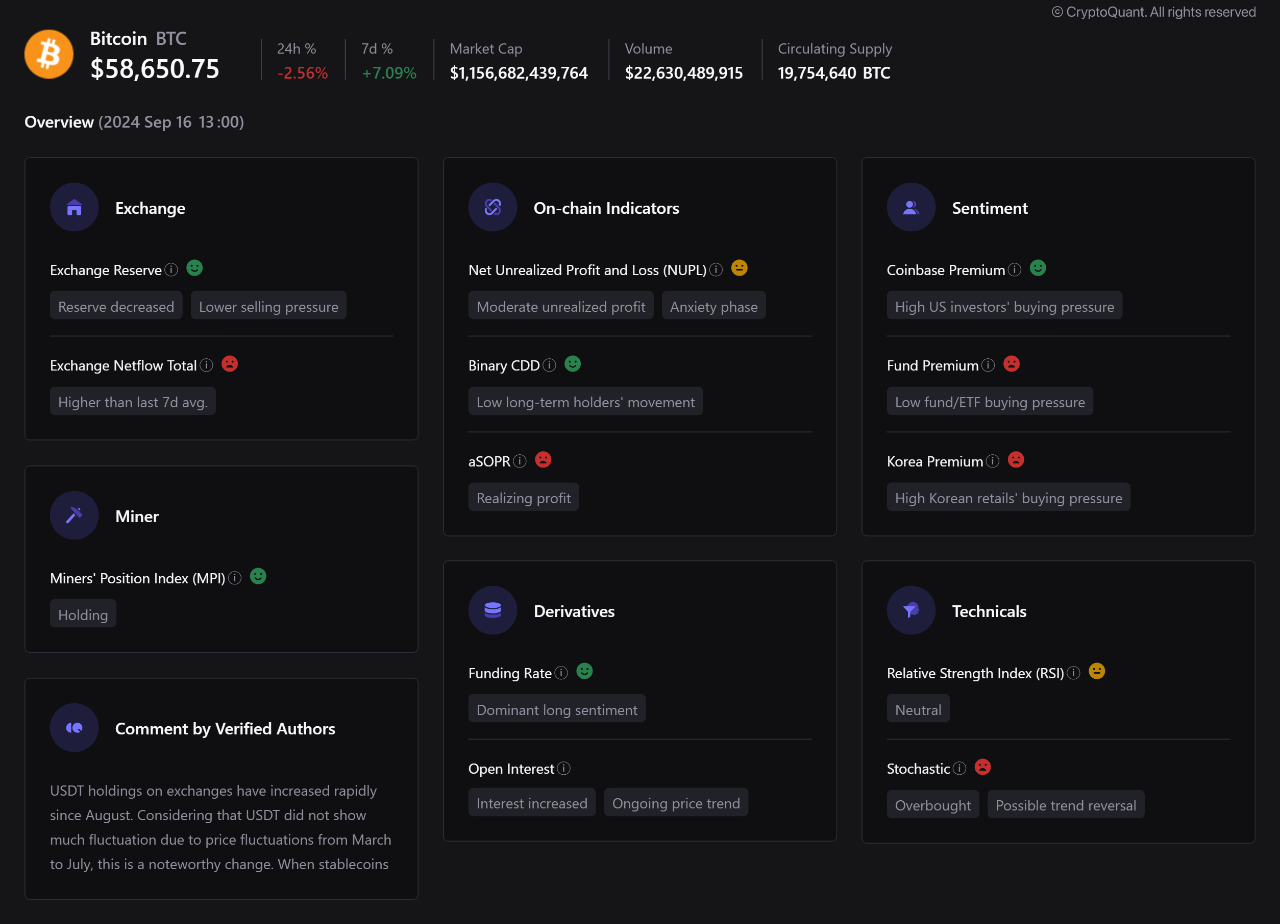 
View original →The current Bitcoin market, as of September 14, 2024, presents a nuanced picture characterized by a mix of positive and cautionary signals. On the bullish side, lower exchange reserves indicate reduced selling pressure, a sign that market participants may be holding their assets with expectations of further price appreciation. This is further supported by positive sentiment from US-based investors, as reflected in the Coinbase Premium, and strong demand from institutional funds and ETFs, indicated by the Fund Premium. These factors suggest that a solid base of buyers exists, which could help sustain or push the price higher in the near term. However, there are also significant signs of caution that warrant attention. The higher-than-average exchange netflows suggest that more Bitcoin is being moved to exchanges, which could point to an increase in potential selling activity. This, combined with the realization of profits as indicated by the aSOPR metric, hints that some market participants may be looking to take gains off the table, possibly putting downward pressure on the price. Additionally, in the derivatives market, the negative funding rate signals a predominance of short positions, further pointing to bearish sentiment among leveraged traders. On-chain data reflects a market in a phase of moderate unrealized profits, characterized by an “anxiety phase,” where participants are unsure whether to sell or hold. Long-term holders, however, remain relatively inactive, a positive sign as it suggests that these key players are not distributing their Bitcoin en masse. The technical indicators, such as RSI and Stochastic, are currently neutral, indicating that the market is neither overbought nor oversold. This neutral stance from technicals could imply that Bitcoin is at a decision point, where the next price movement could be driven by shifts in market sentiment or significant news events. 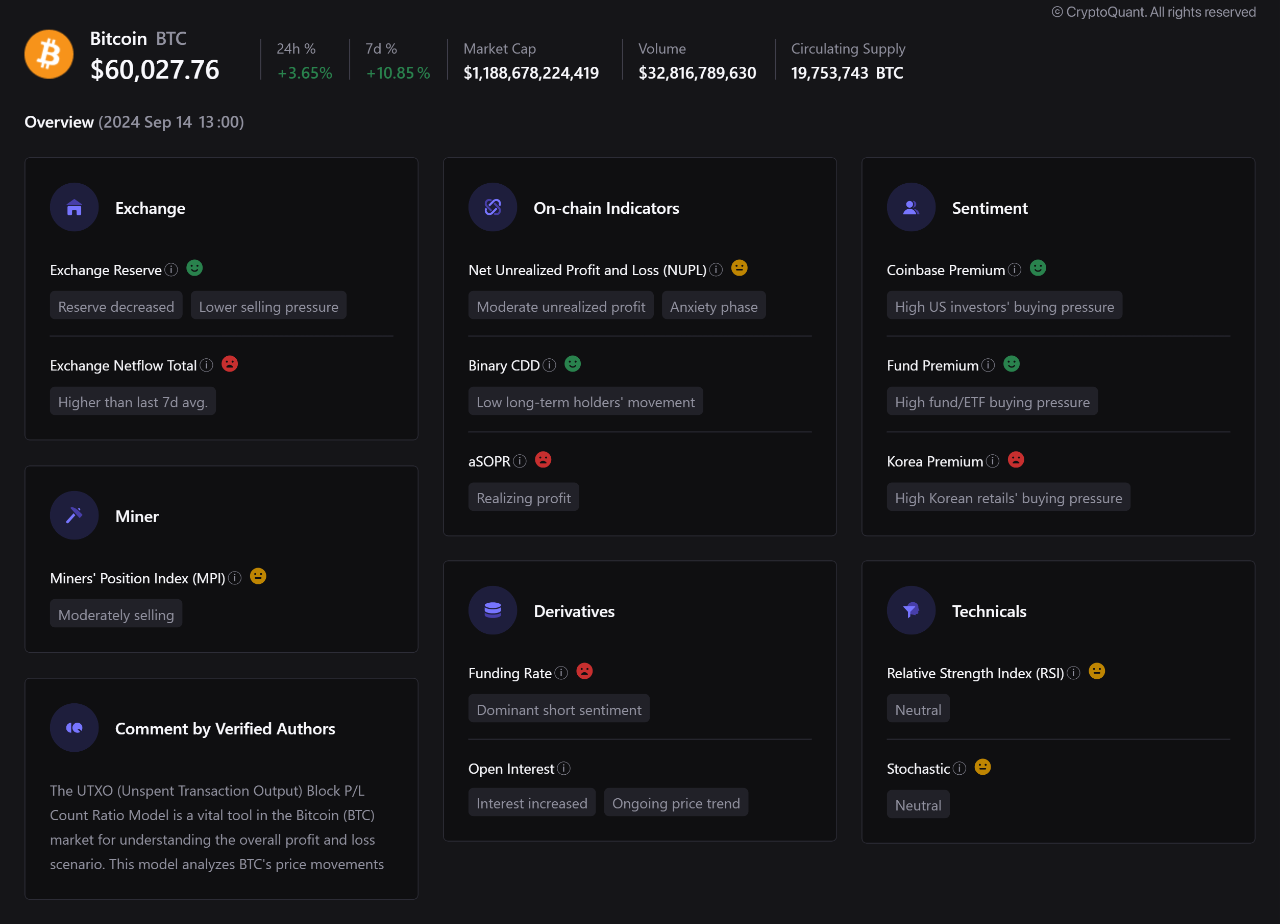 
View original →The current Bitcoin market shows cautious optimism, with key indicators pointing to stability despite some short-term concerns. A decrease in Exchange Reserves indicates reduced selling pressure, a positive sign as fewer Bitcoins are available on exchanges. However, a rise in Exchange Netflow Total suggests more Bitcoins are being moved to exchanges, which could signal increased selling pressure soon. Miners are showing confidence in the market. The Miner’s Position Index (MPI) reveals that miners are holding onto their Bitcoin instead of selling, reducing the available supply and supporting a bullish outlook. On-chain indicators reflect a mix of caution and stability. The Net Unrealized Profit and Loss (NUPL) shows the market is in an "anxiety phase," where participants are realizing moderate profits but remain cautious. Binary CDD is low, indicating that long-term holders are not moving their Bitcoin, suggesting confidence and market stability. Meanwhile, the aSOPR (Spent Output Profit Ratio) reveals that many sellers are transacting at a loss, which could signal capitulation, often a precursor to a market recovery. Market sentiment is split. The Coinbase Premium is low, indicating weak buying pressure from U.S. investors. However, the Fund Premium is high, reflecting strong institutional demand, and the Korea Premium is also elevated, showing strong retail interest from Korean traders. While this could point to speculative behavior, it still supports overall buying pressure. In the derivatives market, the **Funding Rate** shows that most traders are betting on price increases, and the rising **Open Interest** signals growing participation, which may further support the current price trend. Technically, both the RSI and Stochastic indicators remain neutral, indicating no clear trend toward an imminent price move. 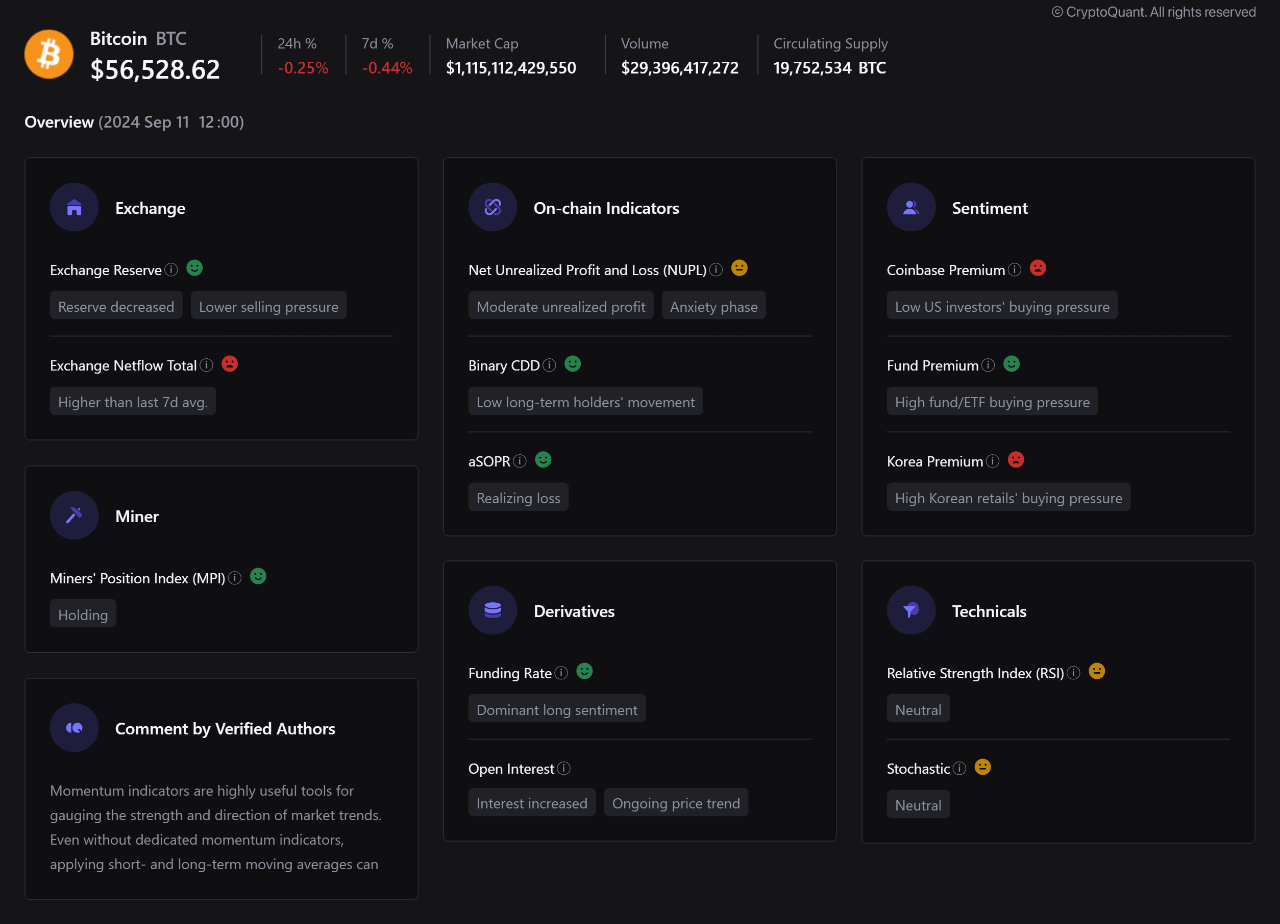 
View original →The payments to Mt. Gox creditors are linked to the mid-July Bitcoin price drop. The substantial inflow of Bitcoin to the Kraken exchange suggests many creditors opted to sell their Bitcoin, increasing supply and leading to lower prices. This illustrates how major events like creditor payments can impact market dynamics and asset prices. 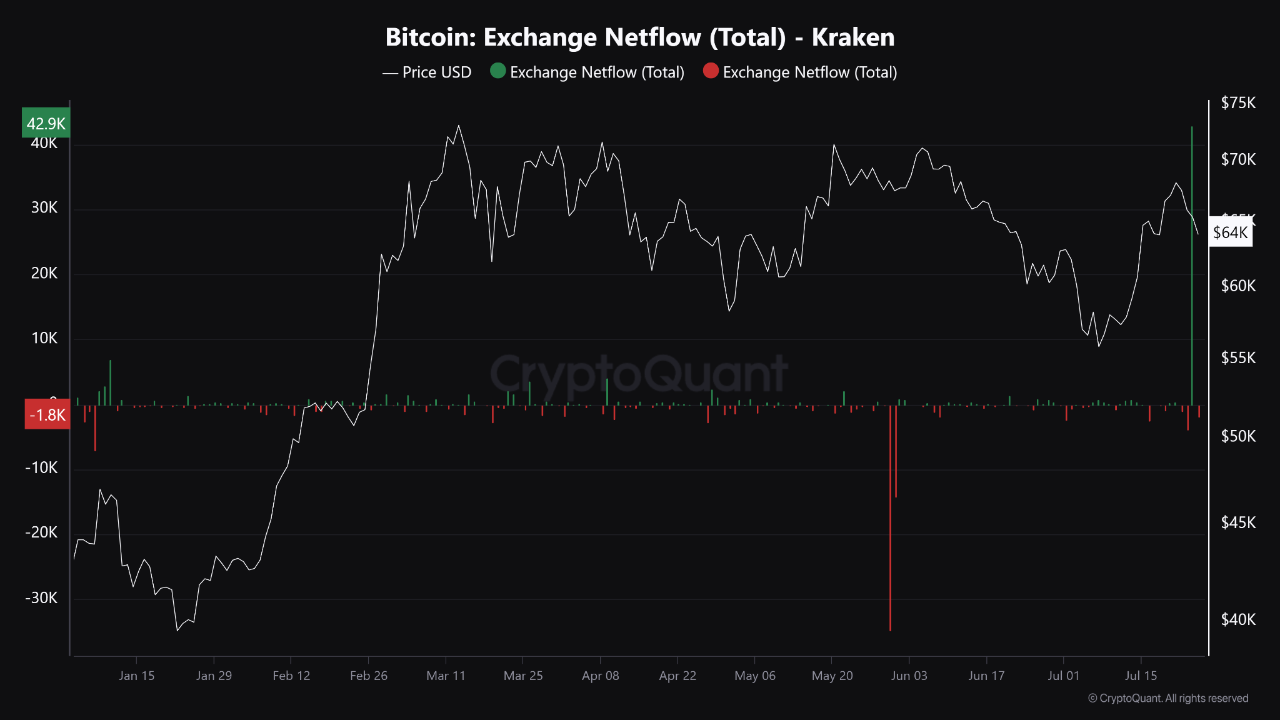 
View original →Bitcoin: Exchange Reserve - All Exchanges graph shows two things: the amount of Bitcoin stored in exchanges (Exchange Reserve) and the Bitcoin price in USD. Exchange Reserve (blue line): From early 2022 to mid-2023, there's a downward trend, indicating Bitcoin is being moved from exchanges to personal storage. A sharp drop in early 2023 could be due to market events or exchange policies. This trend suggests either long-term confidence in Bitcoin or concerns about exchange security. Bitcoin Price (white line): Starting in 2023, the Bitcoin price shows a significant rise, going from around $40K to over $70K. This increase happens even though the amount of Bitcoin on exchanges is decreasing, indicating higher demand or a limited supply. **Relationship Between Reserve and Price:** - There’s a negative correlation between the amount of Bitcoin on exchanges and its price. Less Bitcoin on exchanges means less supply in the market, pushing the price up. This is backed by the law of supply and demand. Conclusion: The drop in Bitcoin on exchanges helps increase its price. Other factors like global economic conditions and monetary policies also impact the market. Investors should pay attention to these dynamics when planning their strategies. Analyzing these trends gives important insights into the broader crypto market. 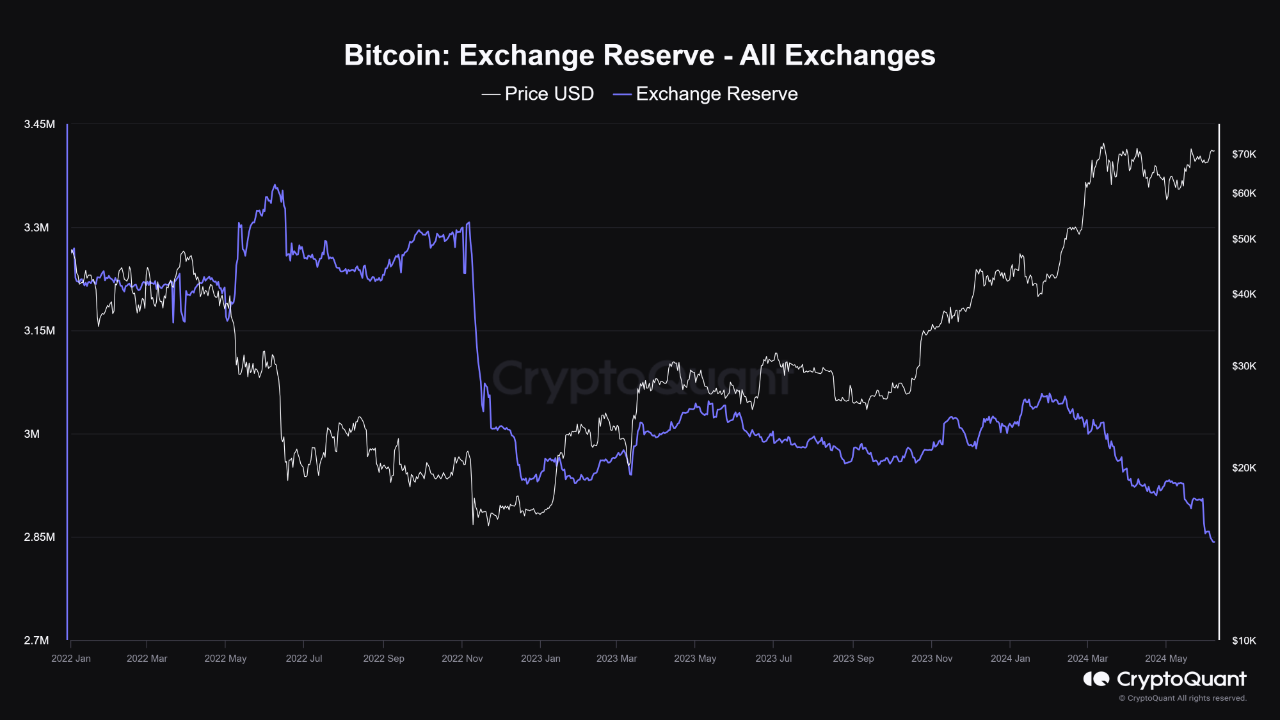 
View original →Here's the translation in a relaxed style: So, here's the deal with the Puell Multiple indicator. Right now, the ratio on the Puell Multiple is sitting at 0.8, which basically means Bitcoin is still in the "safe to buy" zone at the current price range. But hey, remember this: back in 2012, 2016, and 2019, whenever the ratio hit around the same numbers, the price always took a breather before jumping back into bullish territory. Keep an eye out, though. When the ratio gets close to that red zone or hits around 6, it usually means the price is nearing its peak. 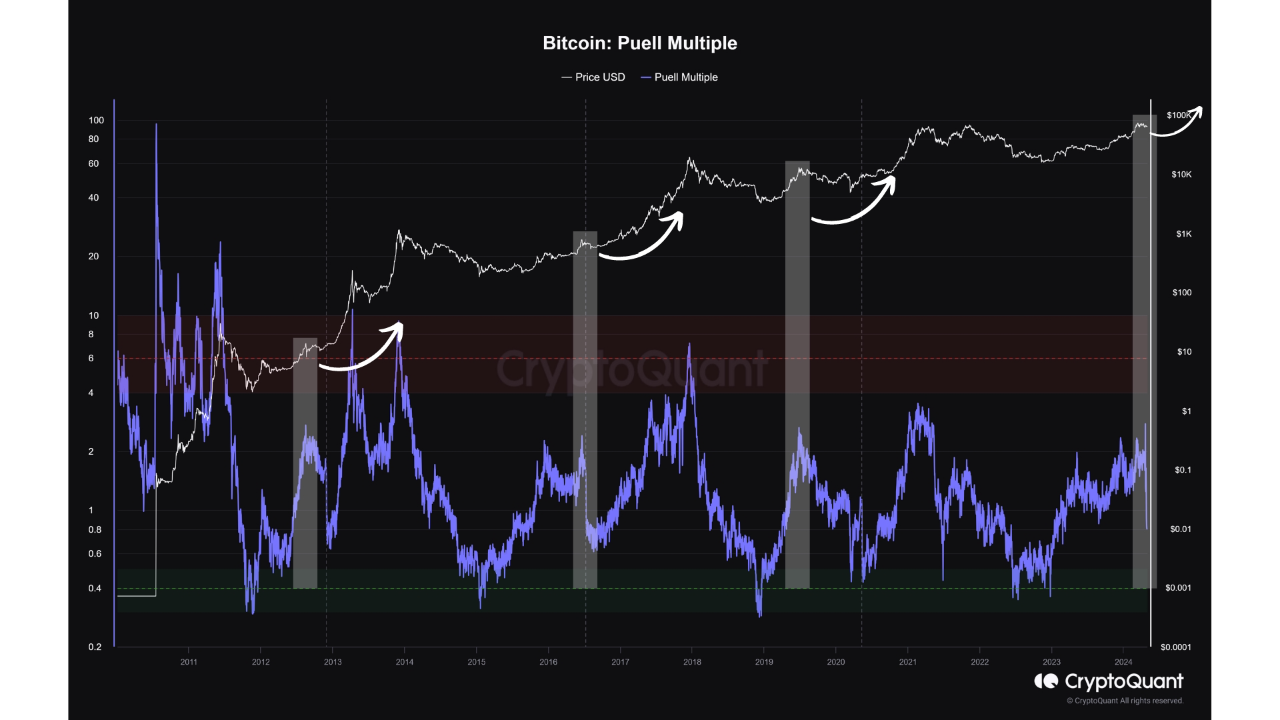 
View original →