Bearish(Nuanced)BTC
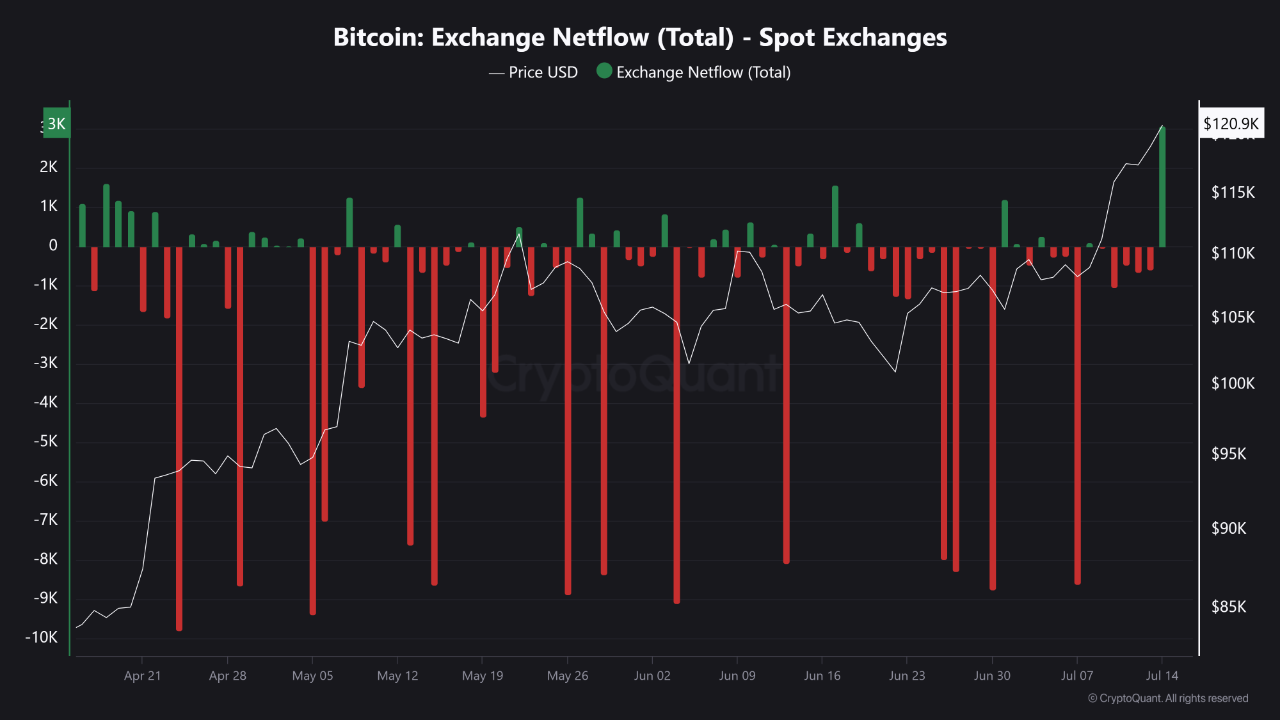
7/14/2025 After reaching a new all-time high of $123,000, Bitcoin is showing signs of short-term cooling, driven by on-chain investor behavior. According to Exchange Netflow data, we observed a noticeable spike in inflows toward centralized exchanges, indicating a wave of profit-taking activity by short-term holders and some whales.
This kind of movement typically suggests a local top and could lead to a healthy correction or consolidation in the coming days. It's a classic pattern we've seen after previous parabolic rallies — profits are realized, weak hands exit, and price finds a new base.
However, it’s important to note that despite this inflow spike, the overall momentum remains bullish:
Long-term holders are still sitting tight.
ETF inflows and macro sentiment remain positive.
No significant outflows from institutional wallets.
In summary:
✅ Short-term correction likely due to profit-taking
✅ No major long-term trend reversal
✅ Bullish momentum intact

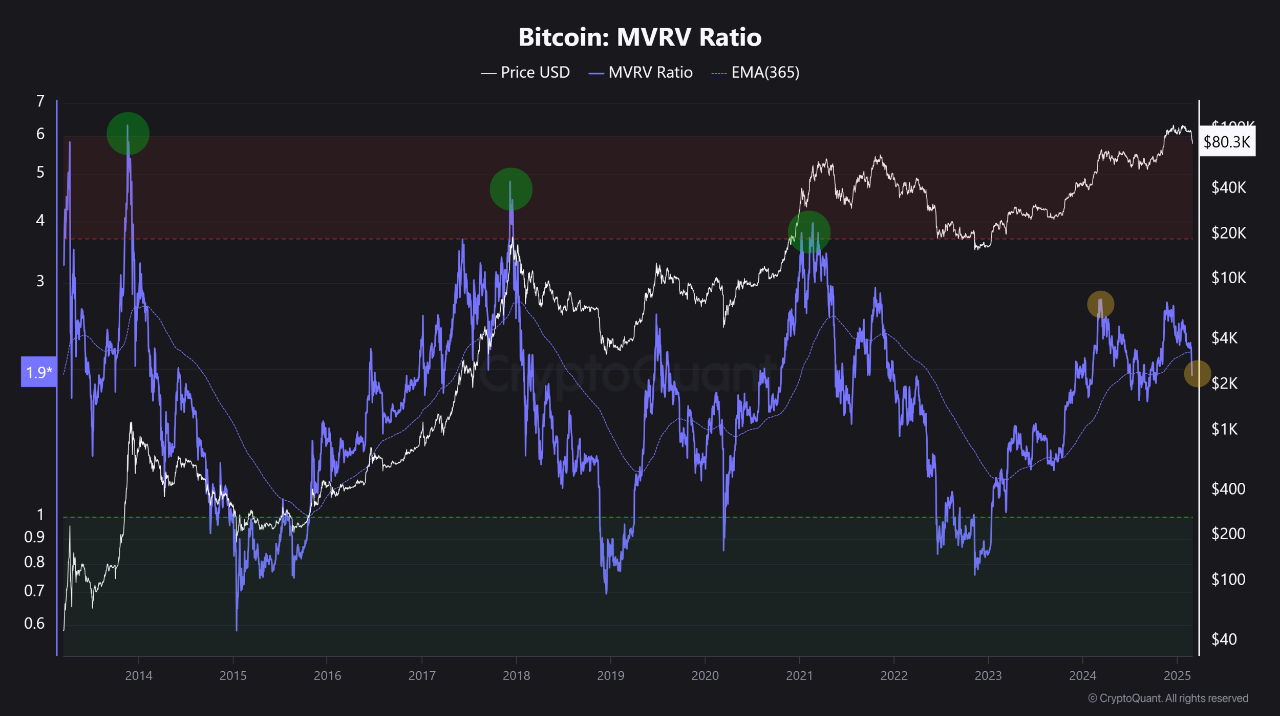
View original →A major correction is underway, with Bitcoin experiencing a sharp decline of 22% in a single weekly candle, dropping below $80K after reaching its peak at $110K.
Altcoins are seeing even steeper losses, leaving many traders on the verge of capitulation.
The key question now: Is this the end of the cycle, or can we expect new highs?
Analyzing the Market Cycle Top & Bottom Indicators
To determine whether Bitcoin has reached a market top or is forming a new bottom, we turn to key on-chain indicators that have historically signaled major cycle shifts.
1️⃣ Historical Peak Indicator:
The price topped out in every previous Bitcoin cycle when this indicator reached at least 3.5.
When Bitcoin hit $110K in the current cycle, the indicator only registered 2.7, suggesting the cycle had not yet reached its peak.
Following the price correction, the indicator has now dropped further to 1.9.
2️⃣ Key Support & Potential Rebound:
A drop below the 365-day moving average is undeniably a bearish signal.
However, Bitcoin still has one last chance for a strong rebound from the $65K region, which serves as a critical floor. (This does not mean the price must reach $65K, but rather that it's a strong support level.)
What’s Next?
For this cycle to truly top out, the indicator would need to hit at least 3.0.
If Bitcoin finds support and successfully rebounds, we could see new all-time highs, with the price targeting $120K–$130K as the final peak of this market cycle.
The next few weeks will be crucial—either Bitcoin confirms a local bottom and resumes its uptrend, or we see deeper corrections before a new leg up.
Stay cautious, but don’t lose sight of the bigger picture.

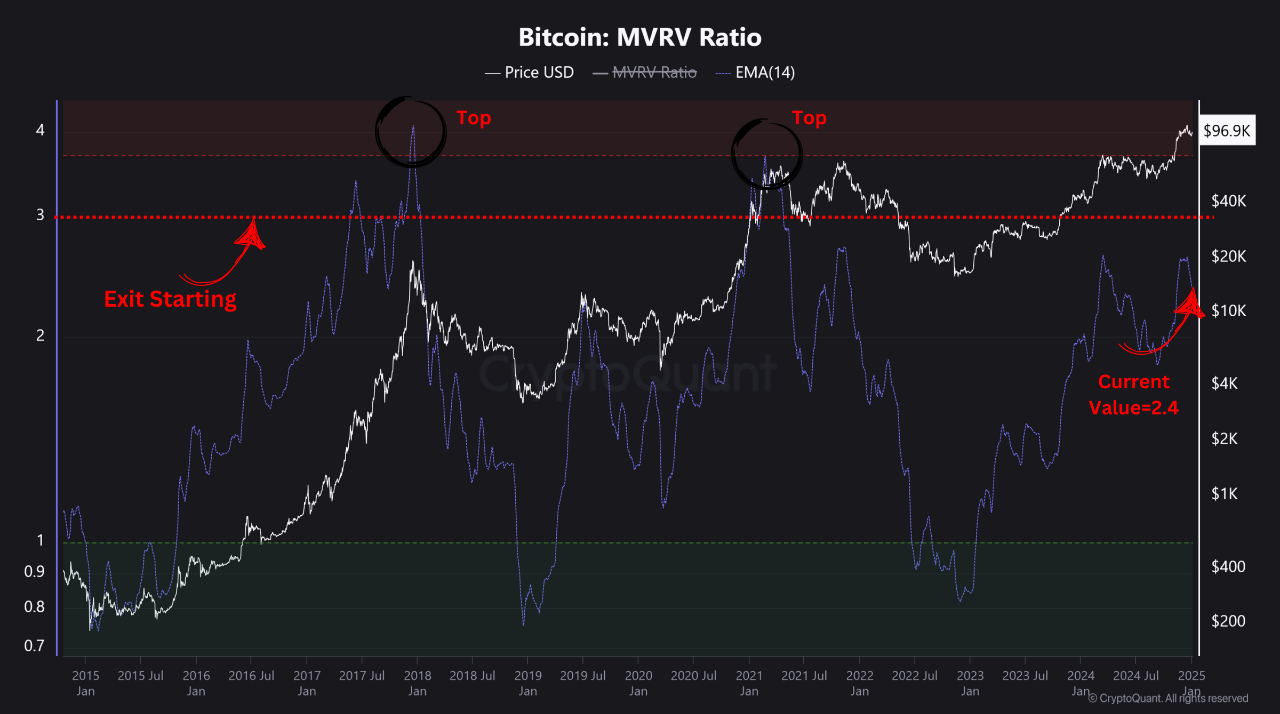
View original →The MVRV indicator is the only one that has consistently succeeded in identifying market tops and bottoms throughout all cryptocurrency market cycles.
This indicator is a crucial tool for determining when to begin exiting the market and avoiding being stuck in a prolonged bear market phase.
We typically reach market peaks when the MVRV indicator exceeds a value of 3 to 4.
To ensure a safe exit from the market, it is advised to start selling gradually as the MVRV value reaches 3.
Currently, the indicator stands at 2.4, suggesting there is still potential for price increases until we reach the target value. At this point, we can begin selling using a Dollar-Cost Averaging (DCA) strategy.
It is crucial to monitor this value consistently to make well-informed decisions.

View original →1. Bitcoin Exchange Reserves Declining
Bitcoin reserves on exchanges have been decreasing significantly, a trend that often precedes price rallies. This reduction signals reduced selling pressure as investors move Bitcoin to cold storage, limiting the available supply. Historically, such movements have been followed by price peaks, suggesting that a similar scenario may be unfolding now.
2. Rising Stablecoin Reserves
At the same time, stablecoin reserves on exchanges are increasing, indicating that investors are preparing to buy. Stablecoins represent ready-to-deploy capital, and their rising presence suggests that traders are waiting for the right opportunity to enter the market. This increase signals strong buying interest.
3. Bullish Market Setup
The combination of shrinking Bitcoin reserves and rising stablecoin reserves sets the stage for a bullish price breakout. With reduced Bitcoin supply and growing buying power, the market is primed for a potential upward move. Historically, this supply-demand imbalance has led to significant price gains.
4. Conclusion
Decreasing Bitcoin reserves and rising stablecoin reserves indicate a bullish outlook for Bitcoin. As the market supply tightens and buying power builds, we could be on the verge of a price rally. Investors should stay alert for a potential breakout in the coming weeks.


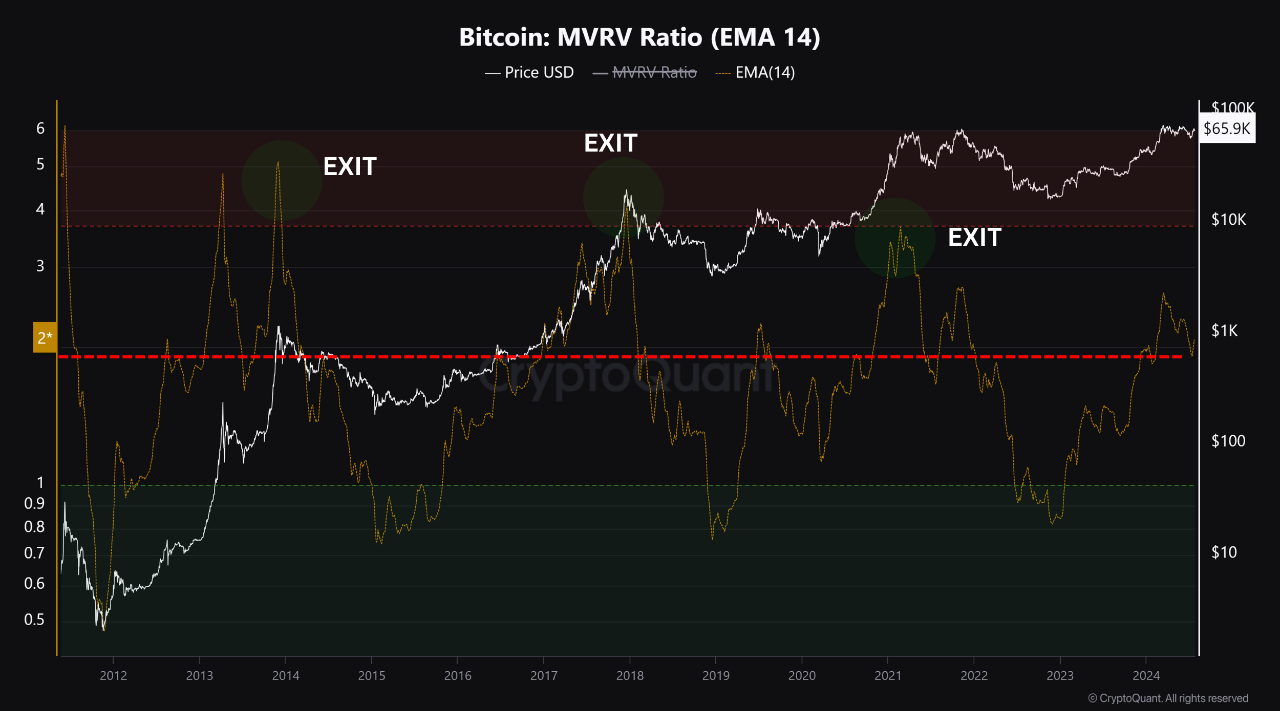
View original →By examining the MVRV indicator, widely recognized as one of the most accurate for long-term investors to determine price peaks and troughs, we observe that the indicator is starting to bounce from the critical level of 2.
This level typically marks the beginning of a period of price fluctuation before continuing its rise. According to this indicator, Bitcoin still has significant potential for growth before reaching its peak, which usually occurs when the MVRV reaches 4 or higher.
A safe exit strategy from the market should begin gradually when the MVRV is in the 3.7-3.8 range.
In summary, if you are a long-term investor, there is no need to monitor the price constantly. Bitcoin has not yet reached its peak according to current MVRV analysis.

View original →Has Bitcoin Reached a Distribution Zone or Are Current Prices Still Good for Buying?
Where is the market peak, and when is the best time to start exiting the market?
There is only one indicator that can be used to determine the best action for long-term investors in the current times
The MVRV (Market Value to Realized Value) indicator gives a highly accurate alert for Bitcoin price tops and bottoms.
‼️ Whenever the MVRV value is below 2, it indicates a continued accumulation zone, meaning the price is still below its true value.
When the indicator starts to exceed this value, it means we are on the path to achieving a new peak.
In previous cycles, peaks always occurred when this indicator reached a value of 3.5 or above. At these levels, we start exiting the market gradually as it indicates that a peak has been reached or is very close.
Currently, the MVRV value is at 2.3, which means there is still room for the price to rise significantly to reach Bitcoin's fair value.
Even if the price drops, it's a new opportunity to reinforce. Exiting should only start when the indicator approaches a value of 3.
This means we are still somewhat far from the peak, and the price will achieve a new high in this cycle, which could be above $100k.


View original →Bullish(Nuanced)BTC
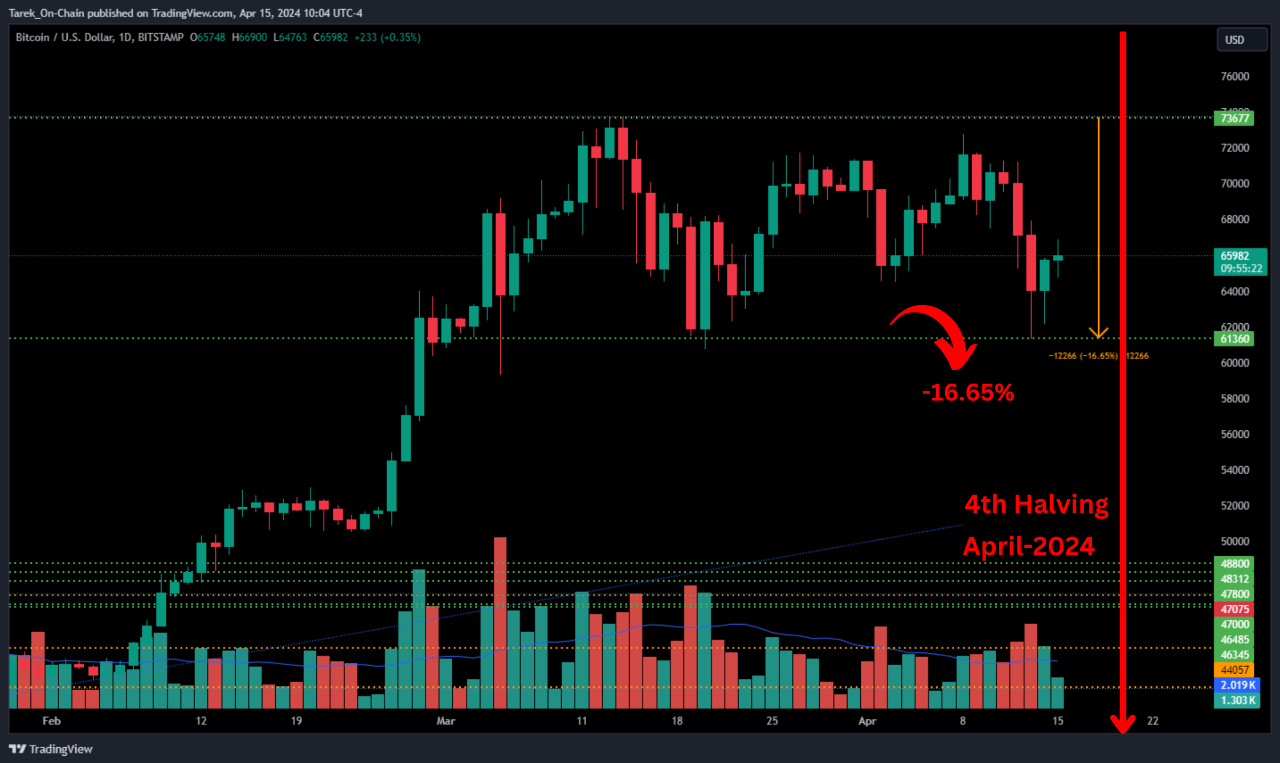
4/15/2024 With just a few days left until Bitcoin's fourth halving, recent days have seen a significant decline in Bitcoin's price, reaching a staggering 16.65%. This collapse has stirred considerable anxiety among investors and traders in the Crypto market.
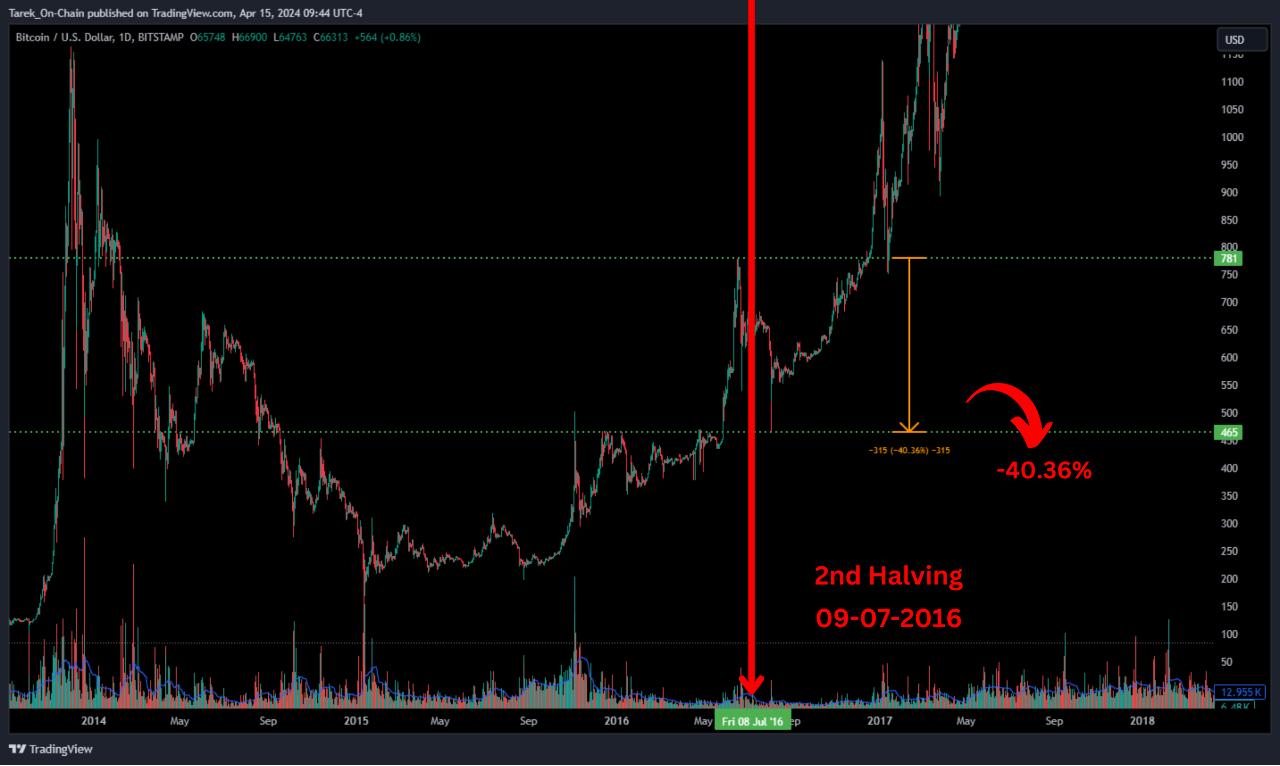
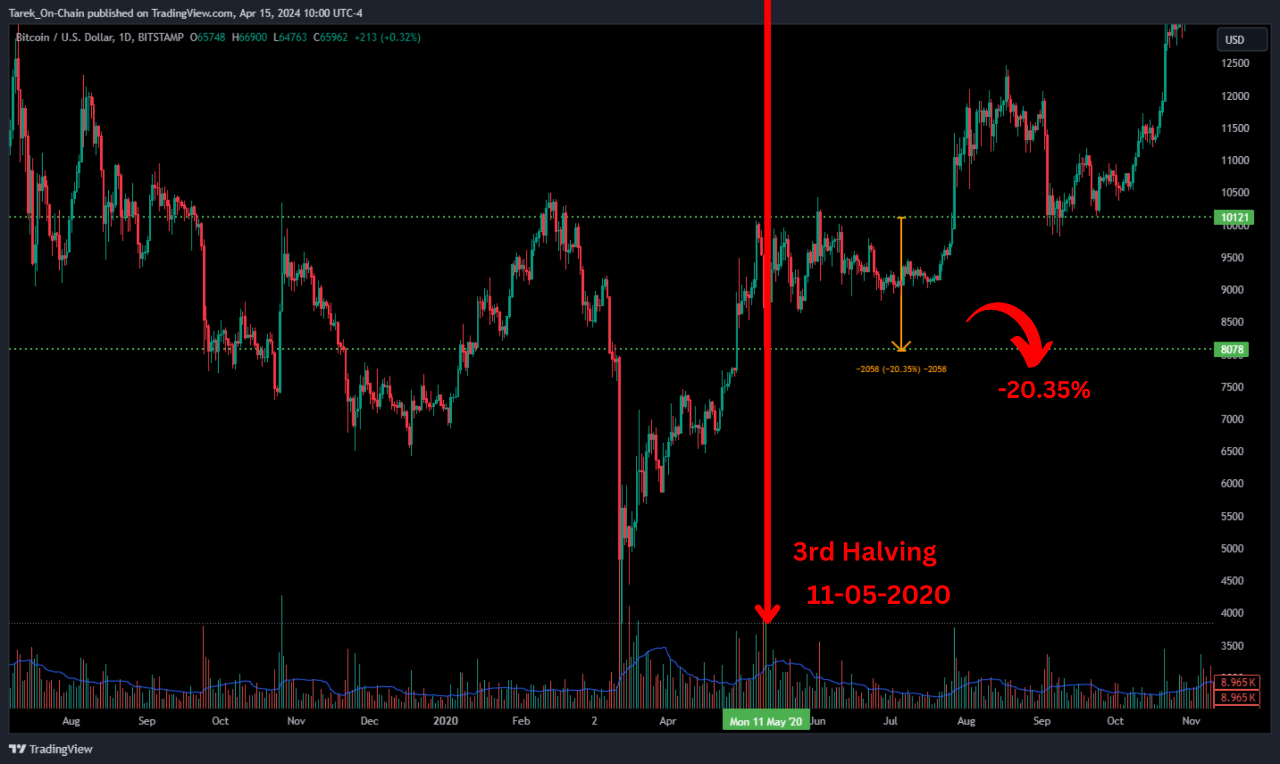
However, it's essential to recognize that before each halving cycle, there's typically a price collapse, a pattern we've highlighted numerous times in the past.
In the second halving, the price dropped by 40.36%, hitting $465 before soaring to a peak of $19,600. Similarly, in the third halving, there was a 20.35% decrease, reaching $8,078 before climbing to a peak of $69,000.
In the current cycle, the decrease thus far stands at 16.65%, a normal and anticipated occurrence. There's no need for alarm, as this scenario repeats consistently in each cycle, albeit with varying percentages.
The correct approach now is to enter the market gradually at previously identified strategic points. The path to the current cycle's peak remains open, and we are still at the beginning of this journey.

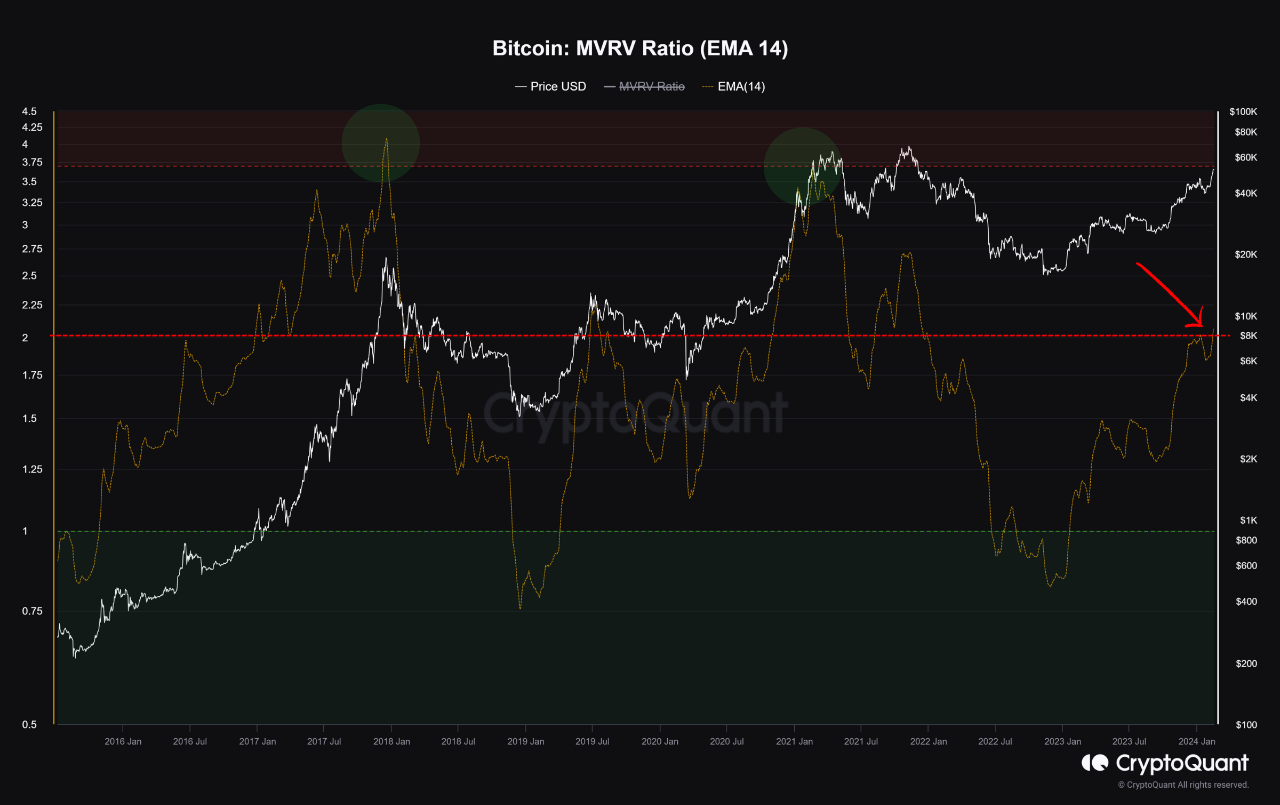
View original →In the realm of Bitcoin analysis, a fundamental indicator utilized to gauge the peaks and troughs of BTC's price within each market cycle is the MVRV ratio. This ratio, in essence, compares the market capitalization of Bitcoin to its realized value. A critical level for this indicator is 2, signifying the demarcation line between accumulation and distribution phases.
Historically, when the MVRV ratio approaches 3.7, it has consistently signaled that the price is nearing its peak. In the current cycle, the MVRV ratio has for the first time slightly surpassed the threshold level, reaching 2.06, indicating the commencement of a bullish market.
Despite this, the indicator still suggests a significant potential for price appreciation, potentially exceeding a value of 3 in the long term. However, this does not preclude the possibility of periodic price corrections on the path to reaching the peak.

View original →Bullish(Nuanced)BTC
1/25/2024 What heights might Bitcoin reach in the years 2024-2025? Will it set new records? When is the anticipated start of the next bull run?
To answer these, let's delve into the historical price patterns of Bitcoin, particularly around its halving events. Here's a breakdown:
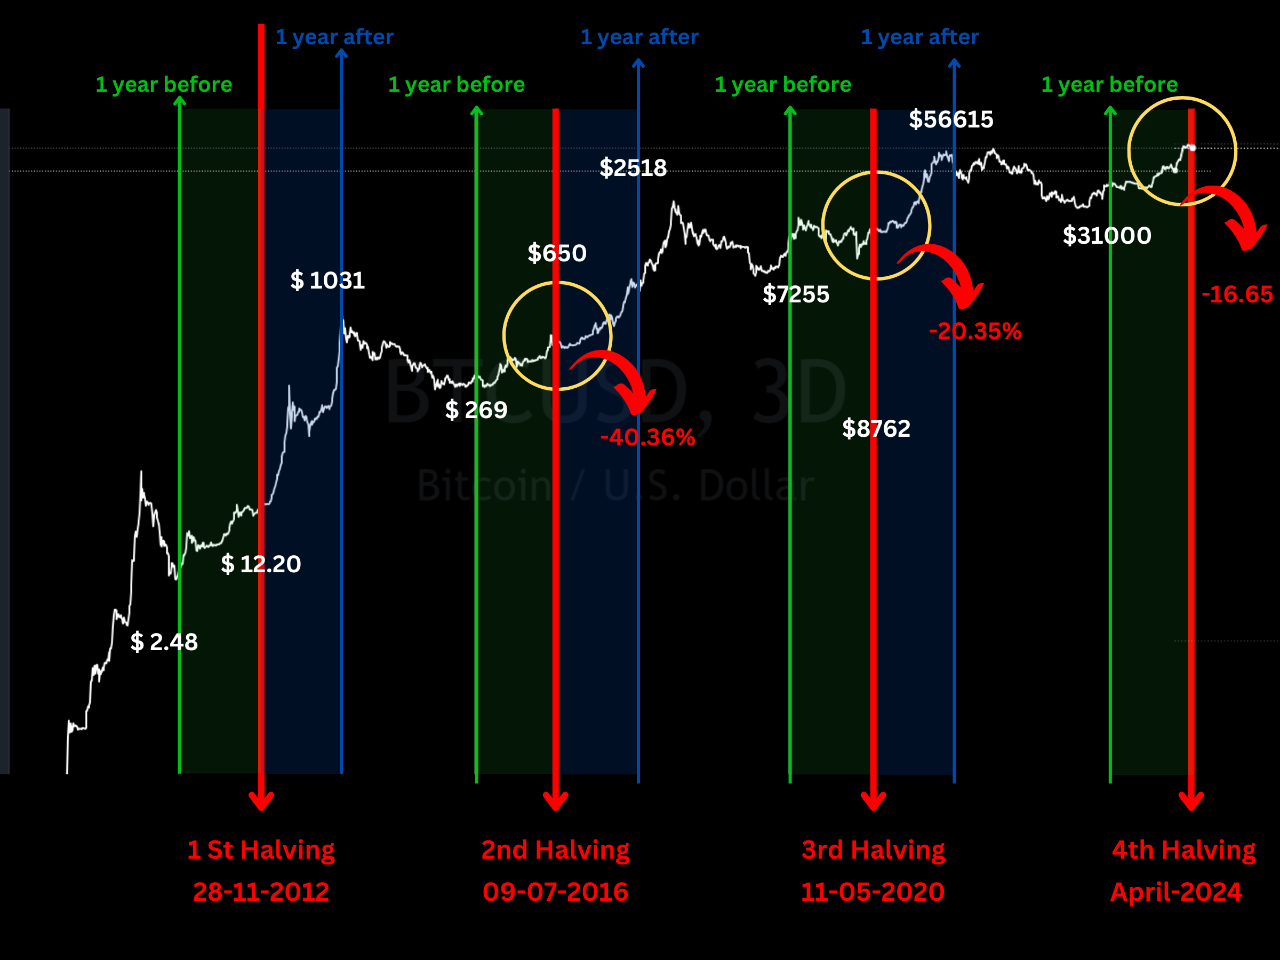
First Halving (28-11-2012): A year before this event, Bitcoin was modestly priced at $2.48. As the market turned bullish, it climbed to $12.20 at the halving and continued its ascent. A year later, it peaked at $1,131.
Second Halving: Before this halving, Bitcoin had fallen to $269 but rebounded to $650 by the time of the event. It soared for about a year post-halving, reaching an impressive $2,518.
Third Halving: The cycle repeated, with Bitcoin dropping to $7,255 before the third halving. It then modestly rose to $8,762 at the halving and significantly surged to $56,615 a year after.
The fourth halving is expected in April this year in the current cycle. A year before this date (April 2023), Bitcoin had an uptick to $31,000. This suggests a strong likelihood of a substantial rise post the fourth halving, potentially lasting till April-August 2025 and surpassing the previous high of $69,000.
Key Takeaway: Bitcoin's price behavior shows remarkable consistency around each halving. It gradually begins to rise a year before the halving and continues for 12-16 months post-halving, reaching new peaks before entering a bearish phase.
For long-term investors, these patterns are crucial. The peak for this cycle might be between April - August 2025. It would be strategic to start exiting the market gradually at this point.


View original →Bullish(Nuanced)BTC
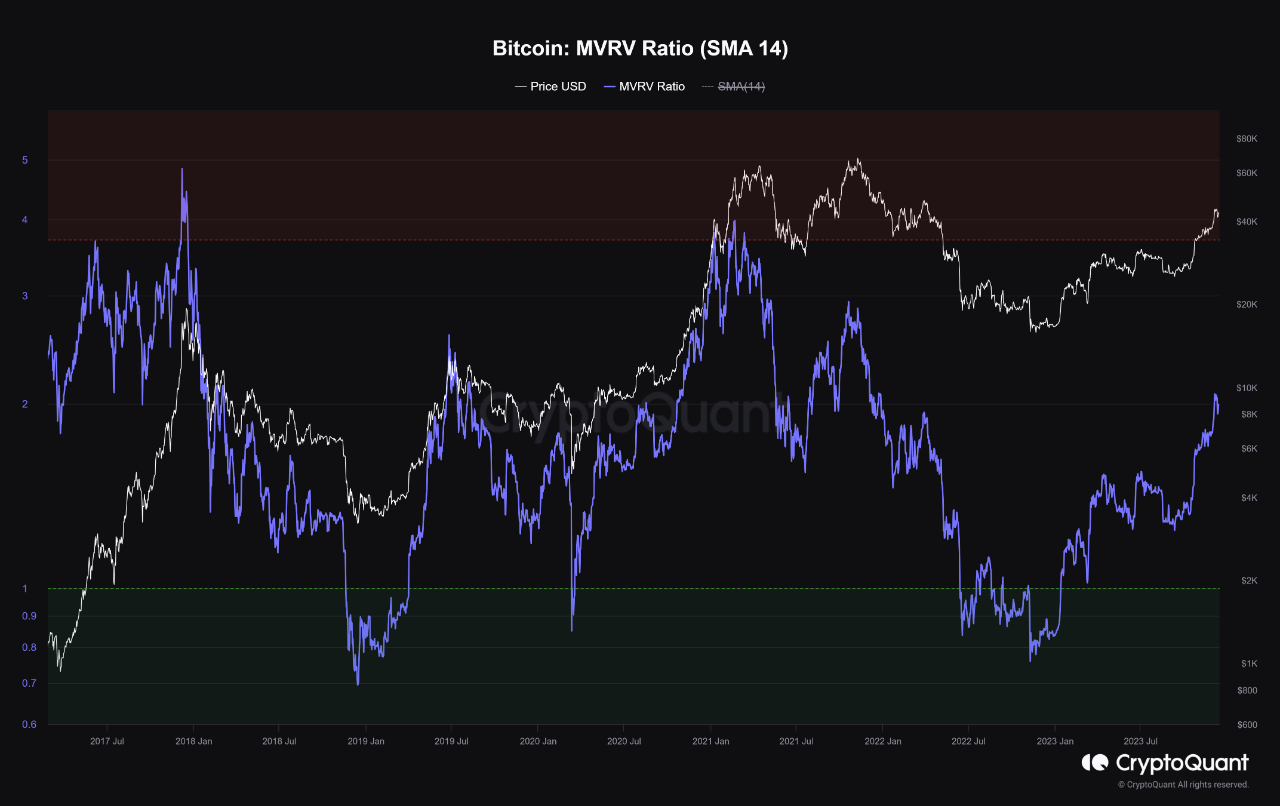
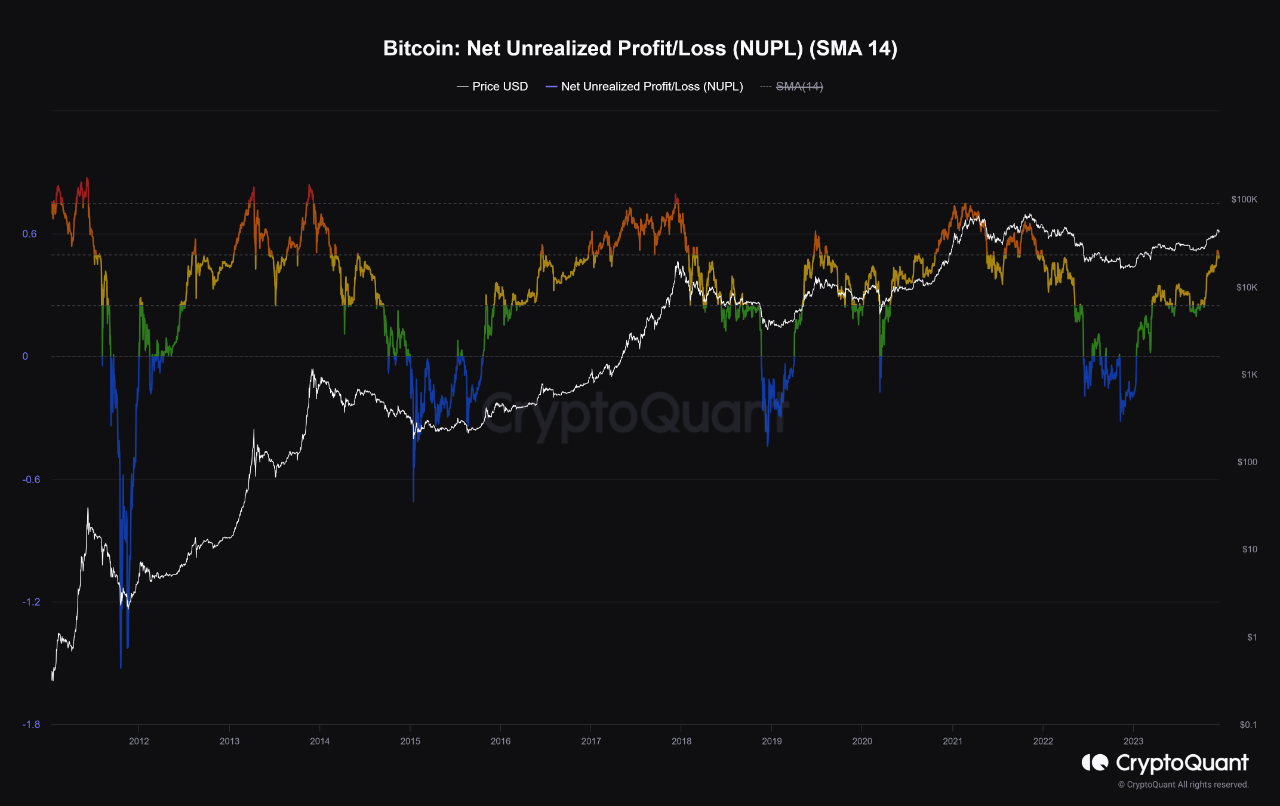
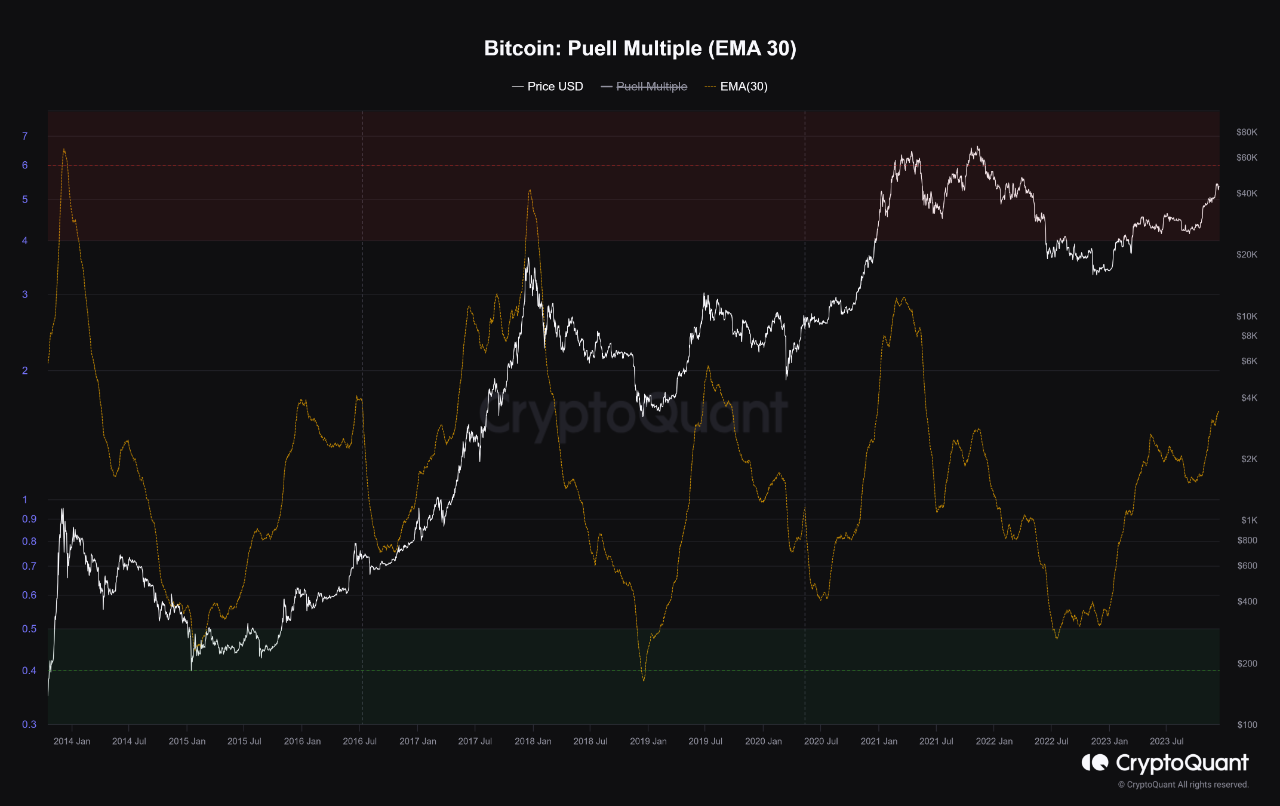
12/14/2023 Does the bear market for Bitcoin finally seem to be concluding? Are we on the cusp of entering a new bull cycle? To answer these pivotal questions, we'll delve into an analysis using three crucial indicators: Net Unrealized Profit/Loss (NUPL), MVRV Ratio, and Puell Multiple.
These indicators are instrumental in deciphering Bitcoin's market cycles and currently point towards interesting developments in the cryptocurrency's trajectory.
Net Unrealized Profit/Loss (NUPL):
NUPL is a measure of the market's profit or loss state.
A rising NUPL, moving from neutral to 'greed,' indicates an increasingly profitable market, often correlating with bullish sentiment.
The current trajectory of NUPL suggests an uplift in market optimism, which is a typical precursor to a bull market.
MVRV Ratio:
The MVRV Ratio compares Bitcoin's market cap to its realized cap.
A low MVRV ratio often indicates an undervalued state, common in bear markets.
The recent upward movement in the MVRV ratio from these lower levels may signal that the market is transitioning from undervaluation to a phase where growth is anticipated, hinting at the start of a bull cycle.
Puell Multiple:
This metric relates the daily issuance value of Bitcoin in USD to its 365-day moving average. Historically, lower values of the Puell Multiple have indicated market bottoms, suggesting optimal buying points and potential for an upcoming bull run.
A gradual increase in this multiple from its lower levels can be interpreted as a reduction in selling pressure and increased profitability for miners, aligning with the potential onset of a bull cycle.
In conclusion, the current readings of NUPL, MVRV Ratio, and Puell Multiple collectively imply that the bear market for Bitcoin may be subsiding, making way for the early stages of a bull cycle.
However, It's important to remember that corrections in the price are always possible, and other economic factors, can significantly influence market behavior.

View original →

