


Bullish
BTC
1/21/20262024-2025 marks the LARGEST long-term Bitcoin supply release in history—coins dormant 2+ years flooding market. This isn't 2017 or 2021: older coins moving with less market noise signals structural...
View original →Sentiment timeline shows relative sentiment within this analyst's history. A perma-bull showing 8 bullish : 2 bearish in a bear market sets that as their baseline. If you notice any errors, claim @kripto_mevsimi to submit corrections.
2024-2025 marks the LARGEST long-term Bitcoin supply release in history—coins dormant 2+ years flooding market. This isn't 2017 or 2021: older coins moving with less market noise signals structural...
View original →ETH accumulator cost basis sits at $2.7K-$2.8K—a level that held through 2018, 2020, 2022 crashes. Long-term holders never capitulated while altcoins collapsed without any floor. Hold above this...
View original →Zcash futures markets are showing a sudden and intense surge in retail trading frequency, a pattern historically associated with short-term speculative peaks rather than sustainable accumulation phases. As the chart reveals, periods marked in deep red (“Too Many Retail”) often coincide with local price tops or overheated mini-rallies. The latest cluster — by far the largest since 2021 — suggests an unusual retail-driven activity spike, with trading frequencies significantly detached from ZEC’s organic demand structure. This dynamic typically reflects late-stage speculative inflows, where smaller traders pile into futures during rapid upside moves, while larger participants reduce exposure or hedge. The scale of this recent red zone is particularly striking: retail participation is at its highest level in over three years, even though the price remains far below previous cycle highs. Unless accompanied by matching spot inflows or institutional demand, such patterns tend to fade quickly, leading to sharp volatility resets. In short: Zcash may be experiencing a speculative echo, not the beginning of a new trend. Watch the frequency of retail bursts rather than the price itself. In low-liquidity altcoins, behavioral surges often tell the story before the chart does. 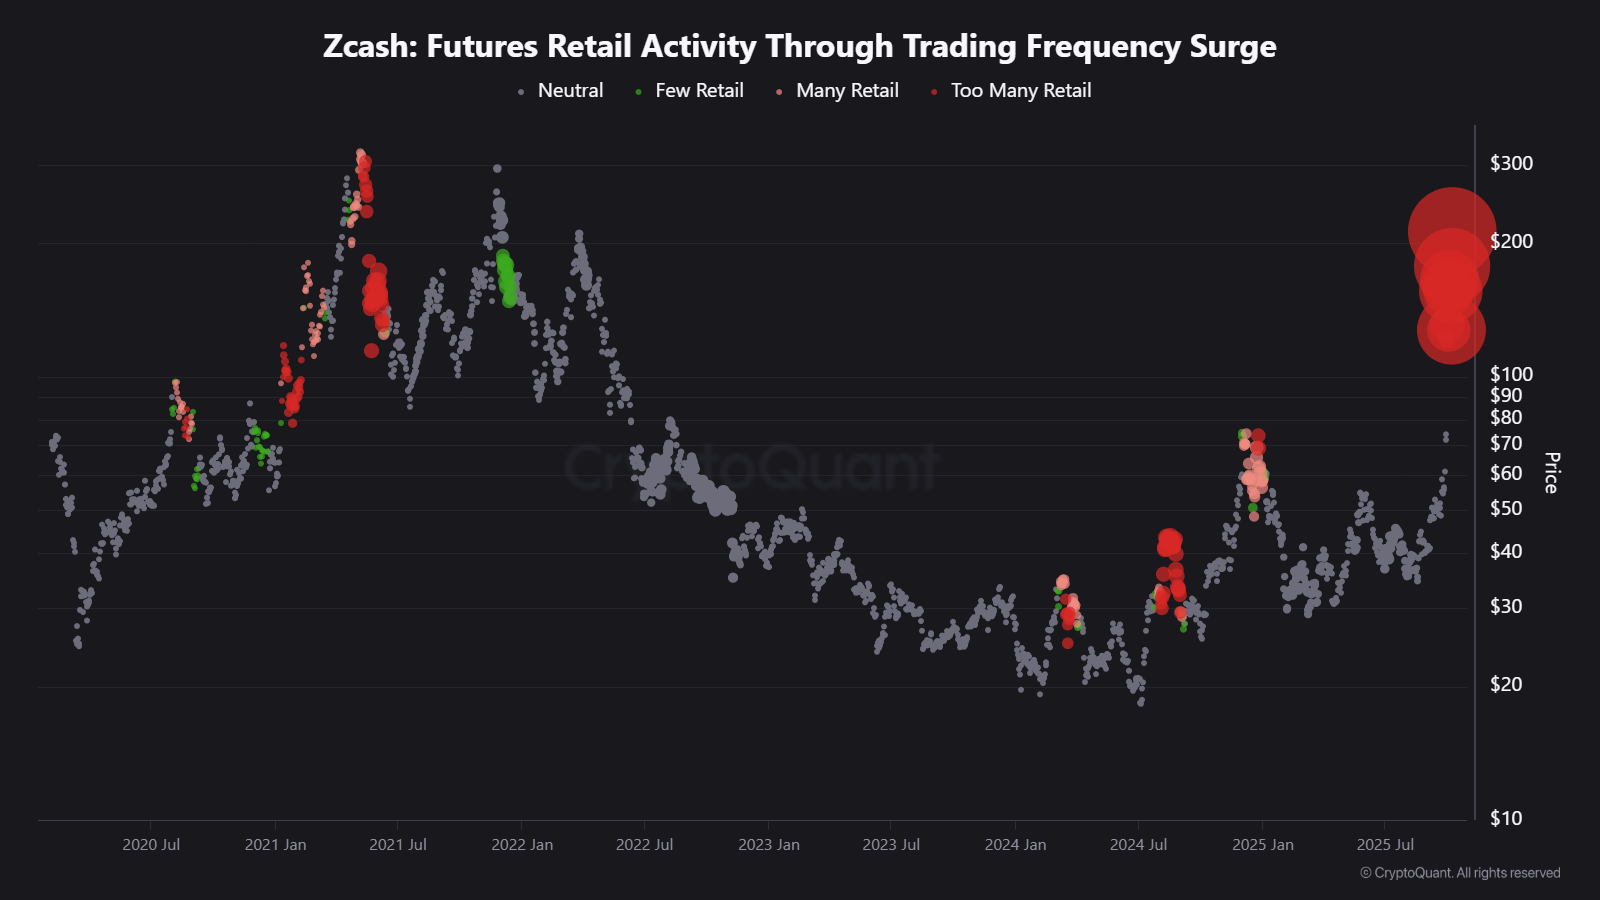 
View original →As I noted in my previous analysis : https://cryptoquant.com/quicktake/68a2dc15b244141e108456e6-For-the-First-Time-Since-January-Bitcoins-Short-Term-Holders-Are-Back-to-Selling Now we need to analyze current situation and what happened between these dates... Since then, that stress has deepened: through September, STH-SOPR fell as low as 0.992, marking a period where speculative wallets continued to sell at a loss. Now, by the end of September, the metric has recovered slightly to 0.995 — still below August’s 0.998 reading, but showing signs of stabilization after the trough. This comes as BTC trades around $114K–115K, right under a heavy resistance zone. Historically, such resets have carried two possible outcomes: 🟥 Weakening Momentum → Extended loss realization can precede corrective phases where weak hands capitulate. 🟩 Healthy Reset → Quick absorption of realized losses often clears the path for more sustainable rallies. With BTC consolidating under resistance, this rebound in STH-SOPR is a key barometer of market health. If buyers continue to absorb weak-hand selling, it could mirror past resets that paved the way for the next leg higher. 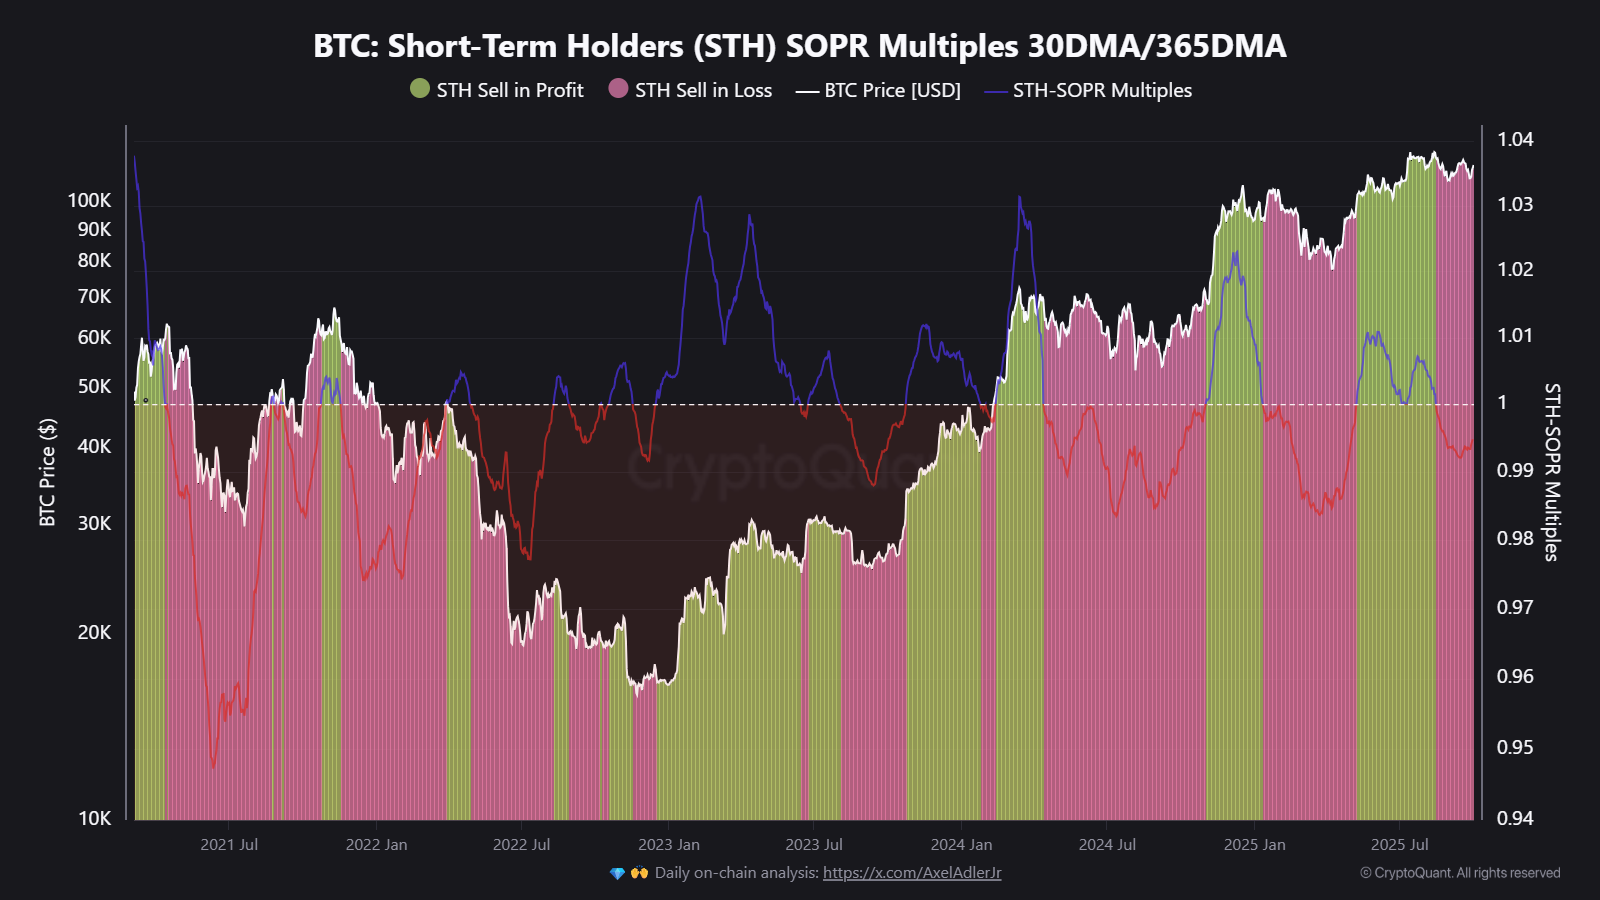 
View original →Bitcoin’s short-term holders (STHs) last moved into sustained loss realization during January 2025, a period that marked the deepest correction of this cycle. Since then, the market has largely recovered, with STHs consistently selling in profit as BTC advanced toward the six-figure zone. Now, for the first time since that January drawdown, STH-SOPR multiples have slipped back below 1, indicating that short-term investors are once again realizing losses. Historically, this shift has carried two possible implications: 🟥 Weakening Momentum → Extended loss realization often precedes corrective phases where speculative holders exit. 🟩 Healthy Reset → Brief dips below 1 can flush out weak hands, clearing the path for more sustainable rallies. With Bitcoin consolidating under heavy resistance, this loss-selling event becomes a critical barometer of market health. If absorbed quickly, it could mirror past resets that fueled strong rebounds. If not, it risks signaling a momentum breakdown. 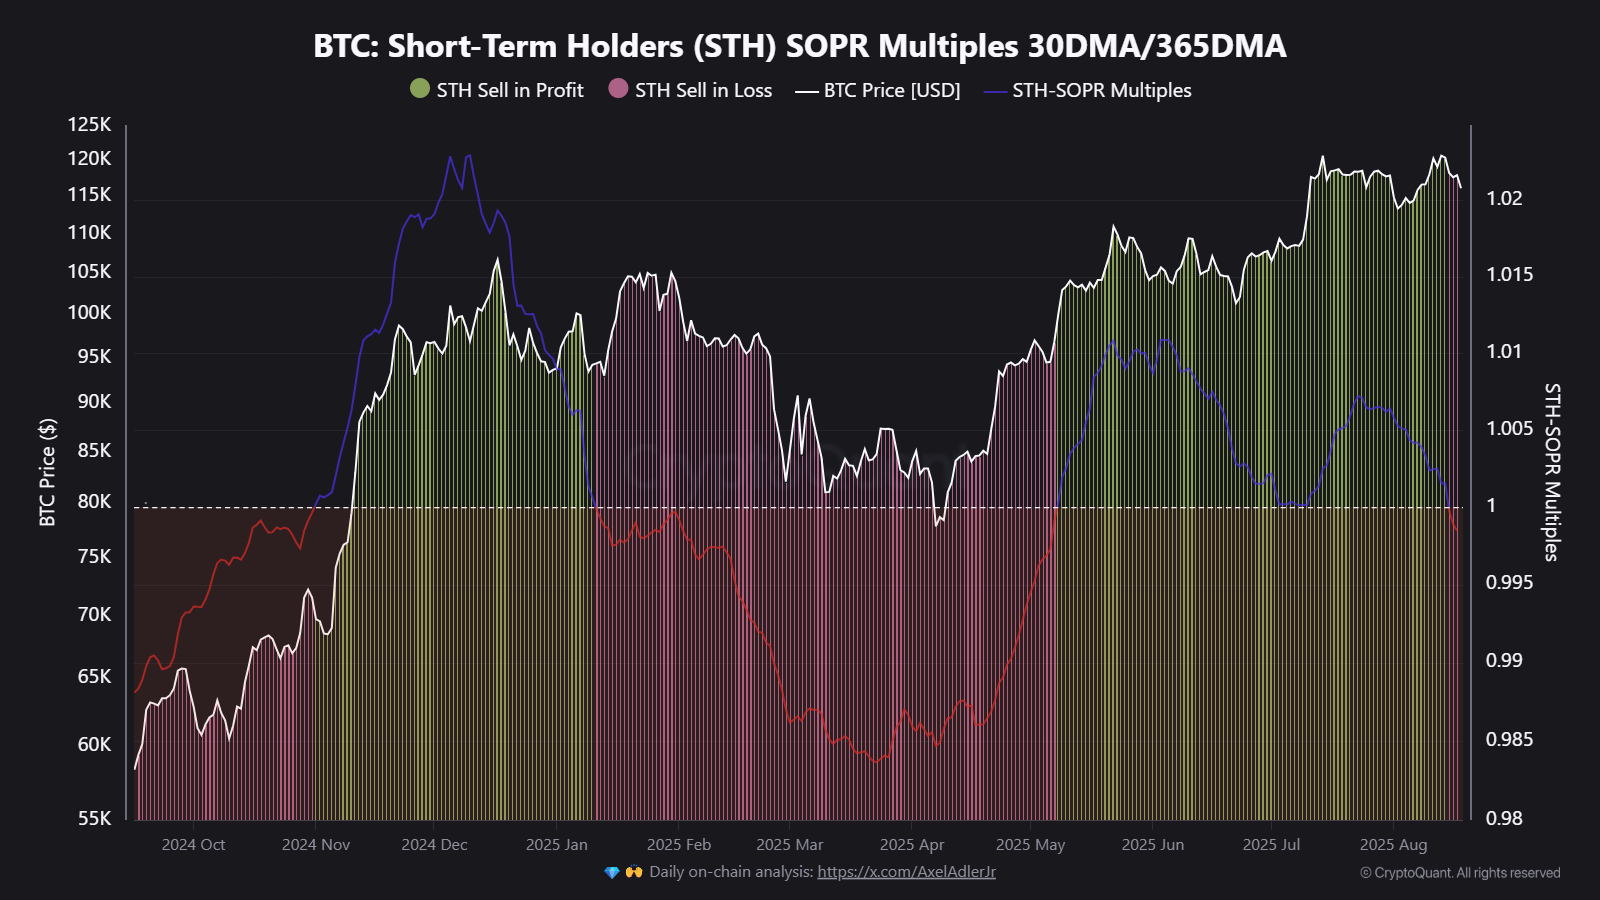 
View original →Bitcoin remains range-bound near $115,000, projecting surface-level calm. But realized price data suggests this balance may be fragile. Long-term holders — the “old whales” — have stopped actively realizing gains, while newer whales who entered over the past year are still in profit, but only slightly. This tension between patient old capital and recently exposed new capital may not last much longer. From 2022 through 2024, old whales steadily realized profits, as seen in their rising realized cap. This quiet distribution coincided with mid-cycle conditions. But since early 2025, their realized cap has flattened, signaling a pause. Their average cost basis, around $39,400, places them deep in profit — likely awaiting higher levels before resuming activity. Meanwhile, newer whales, including likely institutional entrants, now hold a realized price around $105,300. This has become their psychological breakeven. So long as BTC trades above it, they remain comfortable. But if price breaks below, risk-off behavior may accelerate — from profit-taking to panic selling and leverage unwinds. Adding to the fragility is low recent activity from both groups. Old whales are idle. New whales are exposed. Neither is pressing the market — yet. But once the range breaks, the reaction could be sharp. Realized prices are drawing the true battle lines. Above $105K, new capital holds. Below it, the floor weakens. On the other side, a surge toward $130K may tempt old whales back into the game. 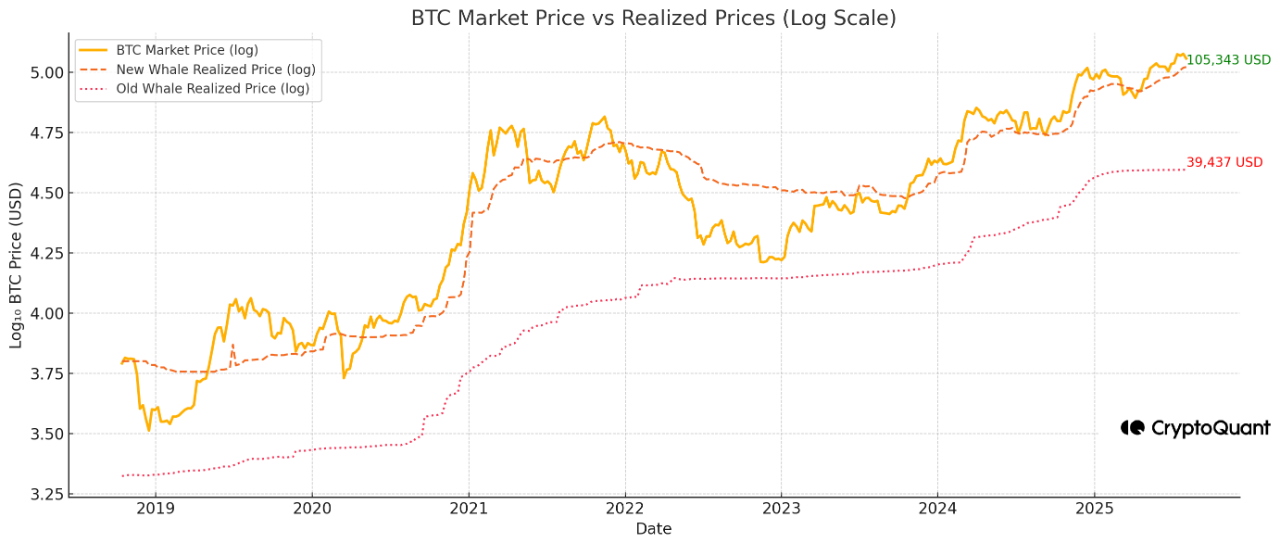 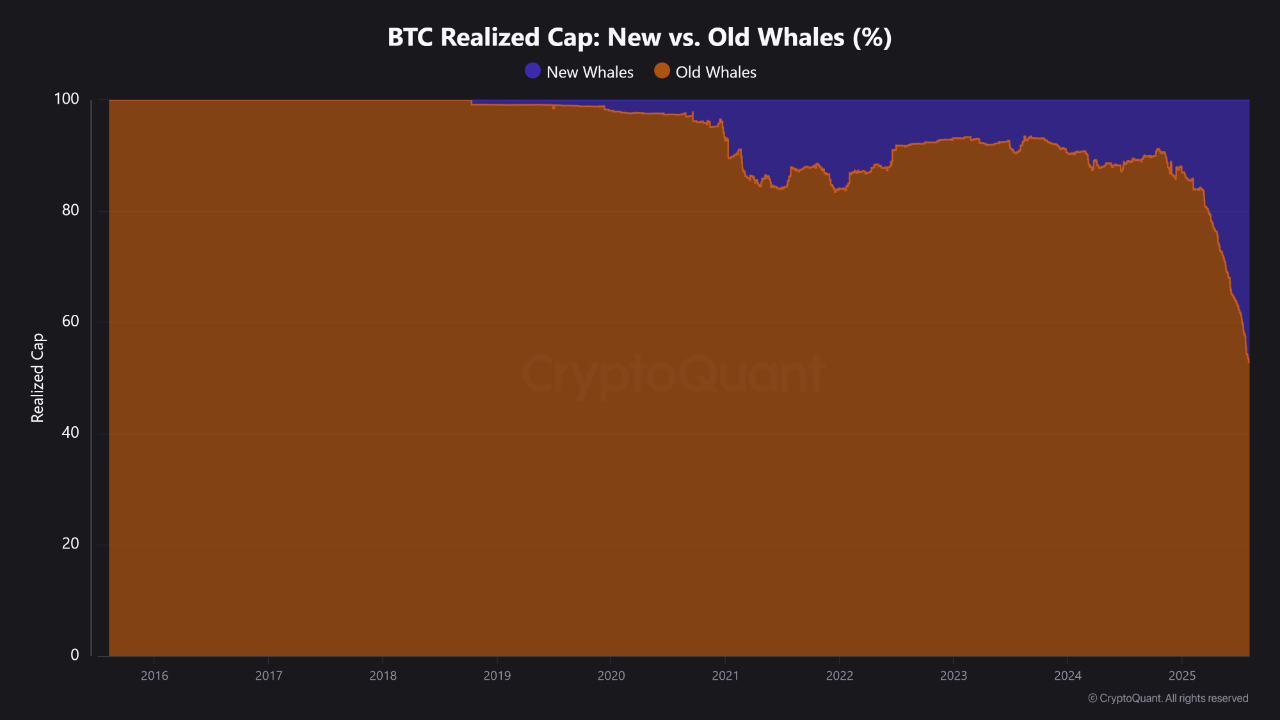 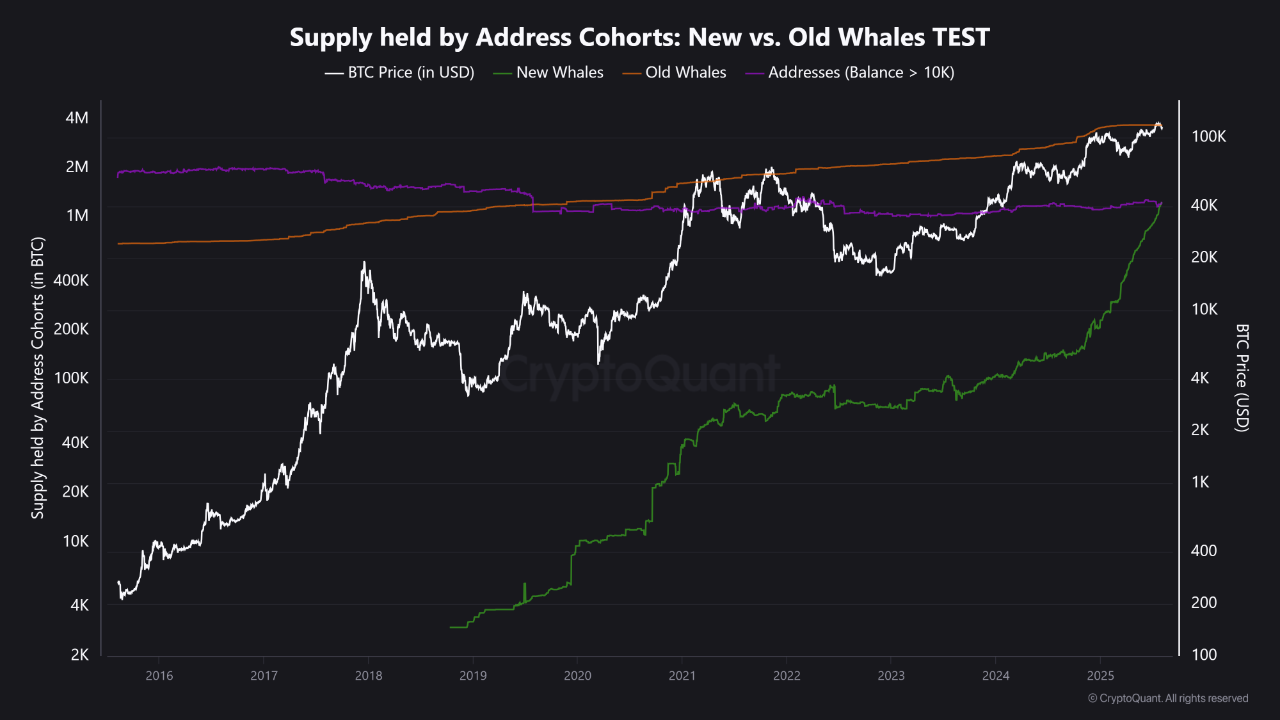 
View original →Bitcoin’s underlying on-chain activity has turned increasingly dynamic in mid-July 2025. Two key metrics — Coin Days Destroyed (CDD) and Net Realized Profit and Loss (NRPL) — now signal renewed movement from both long-term holders and recent participants. In the past week, CDD has climbed sharply, reaching 28M levels. This signals that older BTC, dormant for extended periods, has started moving again. Historically, CDD spikes suggest strategic shifts: large holders either redistributing supply or repositioning portfolios. Often, such activity emerges near cycle midpoints or local tops. At the same time, NRPL surged, crossing $4B in realized profits — the highest since early Q2. Such large-scale profit-taking reflects that whales and recent buyers are actively locking in gains, yet BTC’s price has remained stable near $117K–$120K. This lack of sharp correction amid heavy realized profits could indicate resilient underlying demand or delayed reaction. Interestingly, this current wave differs from late June. Back then, NRPL showed a mix of realized losses and modest profits — suggesting capitulation from late buyers while older holders quietly accumulated. Today, the narrative flips: profits dominate, while older coins flow. Structurally, this activity coincides with Q3’s institutional rebalancing phase, hinting that recent moves are deliberate, not noise. Historically, spikes in both NRPL and CDD have preceded volatility: local tops, consolidations, or even mid-cycle pauses. Now, both metrics signal coordinated activity from larger players — a potential setup for a market pivot. Whether this results in distribution or further rally depends on follow-through. But for now, whales are active, profits are taken, and long-dormant supply is in motion. The market stands at a possible inflection point — hidden beneath stable price action. 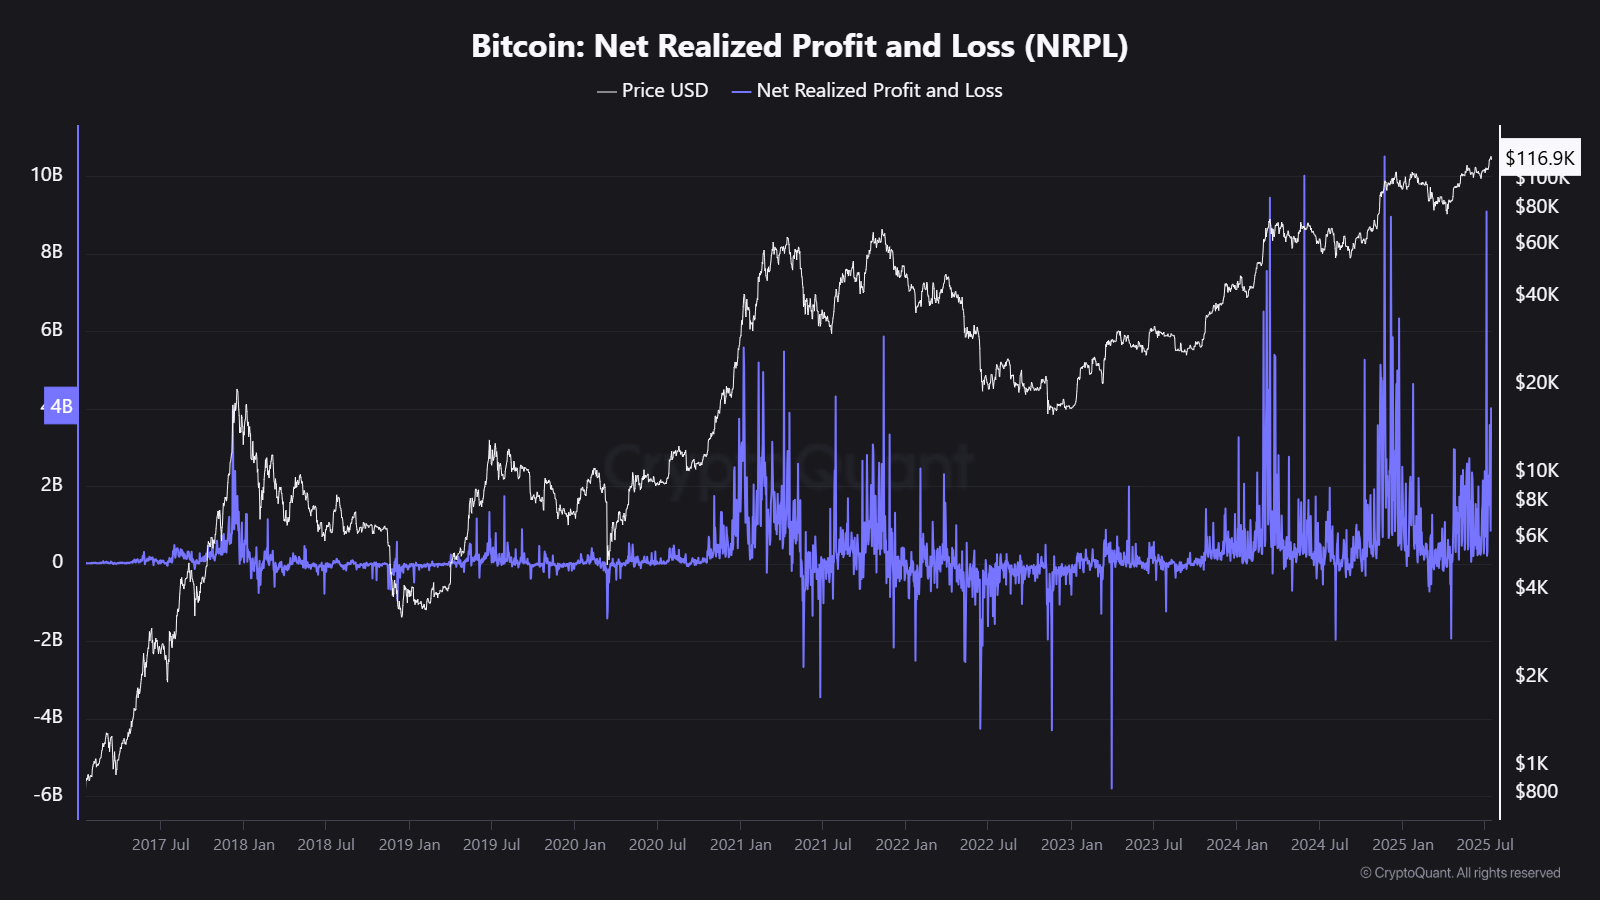 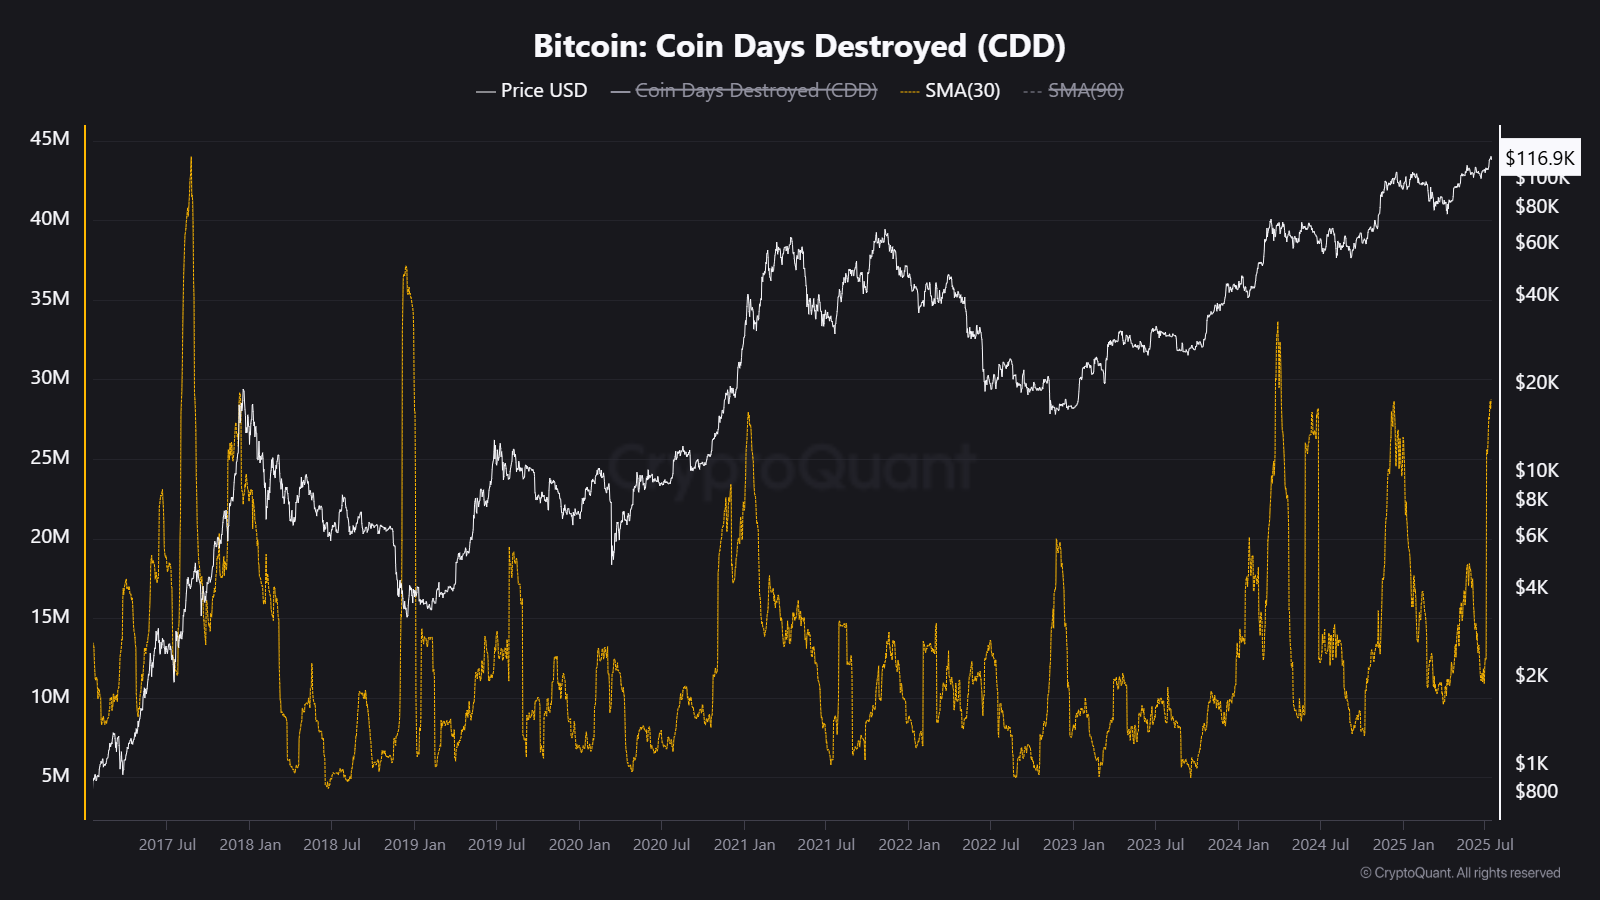 
View original →The final week of June revealed intense, mixed behavior from large Bitcoin holders. New whales realized over $641M in profits and over $1.24B in losses — a rare combination that signals a major internal shift. While some late entrants capitulated, others locked in profits, possibly those who accumulated earlier in Q2. Meanwhile, old whales took $91M in profits, with only minimal realized losses. This convergence of profit-taking and capitulation may have marked a local exhaustion point. Interestingly, such activity did not continue into early July, suggesting temporary balance or a potential turning point. Structurally, late June is also the end of H1, when ETFs and institutional funds often rebalance portfolios. That timing adds weight: this wasn't just noise — it may have been a deliberate repositioning. Historically, sharp spikes in realized losses — especially from short-term players — often occur near local bottoms. While no signal is absolute, the alignment of behavior and timing here is worth watching closely. For now, June’s closing week stands out — not for price action alone, but for what it revealed about underlying flows.  
View original →BlackRock’s spot Bitcoin ETF (IBIT) now holds over 636,000 BTC, more than 2x the combined holdings of all other U.S. spot ETFs. This marks a dramatic consolidation of institutional demand under a single issuer — and may be redefining market structure. Since spot ETFs were approved in early 2024, IBIT has outpaced all competitors in both inflows and BTC accumulation. While legacy funds like Grayscale (GBTC) experience persistent outflows, IBIT’s aggressive growth suggests it is becoming the de facto institutional gateway to Bitcoin. In just a few months, BlackRock has effectively captured the majority share of the ETF-driven BTC market. With IBIT emerging as the dominant ETF: Allocators may feel “safer” piling into the biggest name, reinforcing its dominance. Smaller ETF issuers are losing visibility and relative liquidity, possibly leading to future fund closures or consolidations. This dynamic may foster systemic dependency on a single institutional gatekeeper for BTC access. Historical Parallel: Tech Markets This kind of winner-takes-most behavior is reminiscent of Big Tech consolidation — where network effects and trust drive capital to a few giants. The result? Market share centralization. IBIT isn’t just winning — it’s redefining the playing field. If current trends continue, Bitcoin’s institutional narrative may become synonymous with BlackRock. Is this institutional trust — or a quiet monopoly in the making? 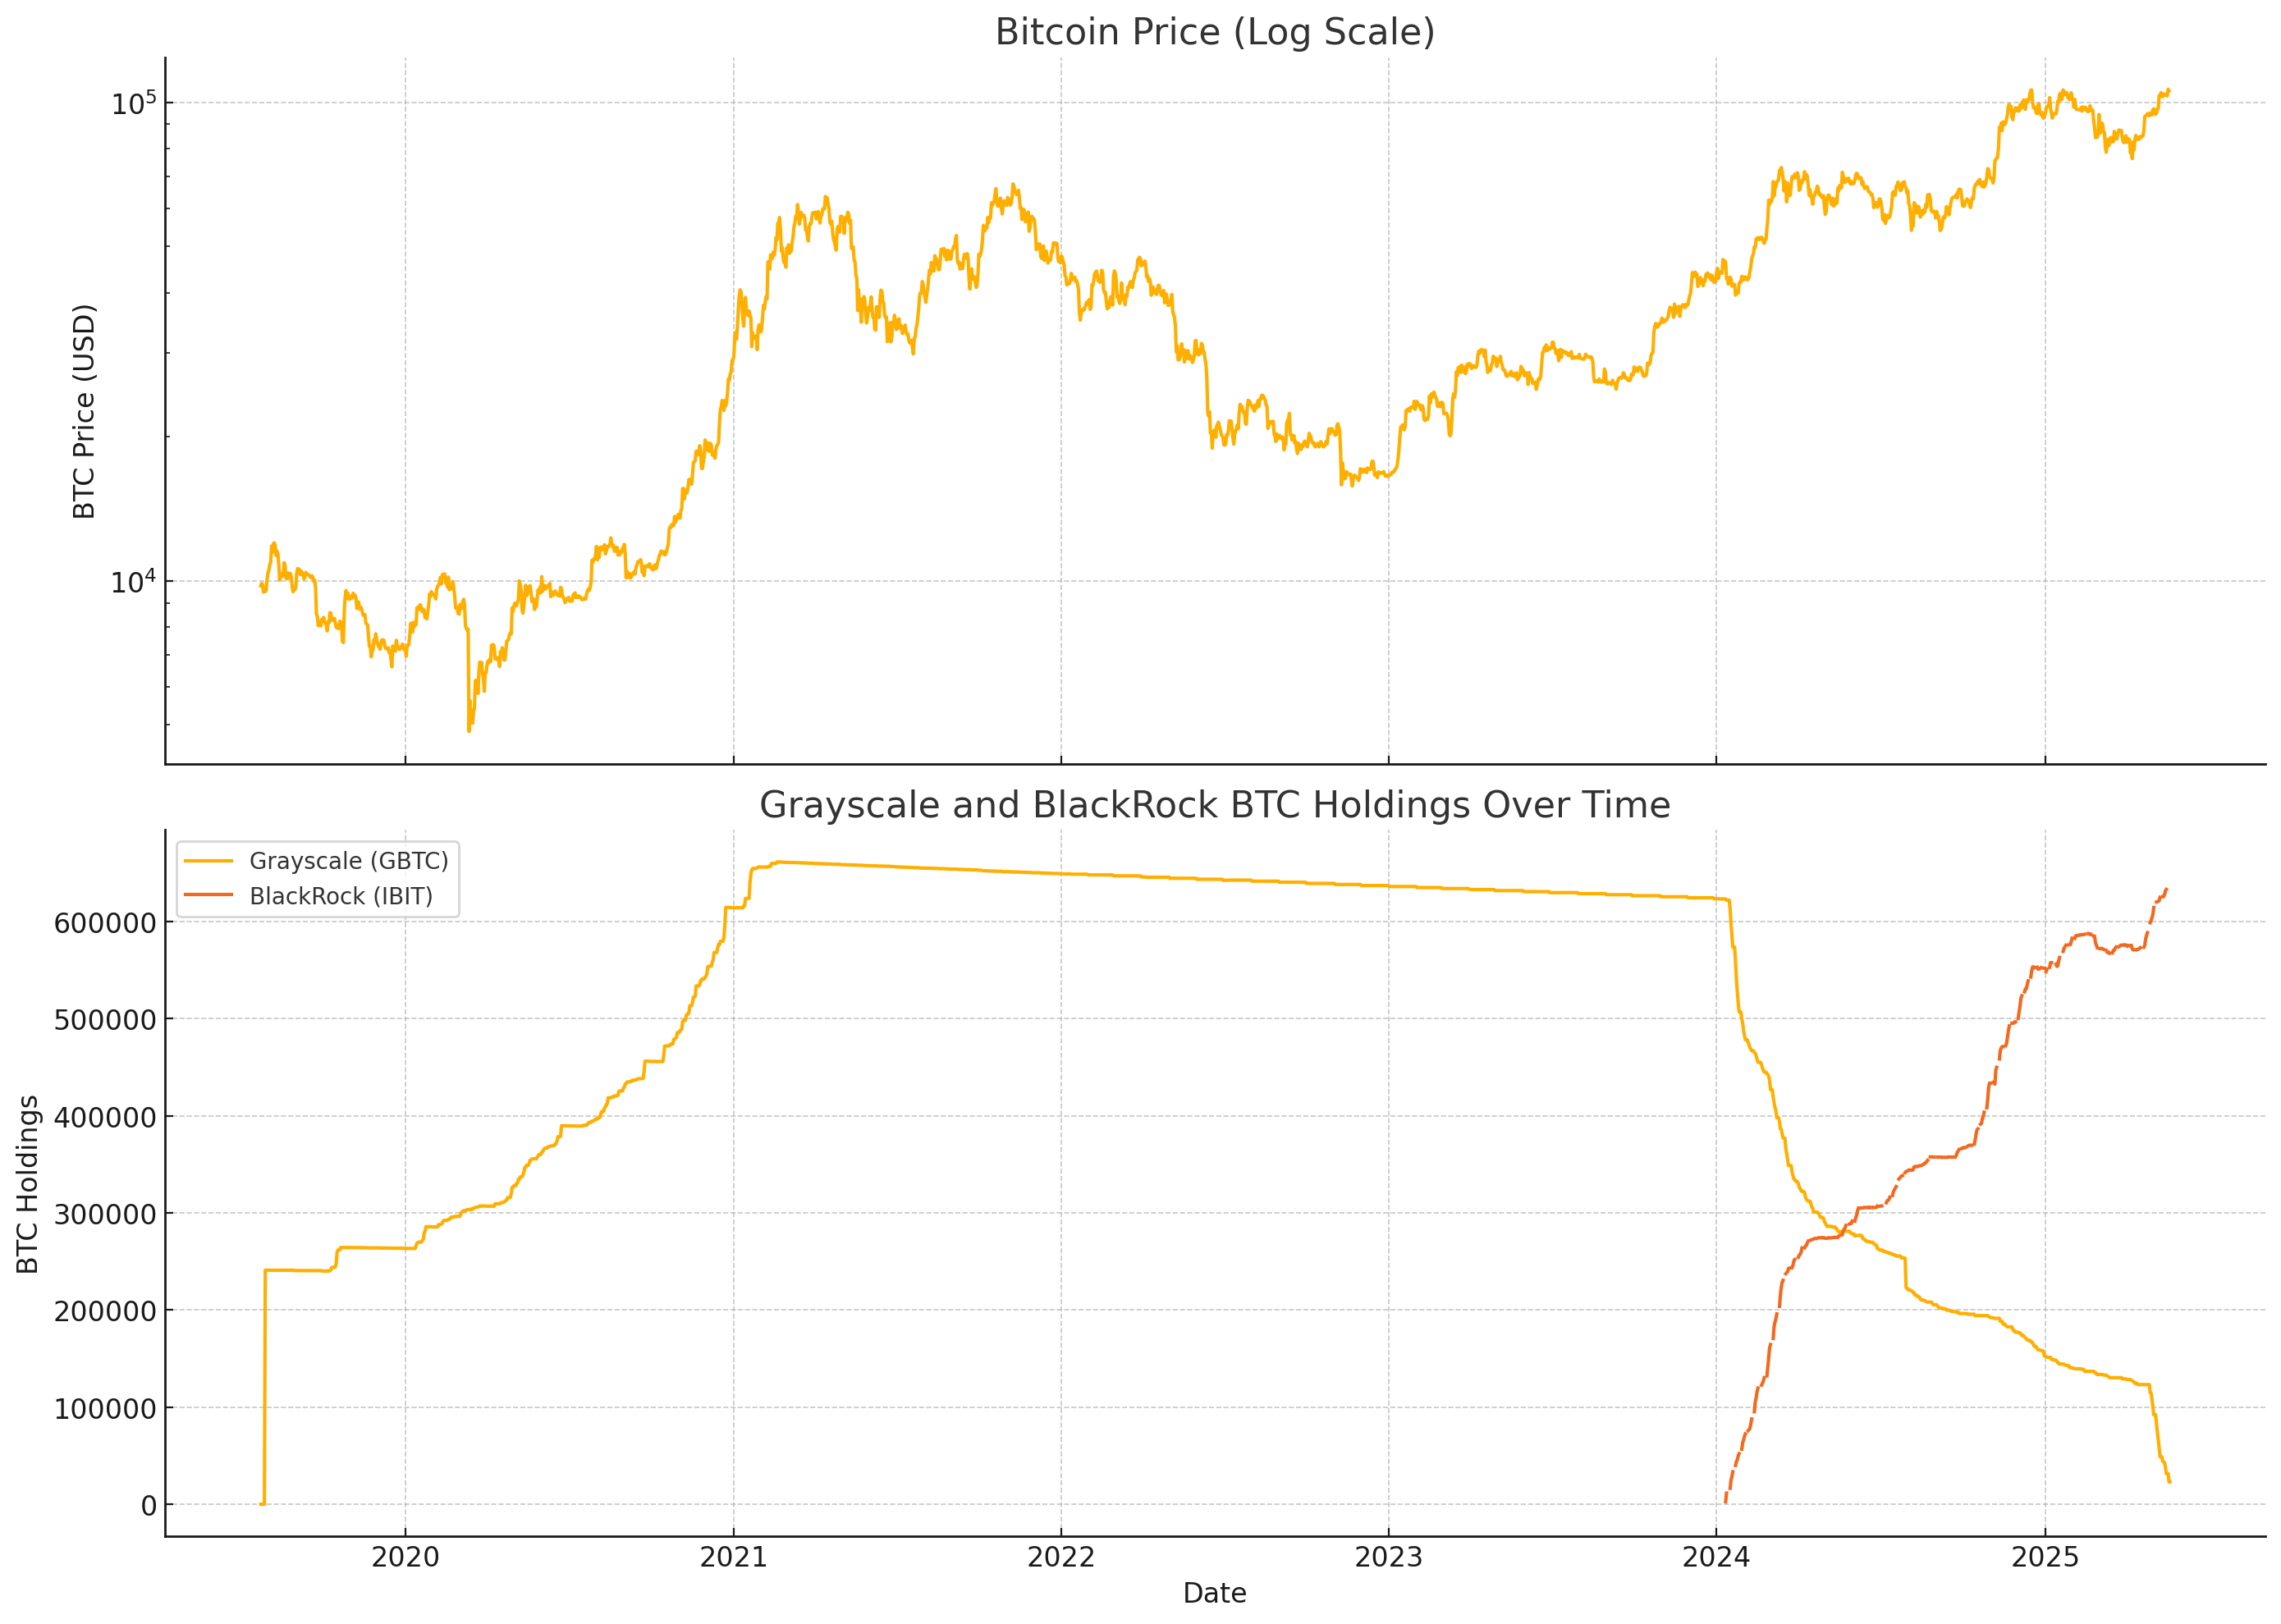 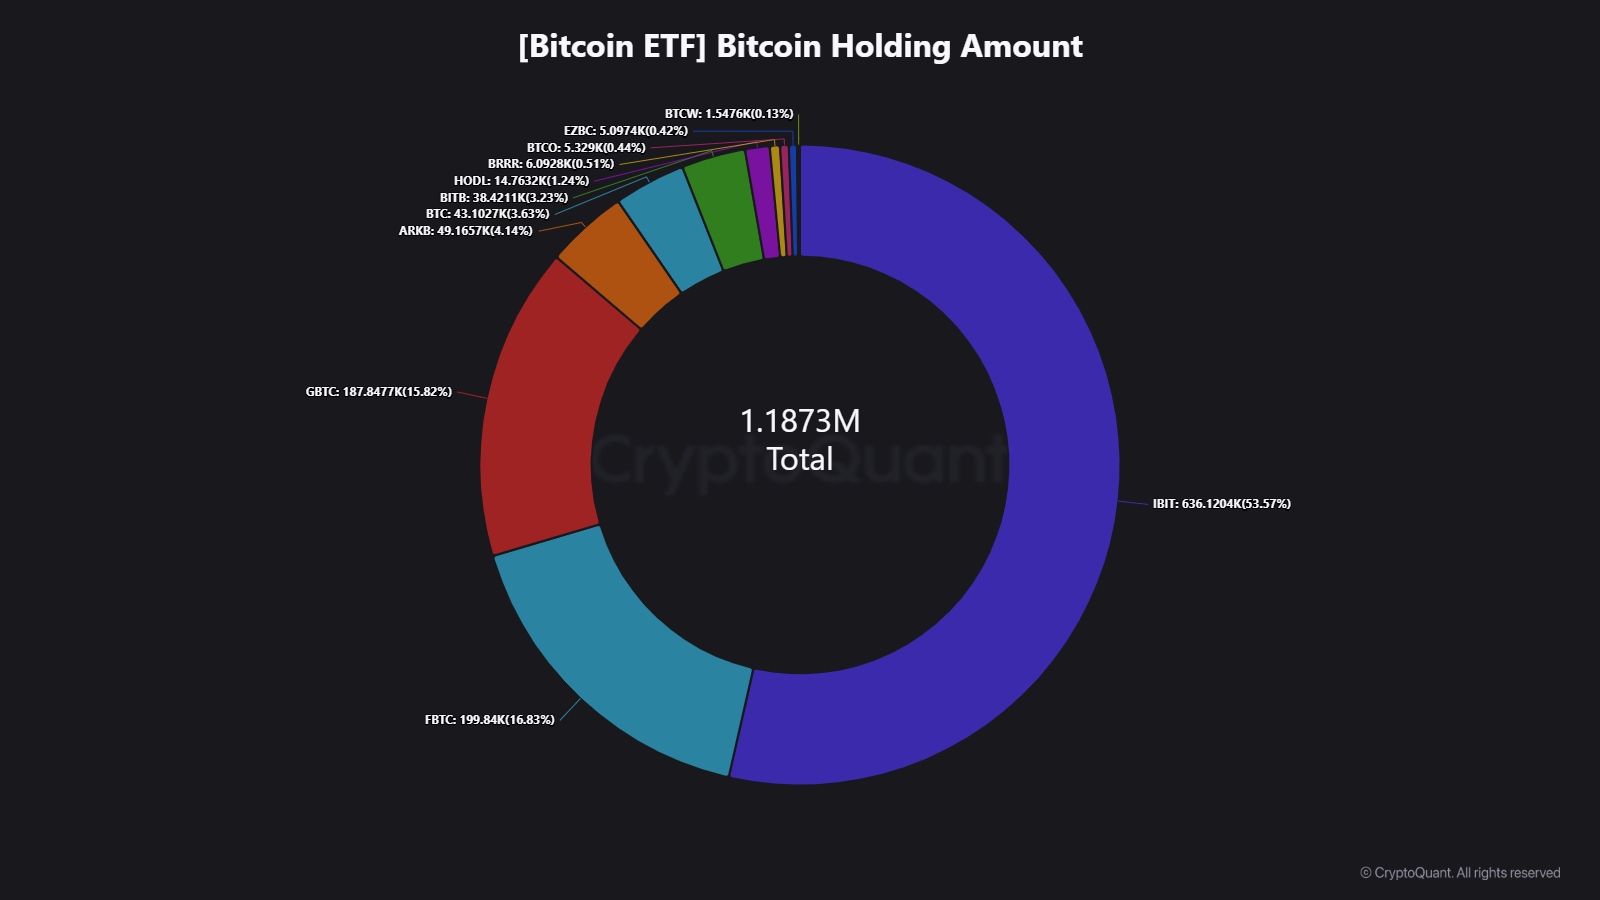 
View original →After months of relentless whale outflows, XRP’s negative flow trend is finally losing steam — and may be on the verge of flipping positive. Early 2025, whale wallets unloaded aggressively pushing the net flows deep into negative territory. But now? The pace of outflows is slowing, and the bars are curling upward. It’s not full reversal yet — but it’s the first real sign of stabilization in months. - Whale flow reversals often precede sustainable recoveries. - This shift may offer early signal of a base-building phase. - Combined with resilient price, this flow inflection is worth watching closely. Key Triggers to Watch: - 30DMA flipping green for the first time in months - Fresh inflows from previously inactive whale wallets - Price confirming breakout above recent resistance 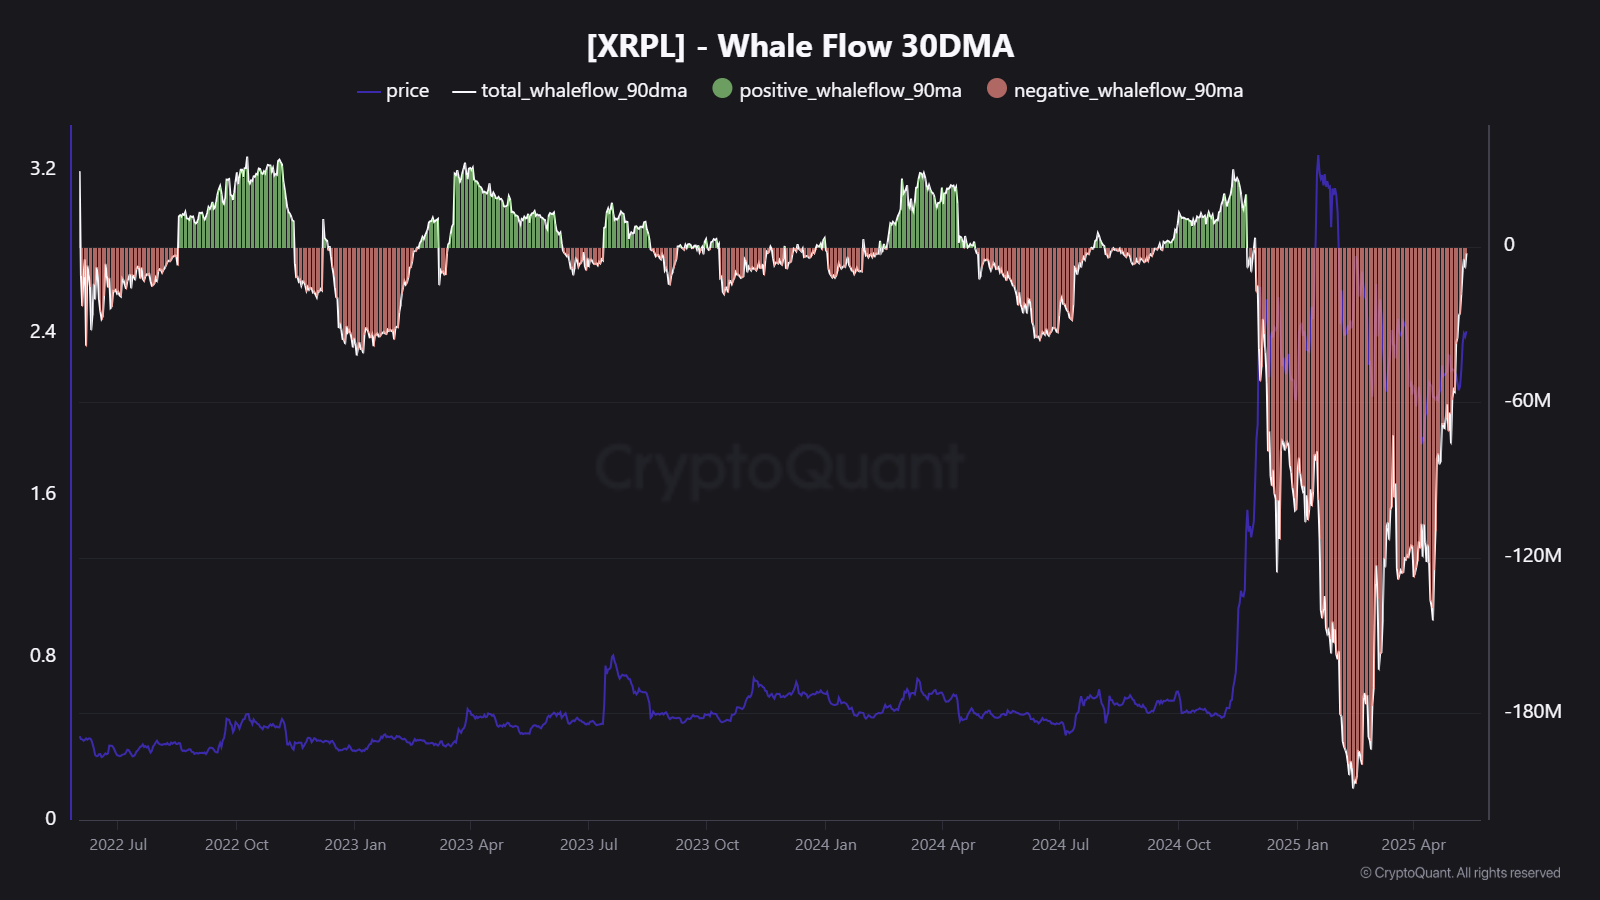 
View original →