Hi there, would like to share what I have observed from the market recently.
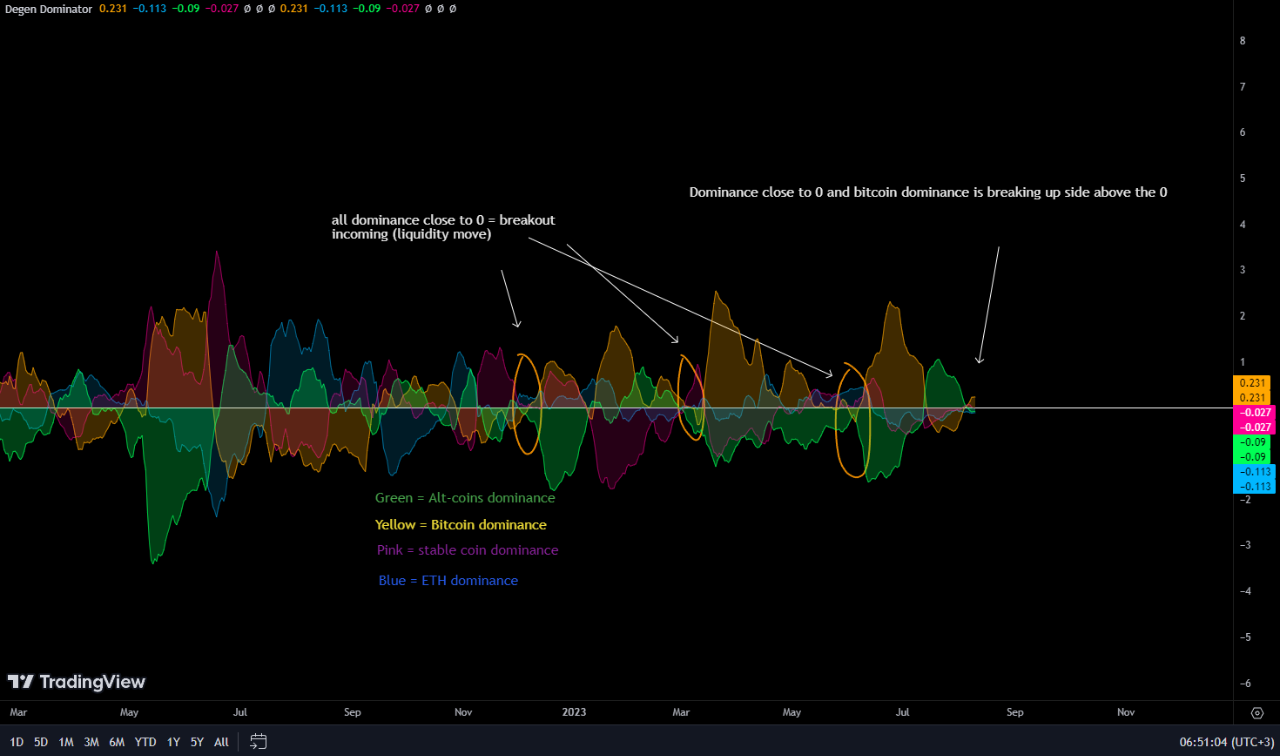
Dominance Ratio chart shows dominance for bitcoin, ETH, stable coin and Altcoins are all close to 0. historically this case resulted in a quick breakout in BTC price and caused a lot of liquidity. As of now it seems like that bitcoin dominance is breaking above the 0 and stable coin dominance is going below 0. if this moves continues to happen for the next 3 - 4 days it is most likely that bitcoin will move to the upside.
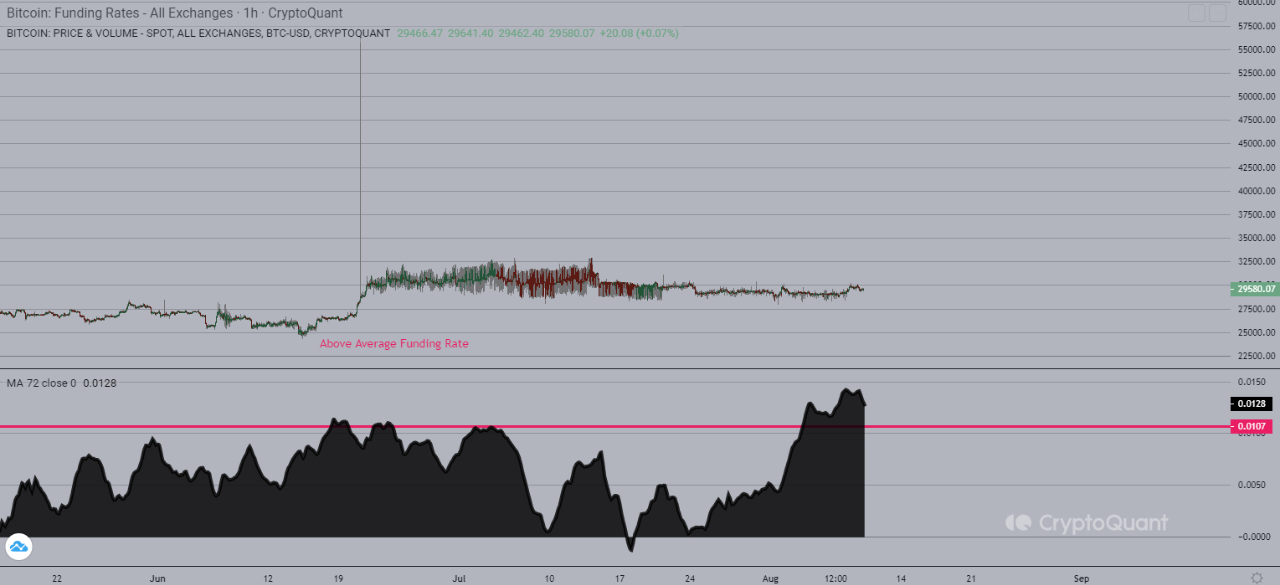
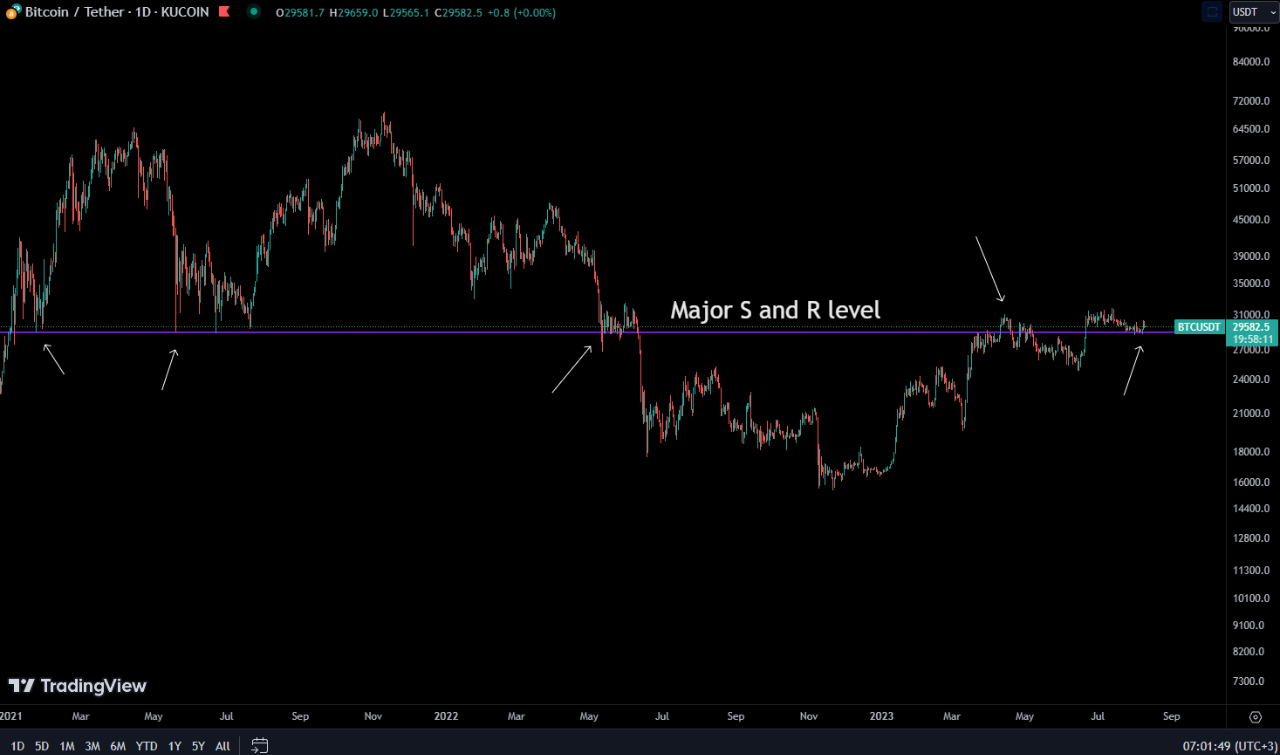
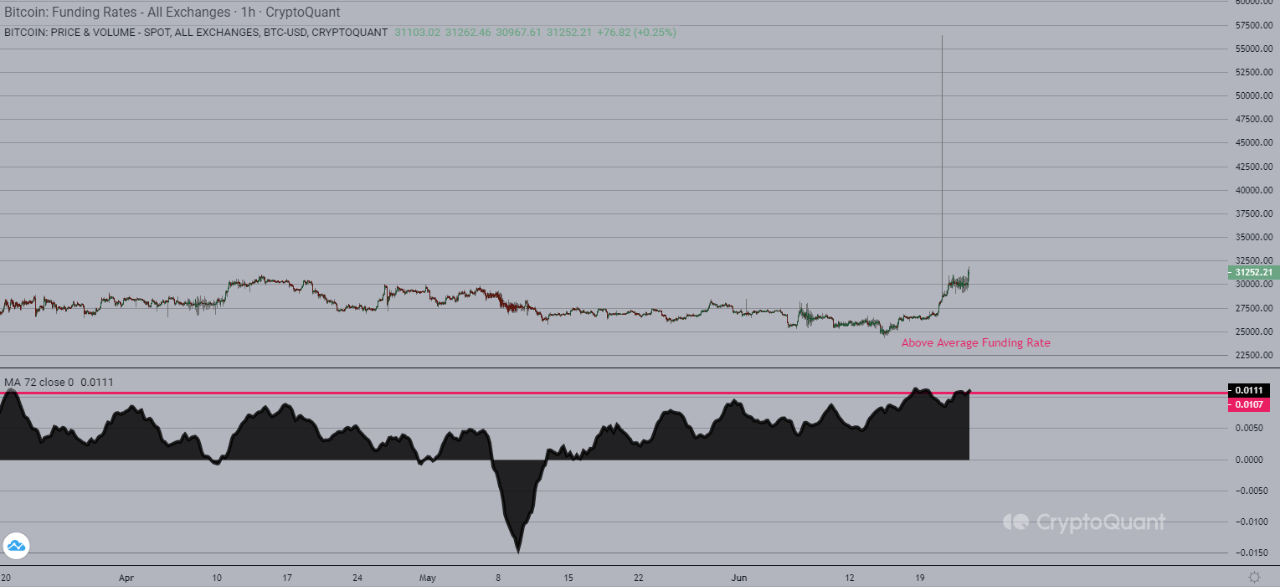
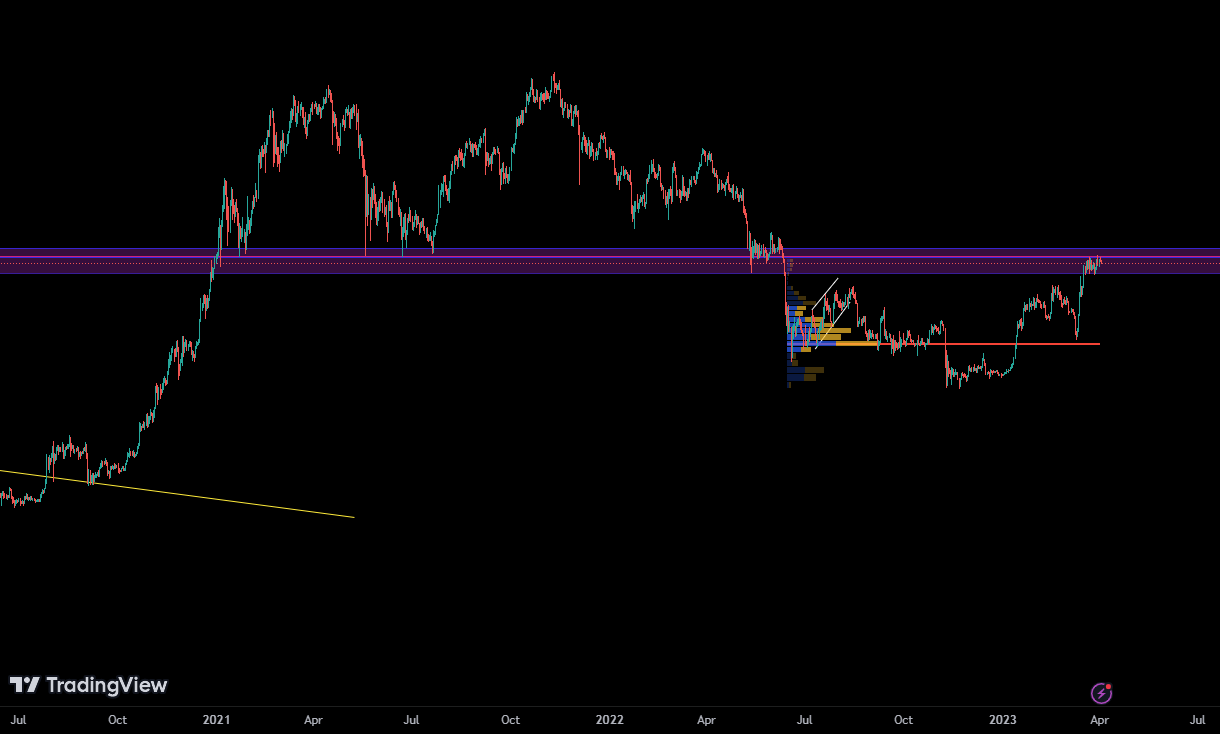
Funding rate is above average and bitcoin price is at a Major support and resistance level which you can see from the image below.
Advice
- keep an eye on bitcoin dominance chart
- watch closely the UTXO realised price age bands
- watch for the major support and Resistance level chart
If bitcoin dominance is up and stable coin dominance is down = bitcoin going up
if stable coin dominance is up and bitcoin dominance down = bitcoin going down
if bitcoin dominance down Alt-coins dominance up = alt coins up
Personally based on technical and on chain and cyclical price will go up over the next few weeks however I'm certain before every up move there is going to be a very short liquidity move for just 2-3 days before going up as leverage ratio is high, open interest are high and funding rate is positive. so place your stop lose carefully.

View original →Hi There,
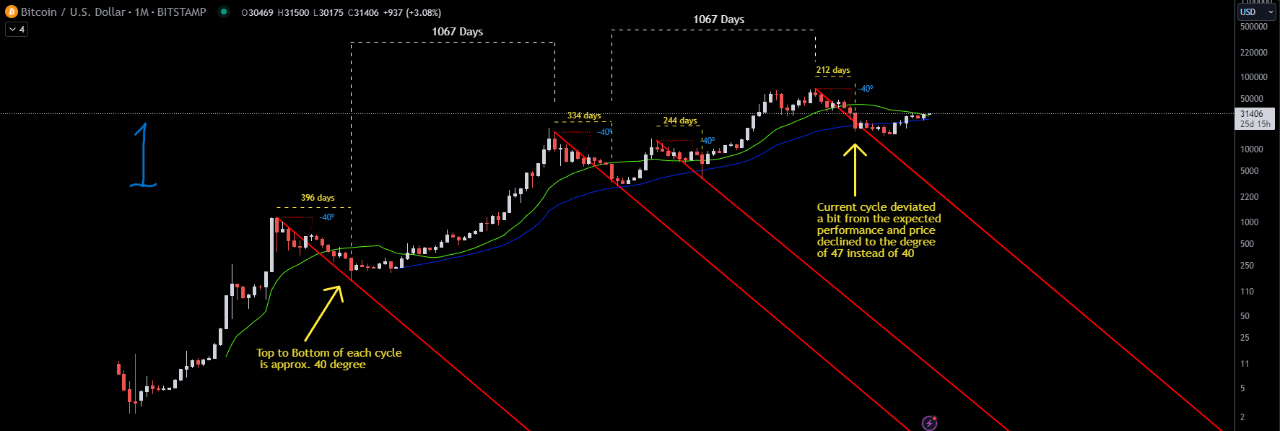
Recently I have been monitoring the BTC price using cyclical and mathematical approach and I found few interesting things that I would like to show.
Image 1;
It is observed that the declining degree from the top to the bottom foe the 2nd and 3rd cycles were exactly (-40 degree), however it is quite interesting to mention that even the mini correction before the last bull market correction was found to be at (-40 degree). if you measure the days period from the 1st candle that touches the (-40 degree) red line to the top of each bull run you will notice that the periods are identical (1067 days) which is not a coincidence. However, the last bear market crash exceeded the expected bottom and declined to the degree of -47 instead of -40.
image 2;
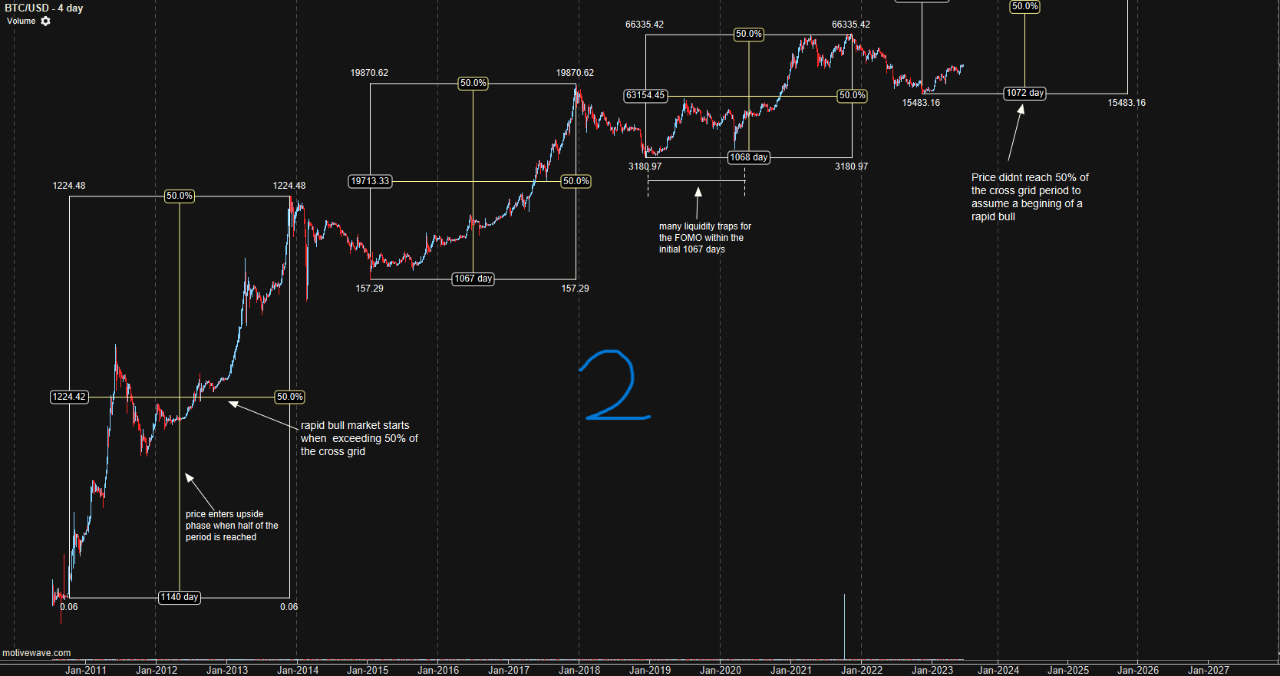
if we look at the bigger image and draw a Fibonacci cross grid for each cycle I noticed that the 1st early cycle bottom to top is not 1067 days but rather is a 1140 days, so i neglected the 1st one and will use the 2nd and 3rd cycle days reading for the current cycle price performance predication.
it is observed that each cycle start its rapid bull market which there are no more corrections and only rapid upward moves when exceeding the Fibonacci level of 50%, also it can be seen that for the 1st half of the cycle price moves horizontally for nearly 540 days. so as for the current cycle price will go through a horizontal period and many liquidity traps will occur, don't expect the bull market to start now even though those twitter ppl are spreading FOMO, does it make sense to start bull market this early ?
Image 3,4;
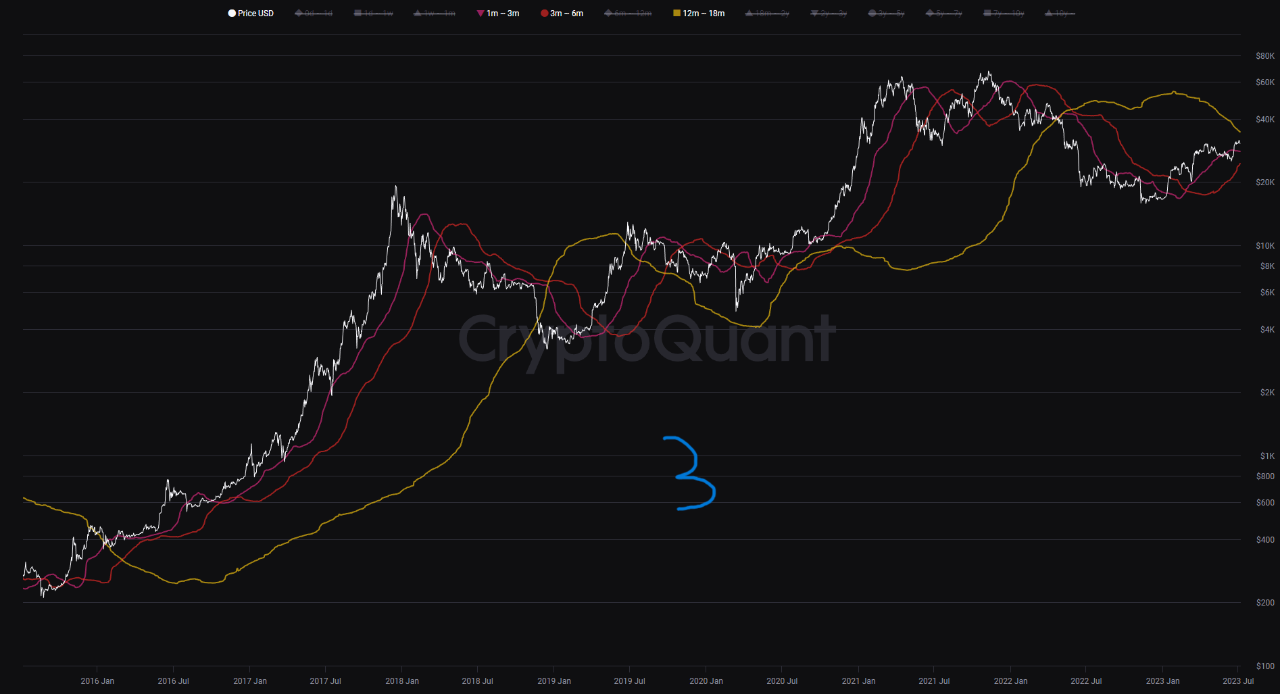
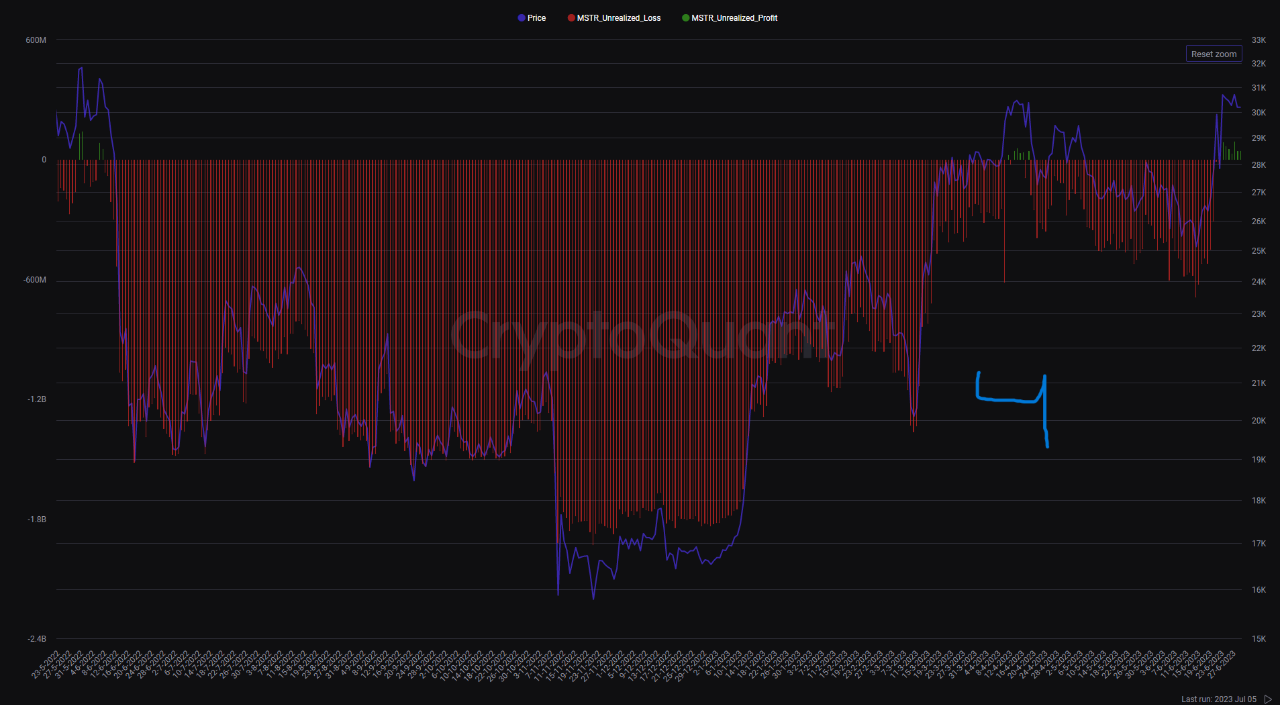
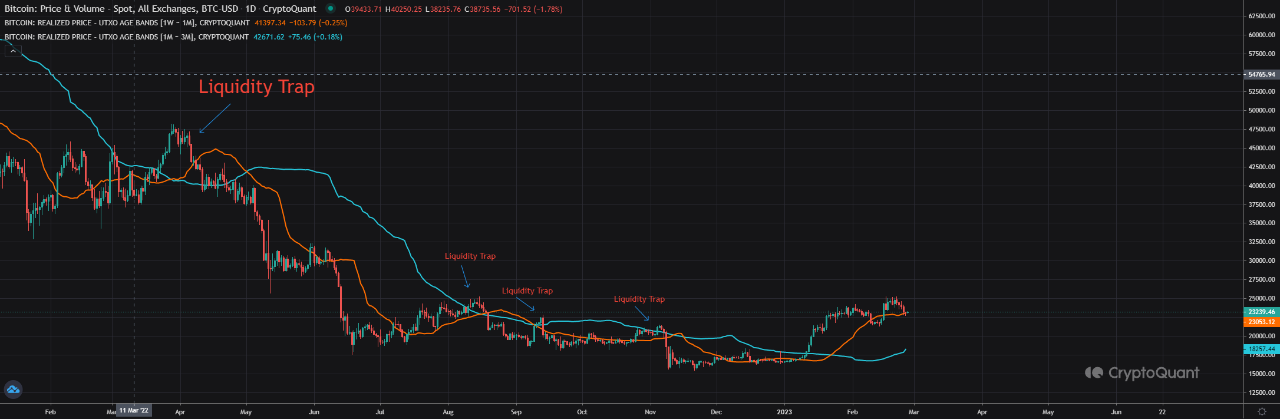
MicroStrategy Bitcoin Holdings are in positive now (his PnL is green) and every time this happens we see a short drawdown (probably investors fear of him selling). image 3 is the realised price for 3 different UTXO bands. keep an eye on it as important SR levels.
Thanks for reading, hope everyone a good opportunity

View original →Hi there, would like to highlight about at which phase we are in right now in the market.
1- Based on UTXO age bands we formed the bottom due to the shifting event that occurred which I spoke about before. historically it was proven that this period last for 1-2 years which so far we been around 300 days till now.
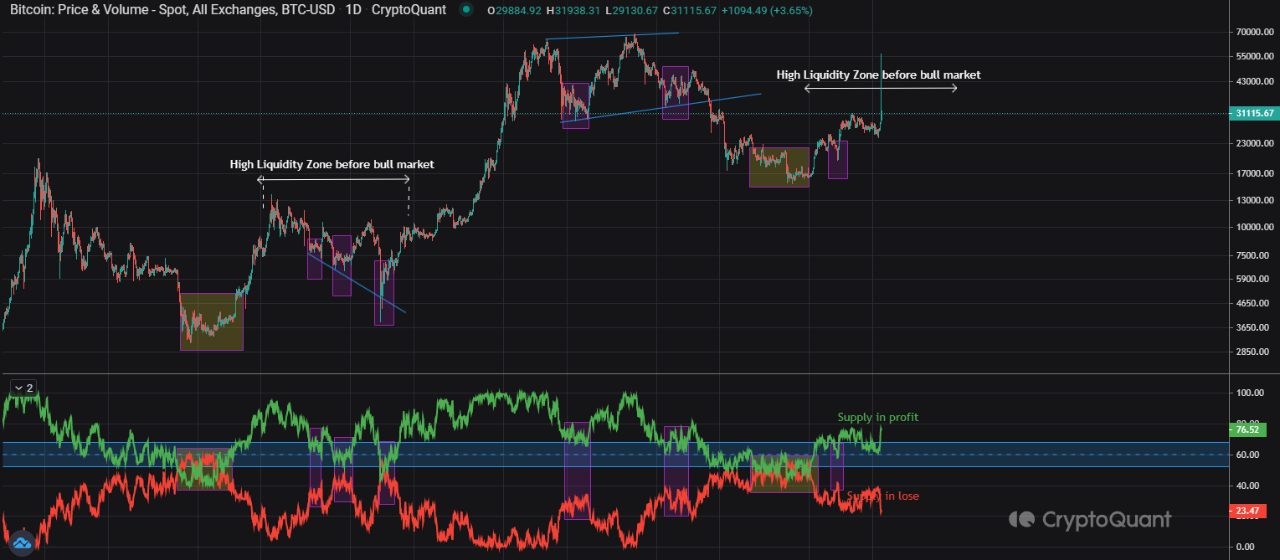
2- supply in P/L was a great metric for a clear visualization on how this liquidity period affects the market supply. (simply people are throwing money in which cause the price to increase slightly for the whales to wipe out the profit and balance the supply that's in profit and that's in lose). currently these days we are having high % of supply in profit.
3- Funding rates for derivatives are currently positively high compared to average which means that long position traders are dominant and are willing to pay funding to short traders.
So we have High funding rates + high % of supply in profit that's ready to be liquidated + being in a horizontal market according to my UTXO chart. just be carful these months and take advantages of the liquidity (just look at previous liquidity in a similar period from last cycles and learn how to benefit them)

View original →Hi there.
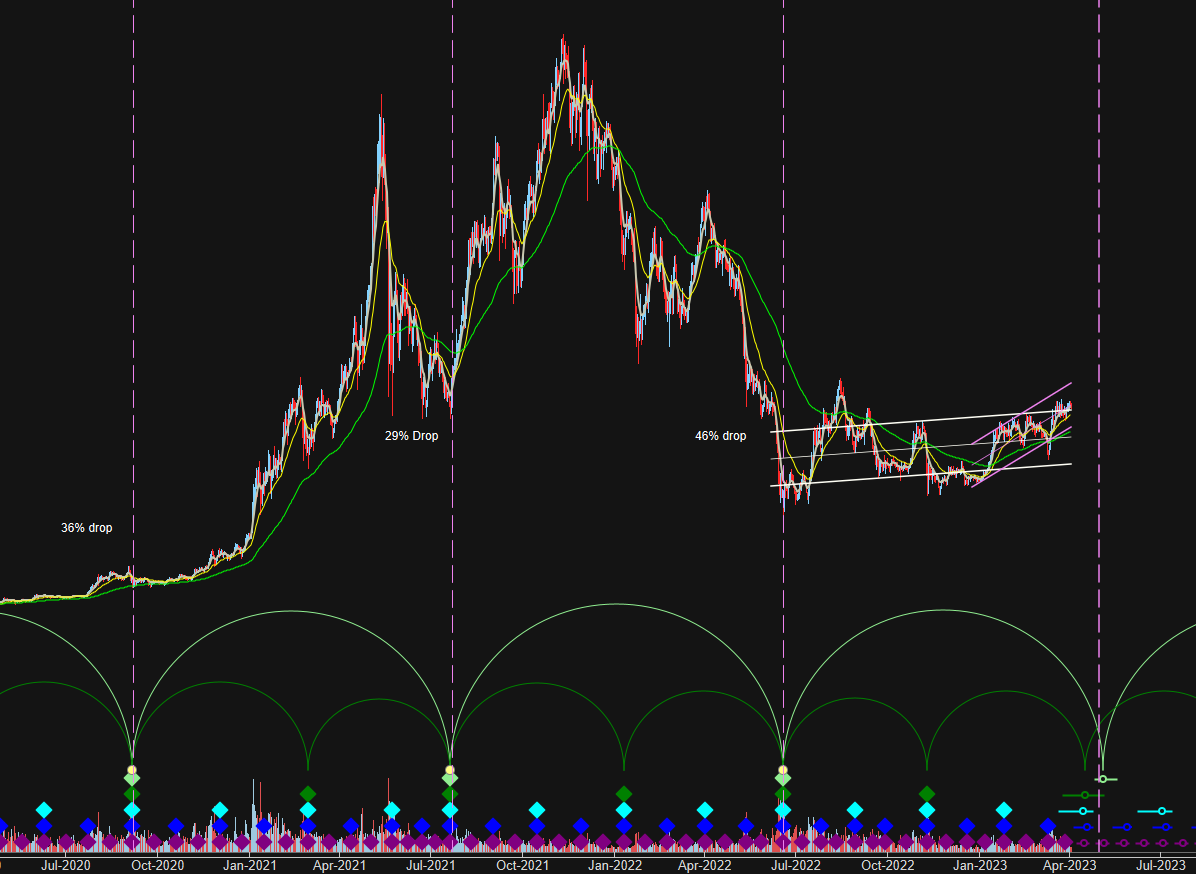
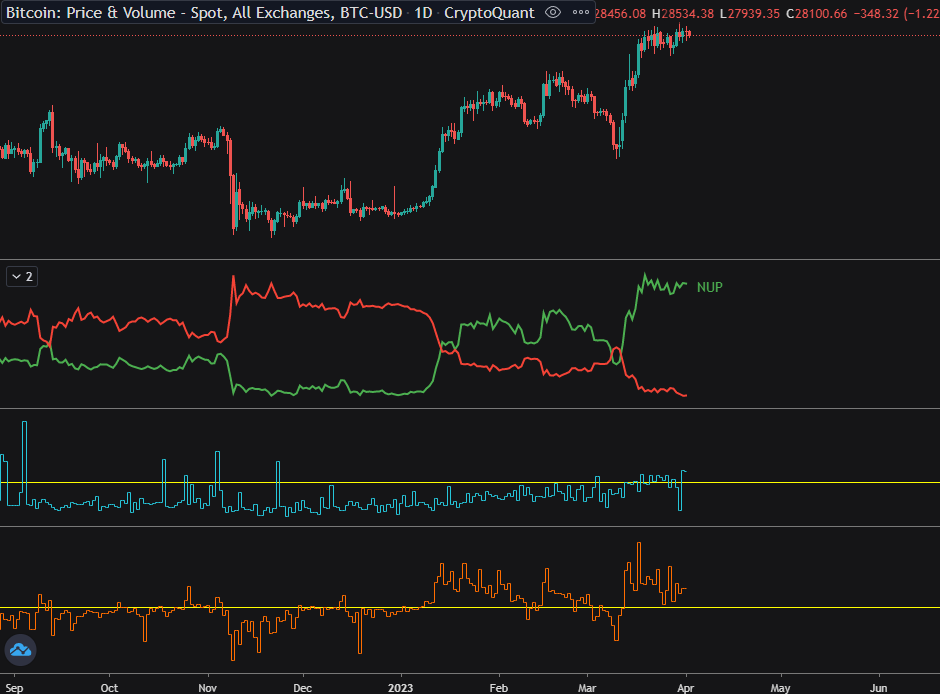
Historically based on time cycle analysis, the 45.8 weeks cycle occurs after a quick crash usually ranging from 30% to 40%. this cycle will approximately occur in 40 days. so stay safe and trade carefully, another thing that's increasing the probability of the upcoming liquidity move is the net unrealised profit for BTC and the weekly resistance point for bitcoin.
NUP shows a profitable cash that's yet to be withdrawal from the market as its not yet realised.
Trade Carefully everyone.

View original →Hi there,
I would like to share with you that this method in identifying the approximate time in which the new bull market shall start is very useful specially for long term investment with high ROI ratio.
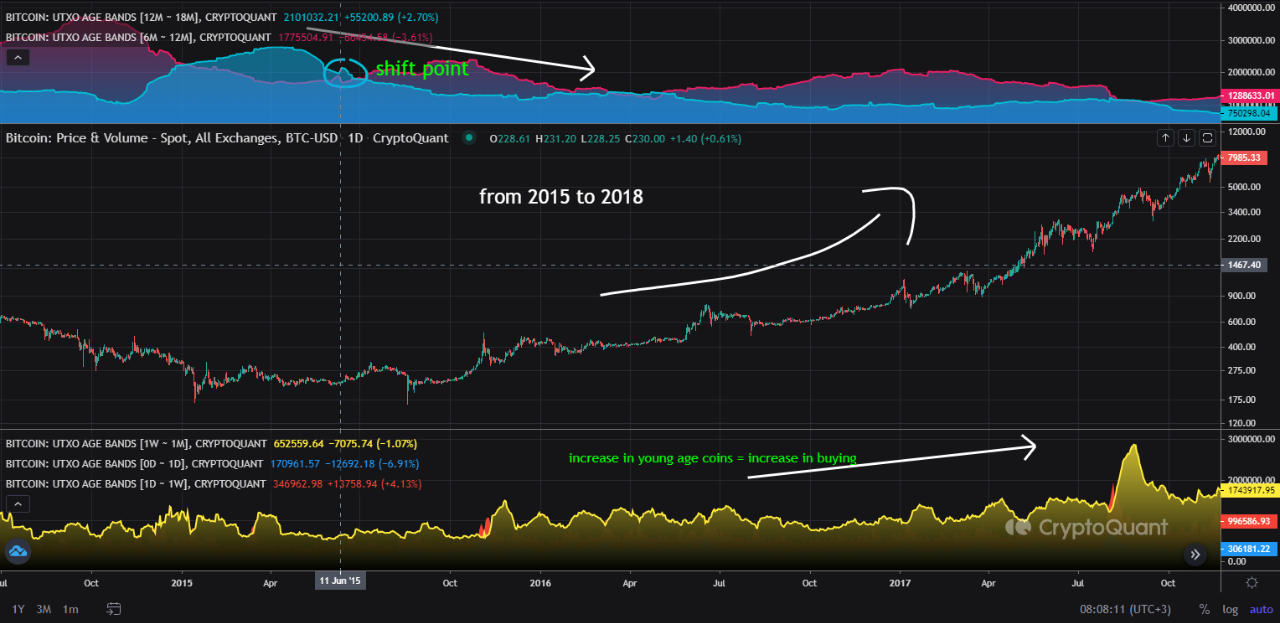
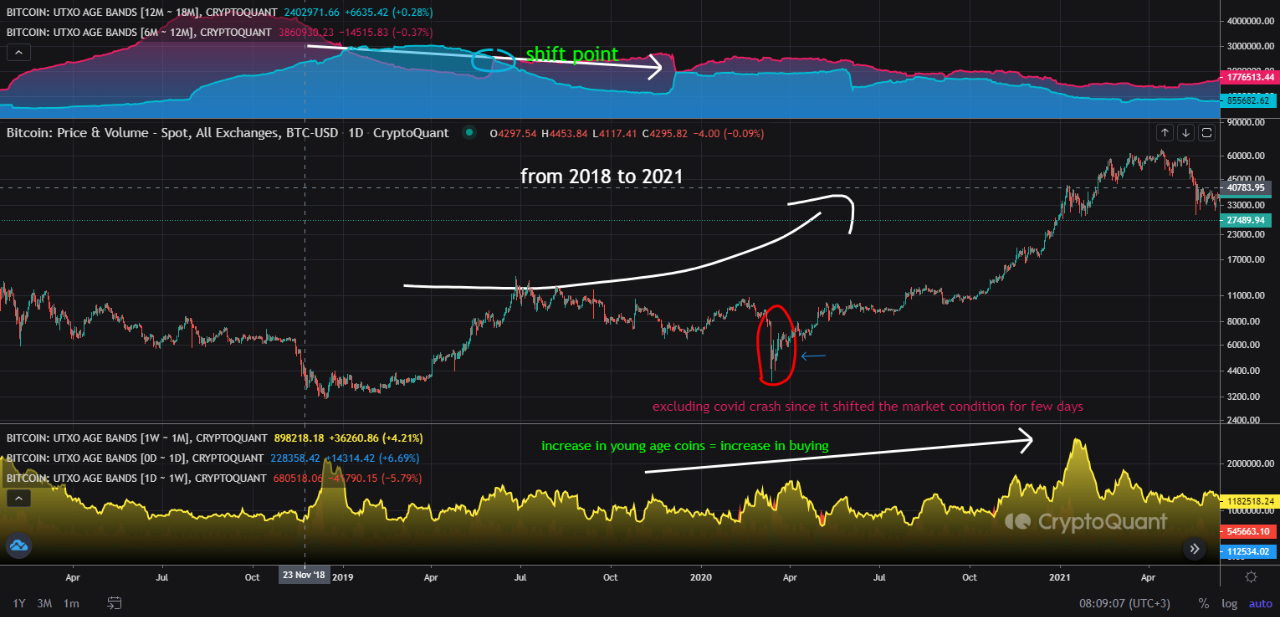
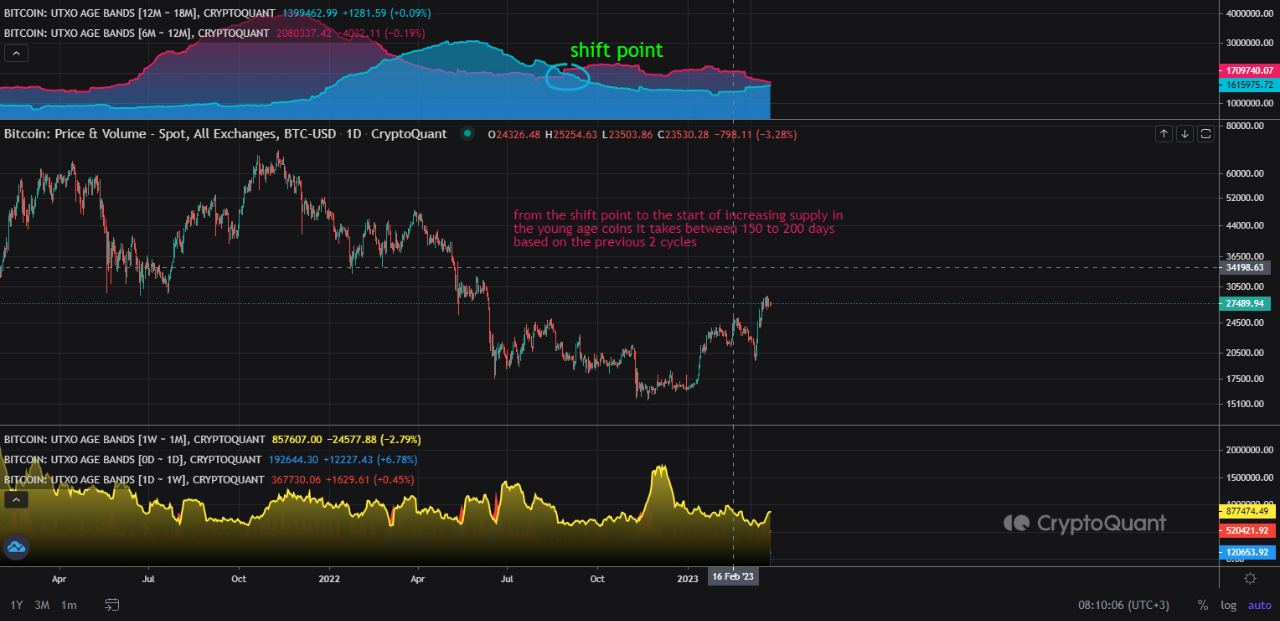
When the long aged stored coins are accumulated for long time metric is decreasing until the intersection point between the (6m-12m and the 12m-18m) this drop is due to 2 things.
1st these coins are shifted into older age bands which means they are not sold
2nd these coins are shifted into younger age bands which means these coins were circulated in the supply making its life time counter start from 1 day.
when there is a rapid decrease in coins that been stored in this particular period of time (6m-18m) historically it showed a good indication of the presence of an under-valued market. a stage where these coins are shifted into a younger age bands which means some people are accumulating some future investment specially when there is a noticeable increase in the young age bands even few moths before the new bull market start.
as for now we are at the under-values stage and is a good time for future investment with a good ROI ratio.

View original →Hi there. in this post I will gave my opinion on the next big liquidity move.
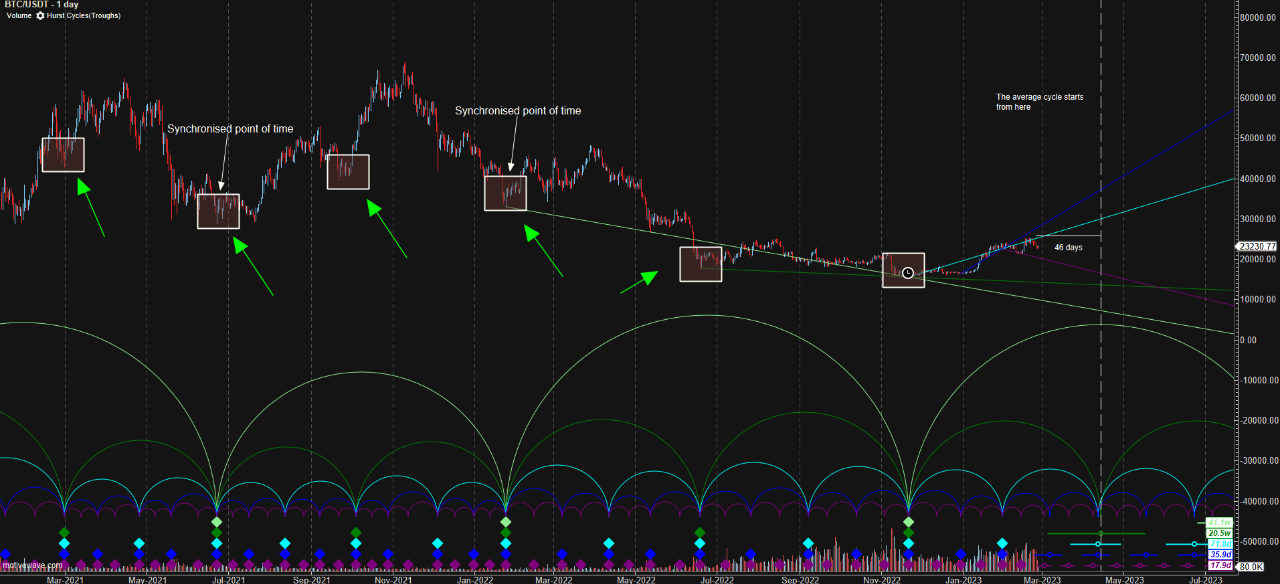
By looking at the Hurst cycle chart the 20 weeks cycle performed as a correction period after a small quick crash. this cycle is approximately starting in 40 days. during this cycle period i find it a good time to accumulate BTC for a short period since it is mostly followed by a quick flip in the market.
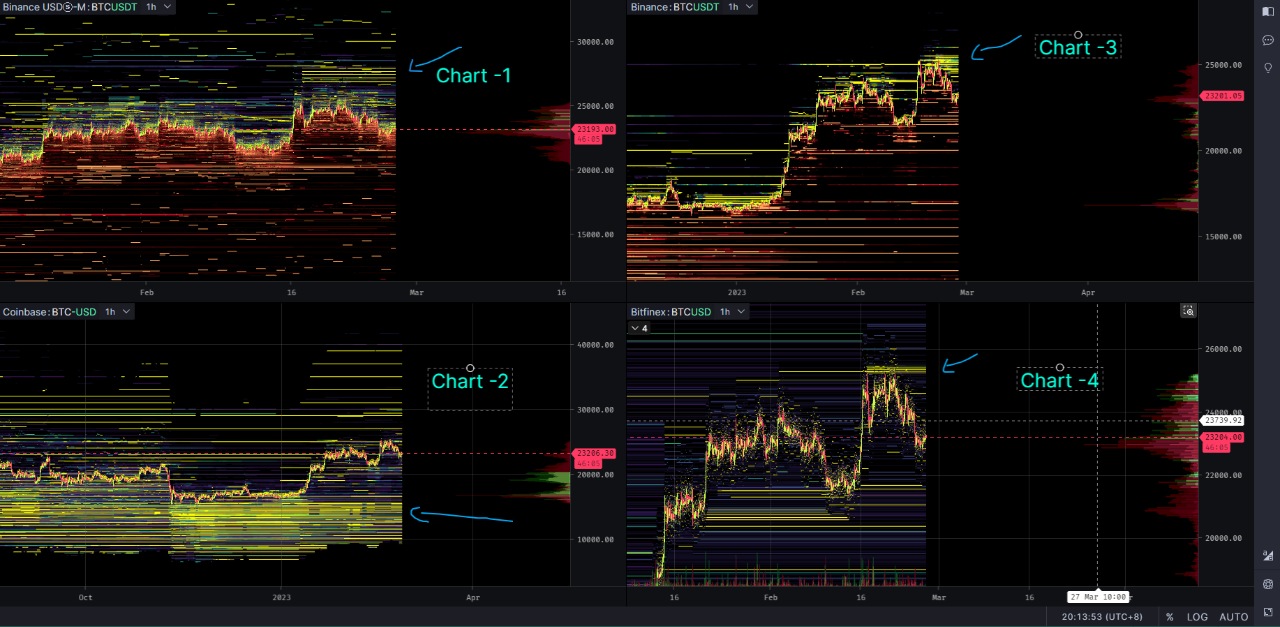
2nd by looking at the heatmap chart from Binance - Binance future - Coinbase and Bitfinex. we see based on chart 1, 3 and 4 we have a considerable sell wall. however for Coinbase (chart -2) it is showing a massive buy wall at approximately 15k ( mostly this wall is there not for nothing right?)
3rd based on the Realized price for (1week to 3month) it visualized a multiple liquidity traps. when most the people are profiting that's were whales start making money by liquidating them . right now the price is above the average and the cross between both realized price indicator occurred so most people will be happy and start panic buy as the market seems to start building up based on these 2 indicators.
Keep in mind the market usually does not crash at the 20weeks cycle. it start shifting its direction to downward few weeks before, so after 25 days from now trade carefully
See you in 40 days. lets see how the market play out.

View original →Bullish(Nuanced)2/10/2023
In this QuickTake I'm not going to analyse the market but rather I will share one of the best things I did to gain a good money during the bear market for the last few months.
-
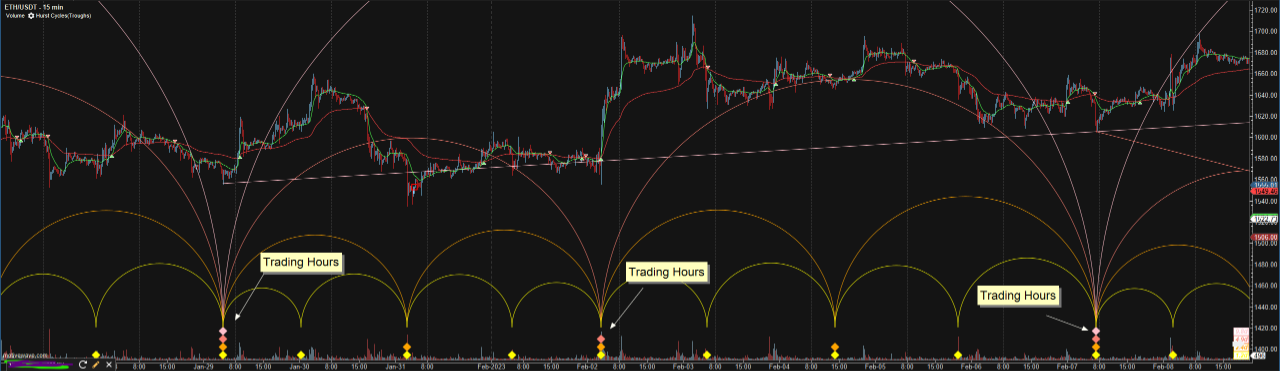
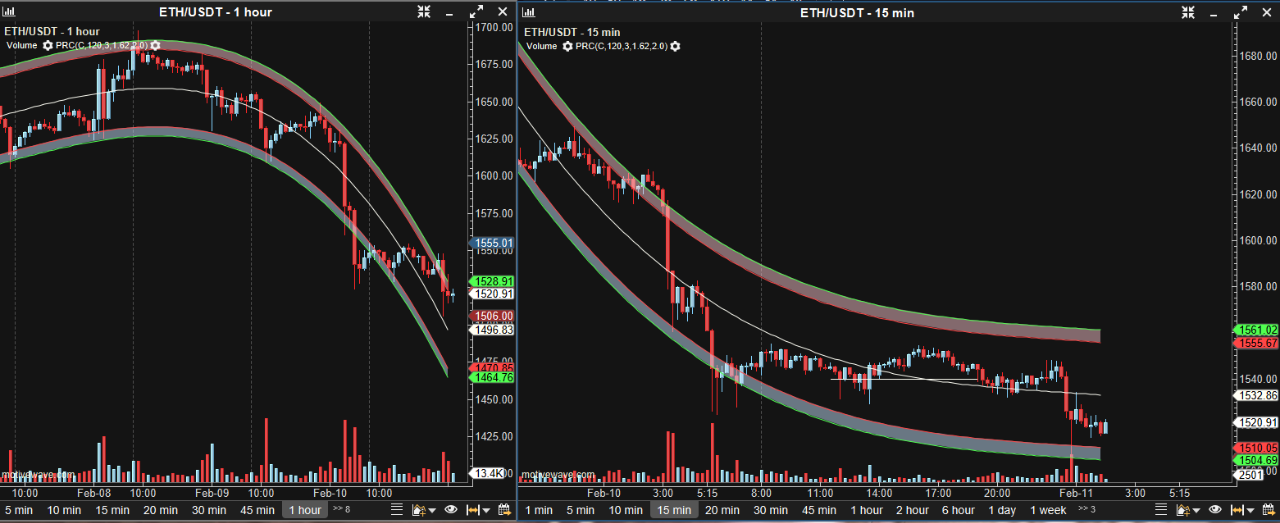
1st you need to identify when to trade, when does most of the short up move occurs? there are several methods to know that, but I personally use Hurst Cycle Theory and I have modified its nominal model to gave me a synchronised point of time where short term up trend occurs. look at the figure i attached.
-
second when you identify the time where you look for opportunities you should find an entry point. I do that using the Polynomial regression channel + EMA of (7-25-99).
-
3rd you need to measure the strength of the up move and you can do that with the some strength measurement indicators like the ADX or by looking at liquidity indicators if the impulse move occurred after a small crash.
-
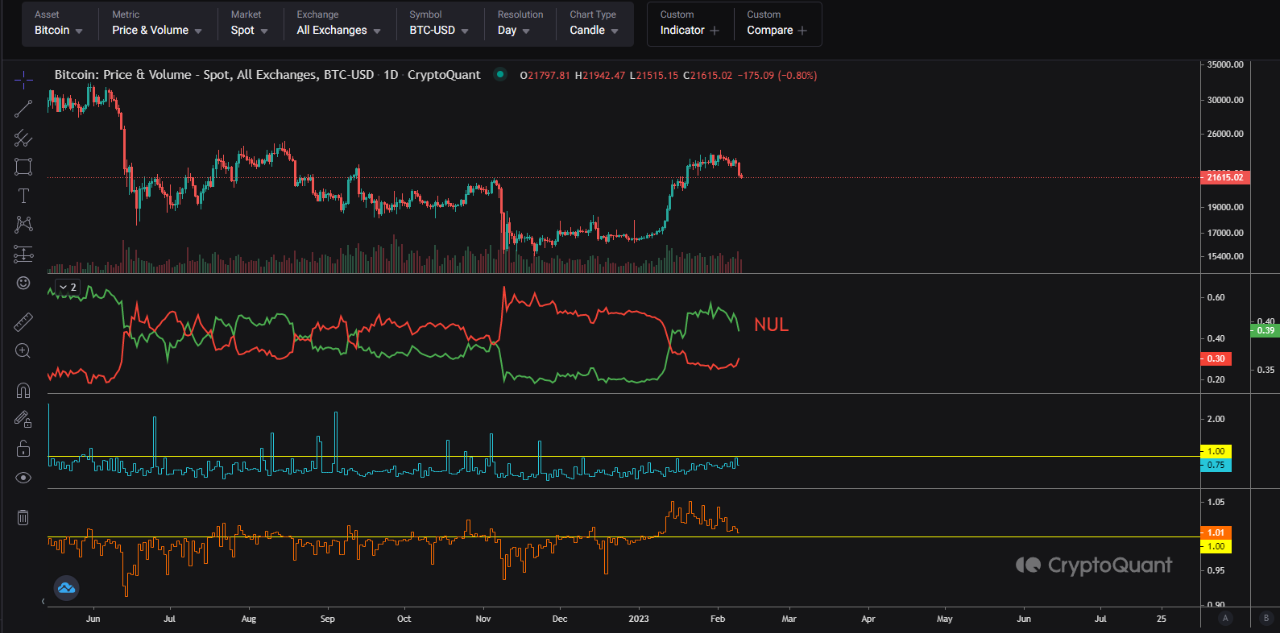
The reason why these days are good for daily trading is the high value of NUL, the market is saturated with losses so people wait until the price fly again which means only low volume of people actually trading making it way easier than how it used to be back than 2 years ago.
-
generally I really advise new traders to have a sequence of steps before taking trades to have a better vision about your trading system and to understand where the issue is. avoid taking trades based on your feelings and twitter ppl. make your own system and follow it.
-

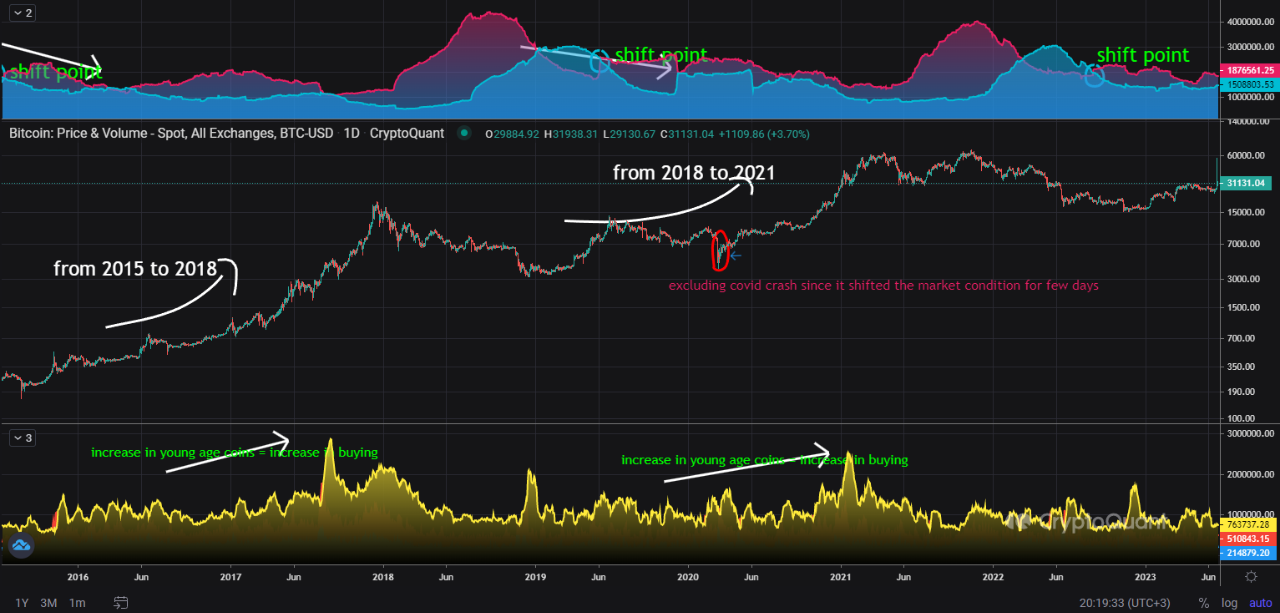
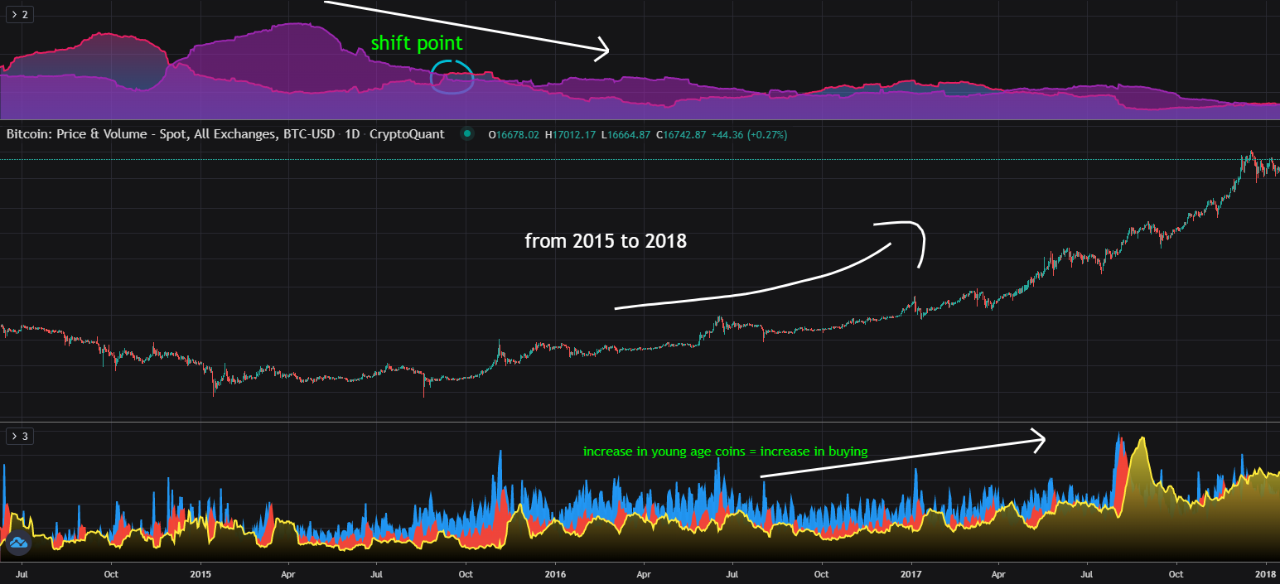
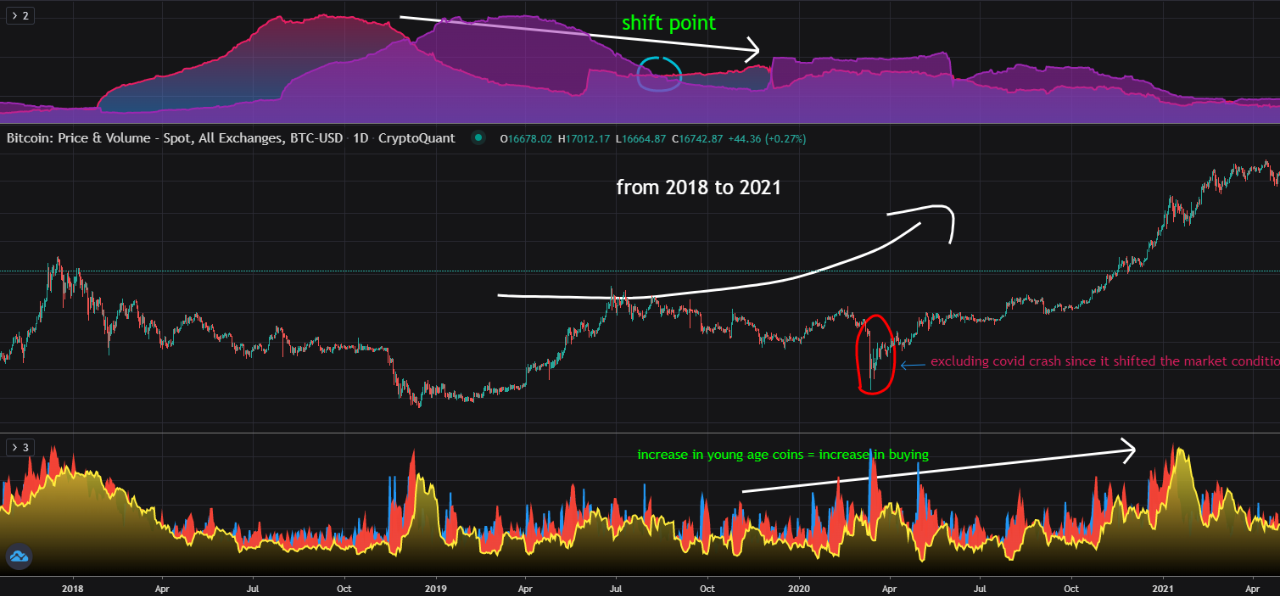
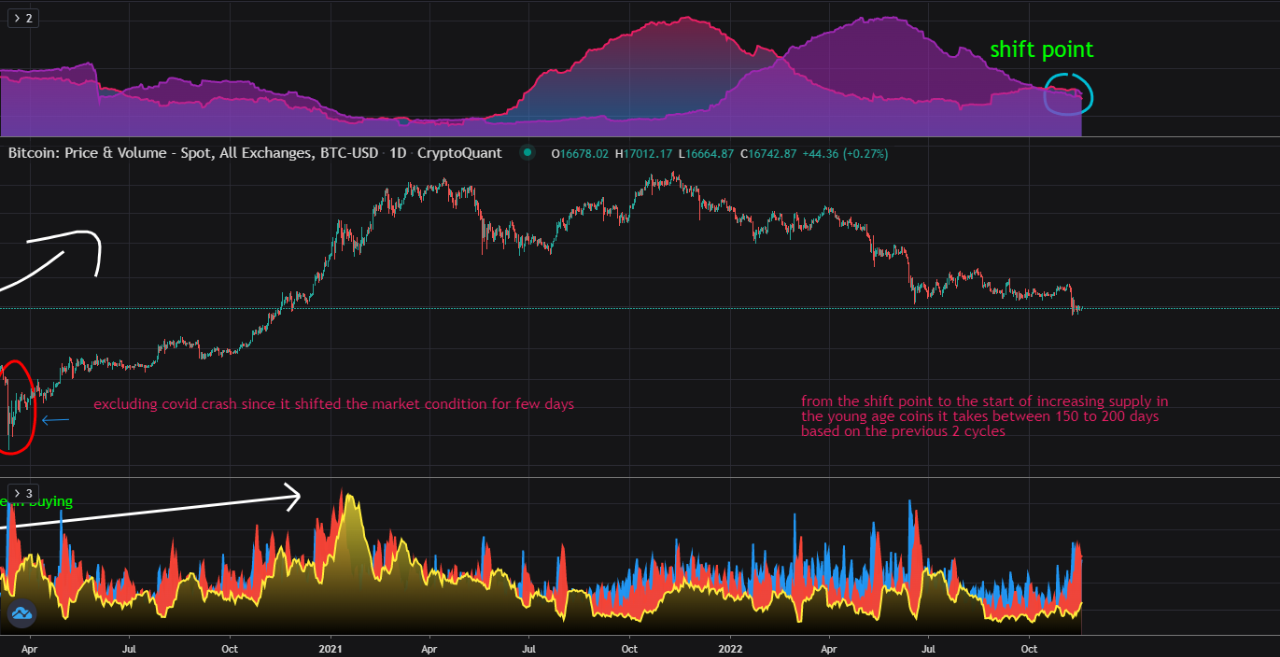
View original →purple and pink metric are the coins that did not move out of its wallet for 6 to 12 months, this means these coins are owned by long term investors. when these coins are moved it will be considered a young age coin, when these coins are moved out to new wallets this indicate that they were bought by another person, when a huge quantities of these coins are bought by other people the purple and pink metrics will start dropping as the quantities of these coins are reduced, when the young coin age band indicator is spontaneously increasing this means new coins are entering this band which is likely a new traders accumulating these coins from others who were holding it for long time.
in 2015-2018 an increase in young coins age band resulted a market to create a higher highs since there is increase in money flow (buying pressure) in the market which can be seen by the increase if young age coins. same event occurred in 2018-2021.

View original →Read part 1 and part 2, 1st
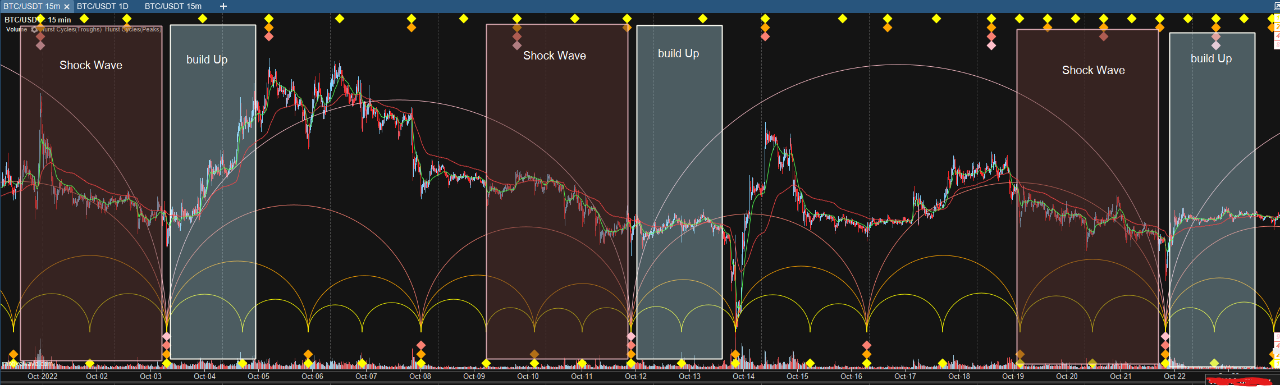
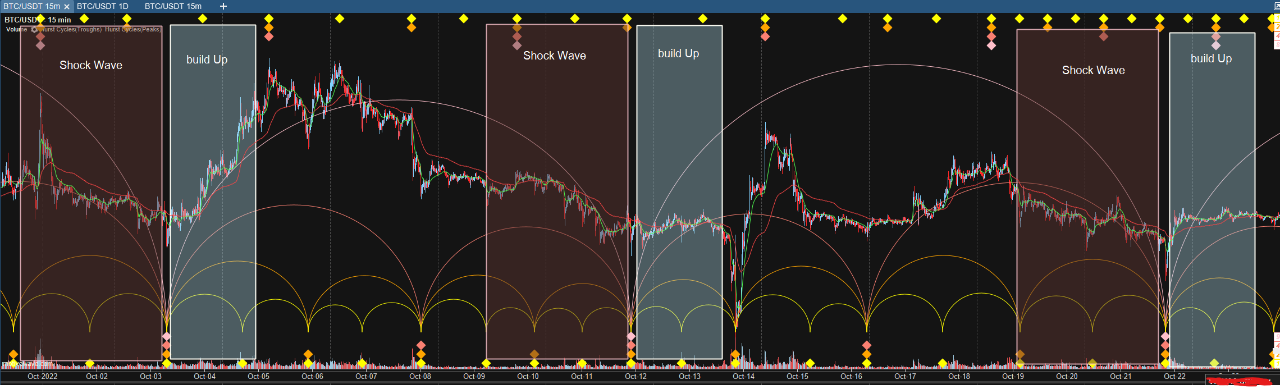
try to understand the underlying principles of money flow behaviour of the market more than spending your time in trading using some lines. The chart on the right side shows my winning trades (Green lines) and losing trades (Red lines). We can see that the winning trades were after a liquidation phase (Price drop) and later on the market tend to fluctuate way lesser than before and hence a higher winning probability.
In conclusion try to understand the flow behaviour more than spending time studying some lines (support and resistance), by doing so you will be following and able to catch the big people moves (when and how) and it will help you filtering out your trading hours into specific period after the existence of some specific moves. This period the winning probability is high since the big people and the experts are entering the market and this is indicated by the formation of build up phase. Good luck out there

View original →Bearish(Nuanced)11/6/2022
Check out Part-1 before reading this
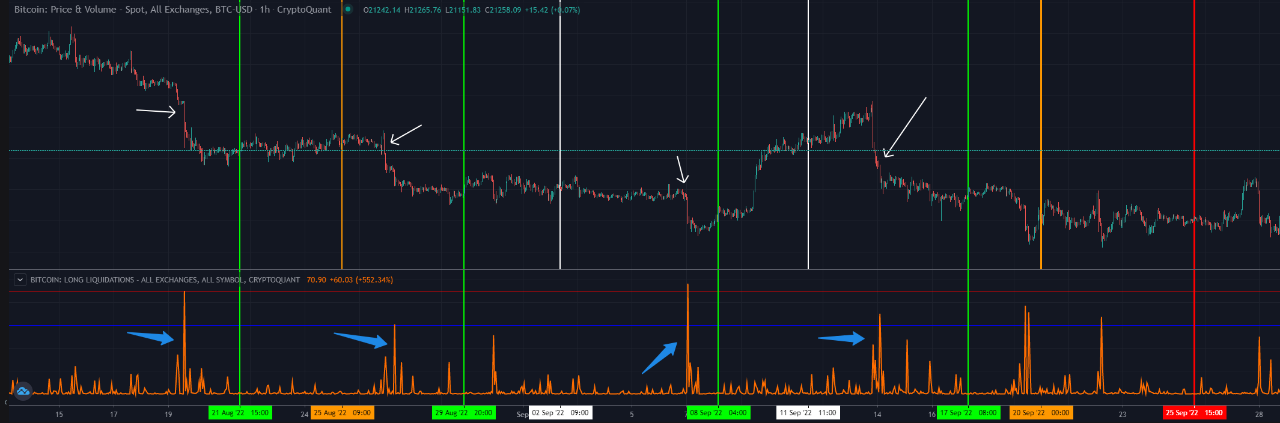
When daily traders lose their money, they will get depressed which means they are not going to trader for the next few days. This is usually the synchronised point, when a synchronised point is formed the market will start the build-up phase which daily traders will mostly miss due to their depression of losing money during the shockwave. The build up phase is the best to look for buying opportunities using any reliable strategy. The build up phase is the time after many people got liquidated and the market entered the exhaustion phase and will start recovering in the next few days.
However, in some cases you might not see the market entering the build up phase even though we been though a shock wave and are at a synchronised point? This is because the liquidation rate is not high and not many people got liquidated, so logically why would a build up phase occur? Think like someone who want to use his billion to liquidate others and make money.

View original →

