


Bullish
BTC
8/5/2026Whales just moved 38,000 BTC into accumulation wallets—one of the largest inflows on record. But their average cost basis sits at $70K while BTC trades at $64K, signaling potential break-even exits...
View original →Sentiment timeline shows relative sentiment within this analyst's history. A perma-bull showing 8 bullish : 2 bearish in a bear market sets that as their baseline. If you notice any errors, claim @abramchart to submit corrections.
Whales just moved 38,000 BTC into accumulation wallets—one of the largest inflows on record. But their average cost basis sits at $70K while BTC trades at $64K, signaling potential break-even exits...
View original →The market has just witnessed the largest drop in Open Interest of the current cycle, with total OI falling sharply from around $45B down to $28B within a few days. This move does not signal the start of a bear market; rather, it reflects a major leverage washout (Long Squeeze) that cleared out overly extended positions. Despite the volatility, Bitcoin remains above the ETF average cost basis at $79K, and there has been no meaningful selling from institutional funds. The key structural level to watch remains $74,000. A weekly close below it would be the first sign of broader macro weakness. 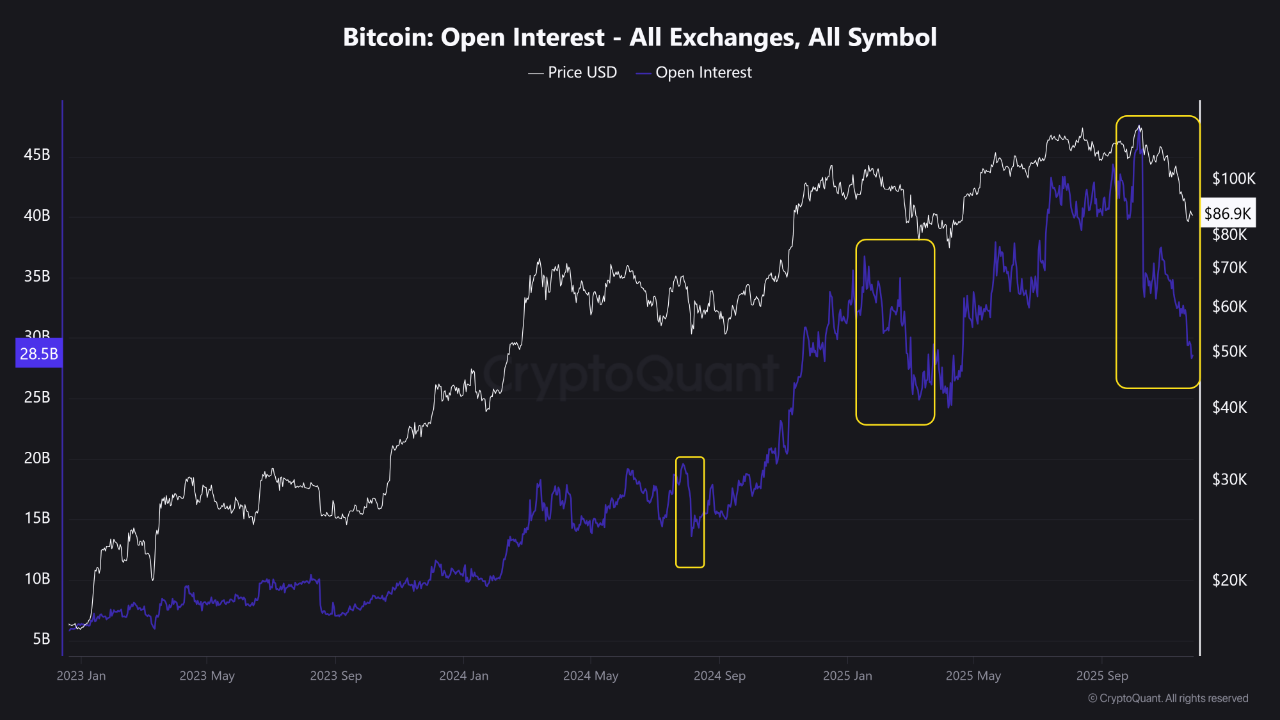 
View original →The Futures–Spot Basis is showing a clear shift into a bearish pressure phase: The Basis has flipped negative, meaning futures are now trading below the spot price. This indicates weak demand for leverage and rising caution among traders. A negative Basis usually appears when the market is de-risking or unwinding long positions. BTC is currently trading inside the Base Zone, an area that typically reflects selling pressure or position reduction. Both the 7D and 30D moving averages are sloping down, confirming a short-term bearish futures sentiment. Summary : The market is no longer showing a futures premium instead, traders are pricing risk lower. A return above 0% - 0.5% Basis would be the first sign of recovering confidence. 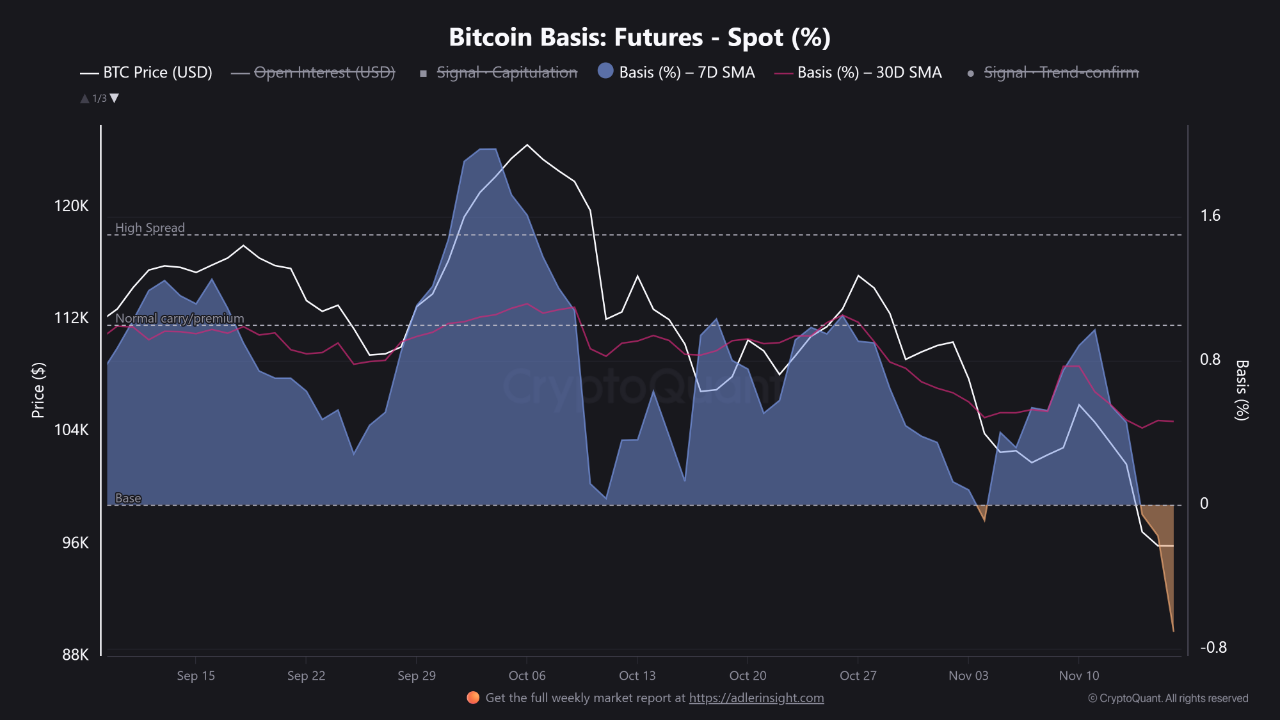 
View original →Over 26,500 BTC just flowed into whale accumulation wallets a major inflow, though not the largest this year (the February spike was bigger). This kind of movement typically signals institutional or whale accumulation, as coins are transferred from exchanges to custody wallets a classic sign of long-term positioning rather than short-term trading. Historically, similar surges often appear near market correction zones, hinting that smart money is quietly buying the dip. While the short-term price may still fluctuate, the on-chain data shows confidence returning among large holders the whales are loading up again. 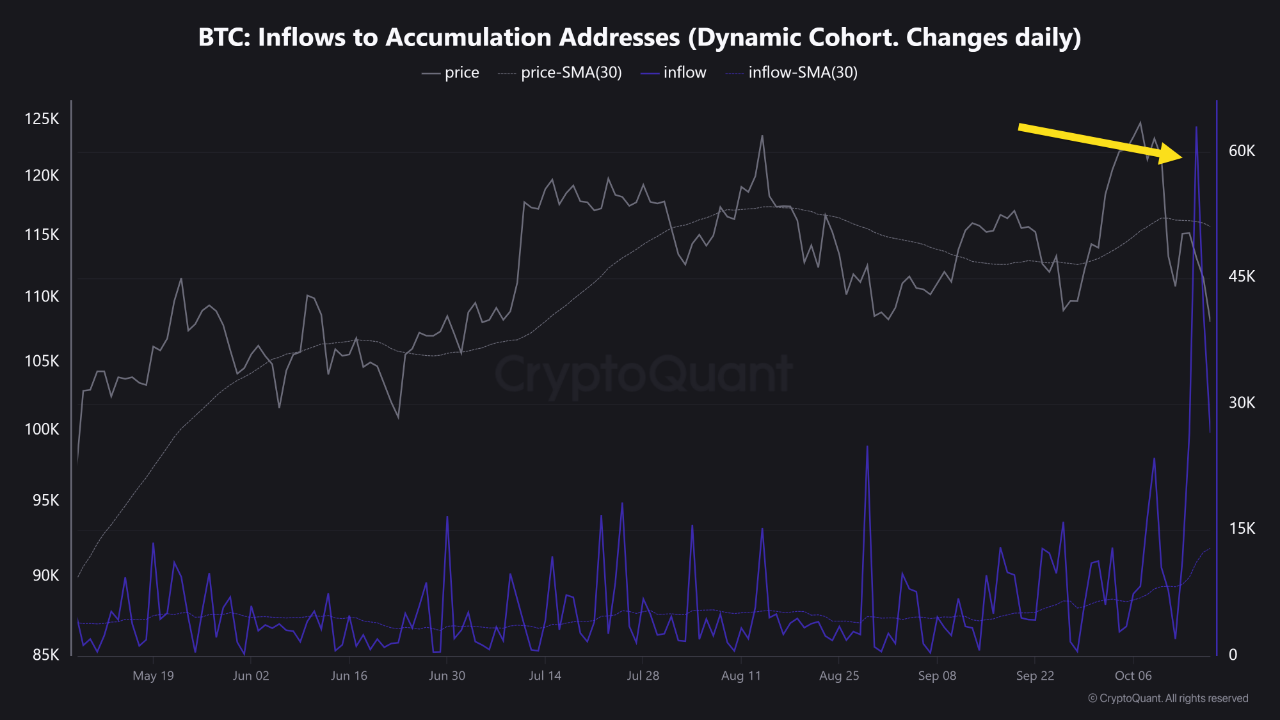 
View original →Long-Term Holders (LTH) remain in solid profit territory (NUPL above 0.5), showing strong conviction and willingness to hold. Short-Term Holders (STH) are fluctuating near lower profit levels, indicating partial selling or short-term pressure during price rallies. Bitcoin price is trading close to the $104K zone, supported mainly by LTH confidence, reflecting strong long-term holding behavior. The overall trend remains bullish, driven by long-term holder conviction, while short-term holders may cause temporary corrective pressure. 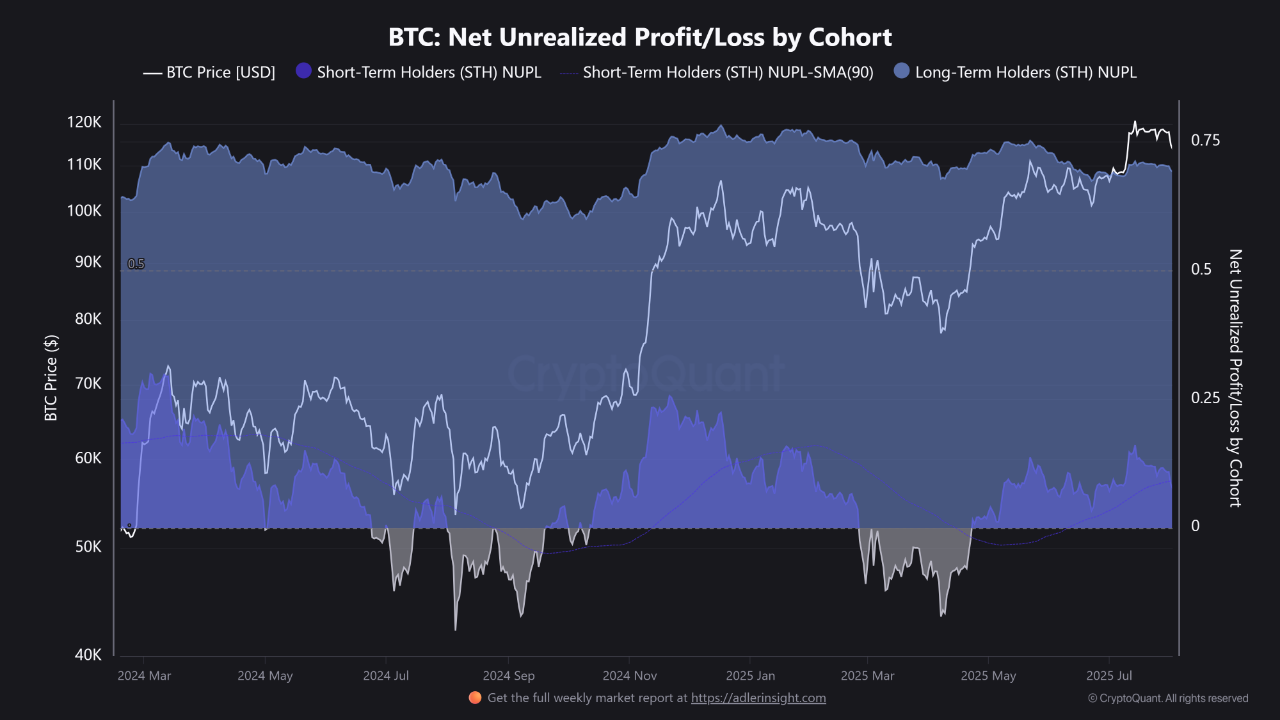 
View original →After weeks of negative demand momentum (red bars), we're now seeing a clear shift to positive momentum (green dots) aligned with a strong price rally. The momentum line (blue) has broken out from a downtrend, signaling a structural shift in market demand. The 30-day SMA is curving upward for the first time since early June – a bullish reversal sign. Price is holding above $115K, supported by improving demand conditions. On-chain demand momentum suggests this Bitcoin rally still has fuel. No signs of exhaustion yet. 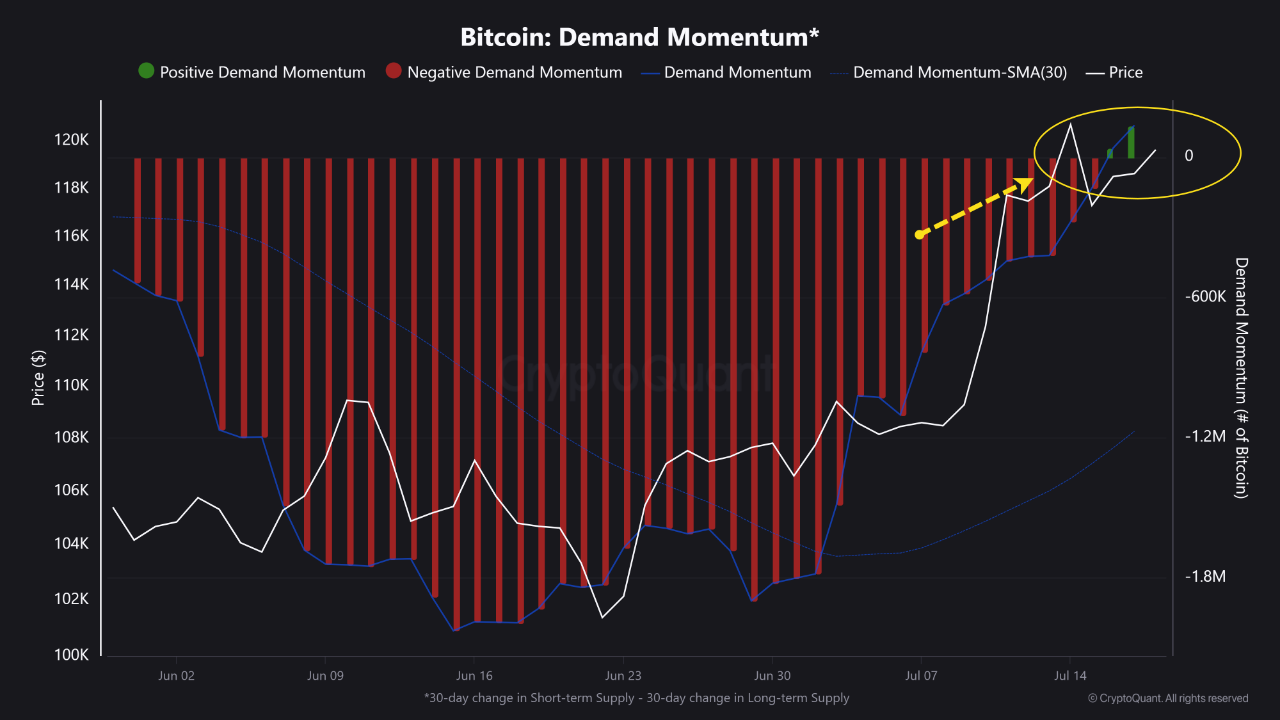 
View original →Bitcoin: Currently targeting the $96,700 level, which represents a key support zone on the network and aligns with the average purchase price of short-term investors. This level is considered a potential rebound point in the event of a mild price correction. Fear & Greed Index: The index remains in the neutral zone and has not yet reached a state of extreme optimism, indicating that the market has not entered the typical emotional buying phase seen during peak rallies. Based on this, a renewed upward move from the $96,700 support is anticipated. Altcoins and Ethereum: Altcoins, including Ethereum, are likely to be negatively impacted by any correction in Bitcoin due to the rising Bitcoin Dominance Index, which typically draws liquidity away from other digital assets in the short term. Conclusion: If liquidity is available, it is advisable to wait and observe market movements, with the possibility of entering new positions after the anticipated correction completes. 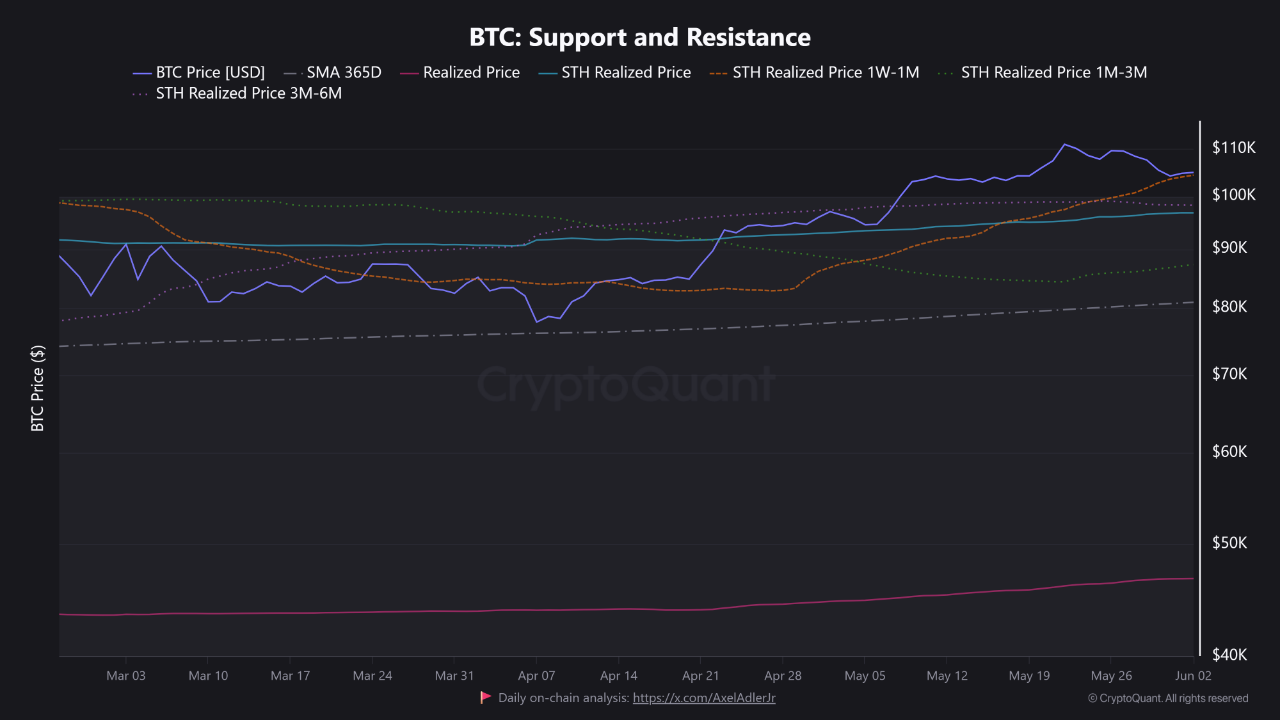 
View original →The current Coinbase Premium Gap is -5.07, indicating that BTC is trading lower on Coinbase than on other global exchanges. This suggests selling pressure from U.S. investors. Over the past month, the premium recovered significantly, but is now dropping again — aligning with the recent BTC price correction. 🔍 What it means: A negative premium = bearish sentiment from U.S. traders. Persistent negative gap = potential price weakness ahead. ⚠️ Keep an eye: If the gap remains negative, short-term downside risk may increase.  
View original →Every major ETH bull run historically began near or below the lower band (green), which reflects deep-value accumulation phases. Peaks often occurred near or above the upper band (red), suggesting overbought market conditions or potential profit-taking zones. ETH price is currently approaching the realized price (blue) and moving closer to the lower band, which could indicate: The market is cooling off. Possible accumulation opportunity if the trend continues downward. The closer ETH trades to or below its realized price, the more likely market sentiment has turned bearish or neutral. Historically, these conditions have often preceded market bottoms. Ethereum is nearing historically significant support levels. While it may indicate a buying opportunity for long-term holders, caution is still warranted as further downside is possible. Watching price action near the lower realized band will be critical — a bounce could signal a trend reversal, while a break below may confirm further weakness.  
View original →From November 2024 to February 2025, the BTC price sharply increased, but the sentiment index did not sustain the same upward trend, peaking briefly and then declining. This divergence often suggests growing caution or profit-taking behavior, even during bullish price action. From February 2025 onwards, there is a steady drop in sentiment, even though the price remains relatively high. This indicates a cooling interest or increased fear in the futures market, possibly due to macroeconomic uncertainty, regulatory concerns, or expected corrections. The sentiment index shows a resistance zone near 0.8 and a support level around 0.2. The index currently trends closer to the support level (~0.4), suggesting bearish sentiment in the futures market. BTC average price has dropped from highs in early 2025 and is now ranging around $70K–$80K, reflecting market indecision or accumulation phases. The chart shows that while Bitcoin reached significant highs, futures sentiment weakened, which can be a warning signal of potential retracement or at least a lack of strong bullish conviction. If the sentiment index continues to stay low, we could expect price consolidation or downside pressure in the near term unless new catalysts shift sentiment. 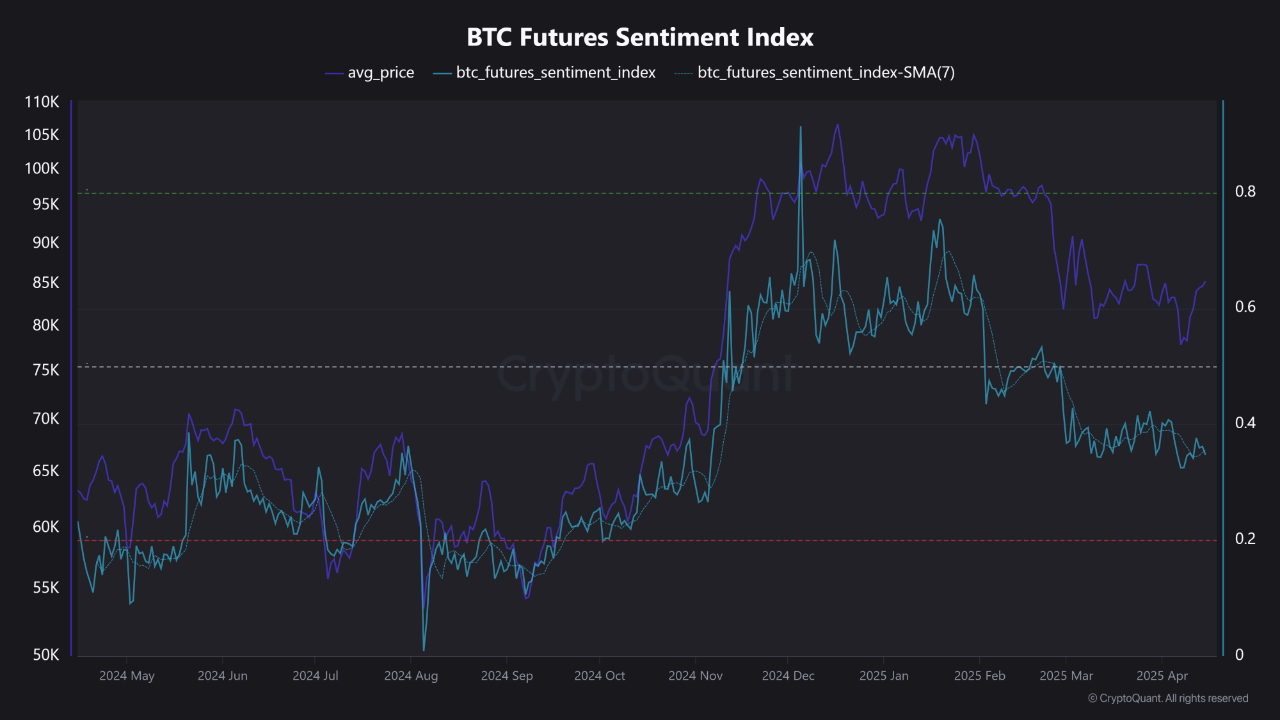 
View original →