Bullish(Nuanced)ETHBTC
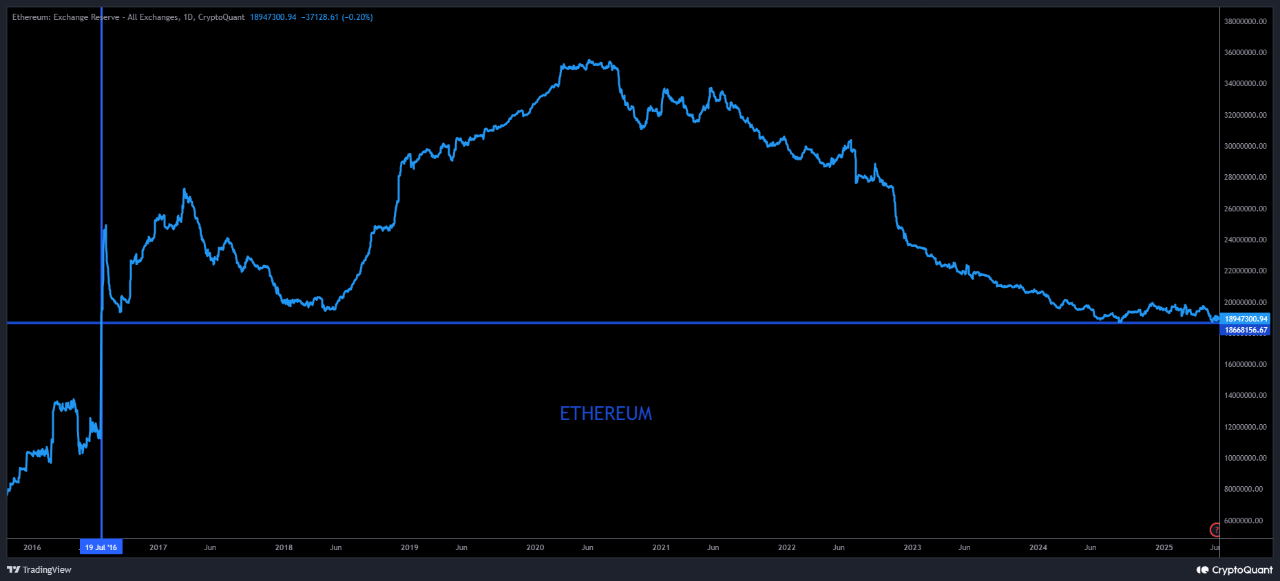
6/1/2025 The supply of Ether held on exchanges is at levels last seen during its FIRST year in operation, 2015-2016.
Interestingly, while BTC also experienced a decline in supply since 2020: buoyed by a significant marketing push - its current levels have only returned to levels last seen in 2018, its ninth year.
Also both ETH and BTC are down around 30% in exchange supply from their 2021 highs, showing identical trends in supply contraction, aka inferred demand.
Despite Bitcoin's strong marketing presence from proponents like Saylor's "Strategy" and a newly pro crypto government in the U.S., and Ethereum's notable lack of marketing, ETH's fundamentals appear to speak for themselves, as demand continues to grow, with Ether steadily moving into long-term investor holdings at the same pace as BTC.

View original →We saw the largest net outflow of BTC from exchanges since 2022, this past week.
The last time we saw outflows at this level was shortly after the FTX collapse. Corresponding with this outflow was a 3% drop in supply of BTC on exchanges.
Note that the next largest outflow during this period was last July, and nearly as large as what we saw this week.
Despite sentiment, big buyers are stacking on dips. Potentially a fund or institution.


View original →Bullish(Nuanced)BTC
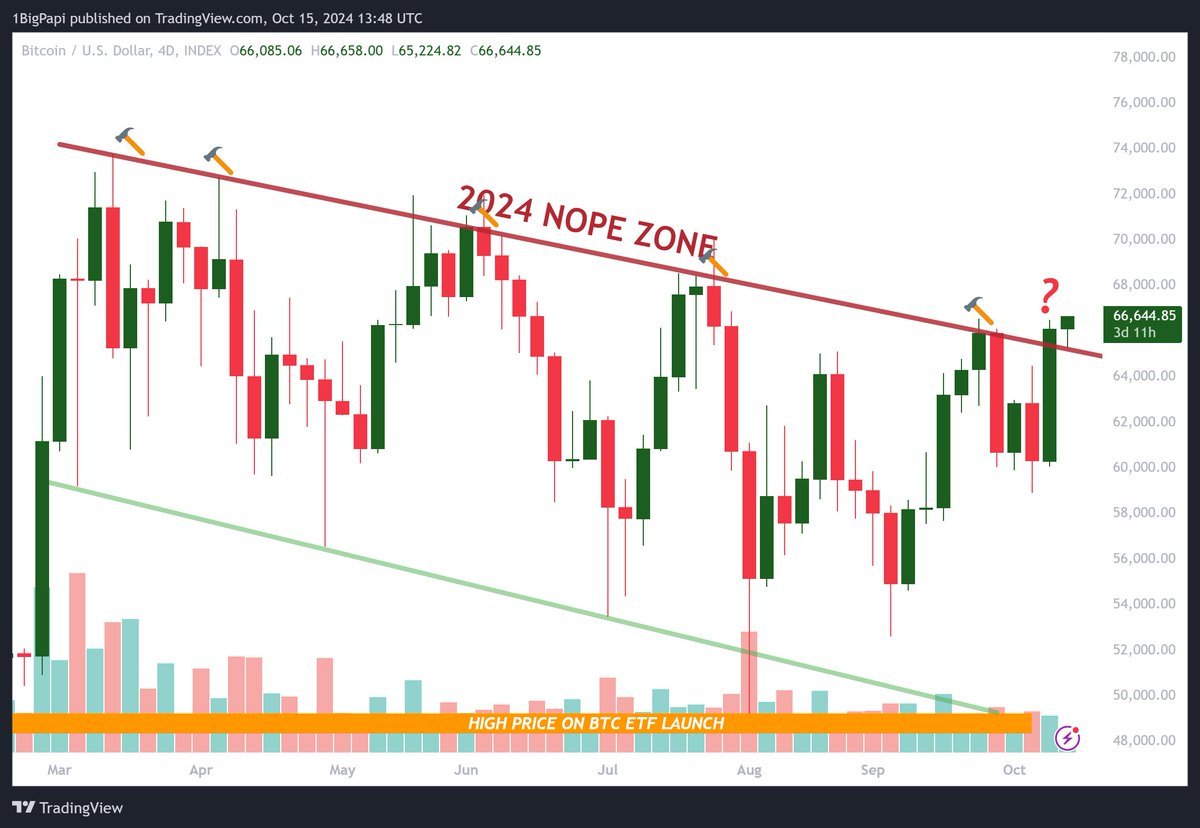
10/15/2024 2024's Nope Zone is undefeated. For now. Will this time be different?
It is the first time on the 4d we saw successful price retest above Nope Zone. OI is very high, net flows are trending weakly bullish on spot, and neutral on derivative exchanges, ETF flows are bullish, but they also tend to be at key resistance (human psychology).
In my perspective, even if we don't breakout this time, we are getting very close. Any reject should be short-lived: ~$60k and mid $50s are both strong supports.
In any case, just keep stacking and forget about the short term noise.
Most on-chain metrics support the mid cycle consolidation thesis; and its an incredible consolidation and compression, you don't want to miss the explosive breakout when it finally happens. Dollar Cost Average into spot has been, and will continue to be your low risk friend.

View original →Bearish(Nuanced)BTC
7/5/2024 There is considerable speculation about Mt. Gox Bitcoin flows and the associated market pressures. Combined with miner activity, Germany's selling, and prevailing negative sentiment, the Mt. Gox BTC will test the market's capacity to absorb BTC throughout Q3.
It's too early to predict the exact impact of Mt. Gox BTC. We need to observe the percentage of holders selling their BTC in the coming weeks to build a more accurate forecast.
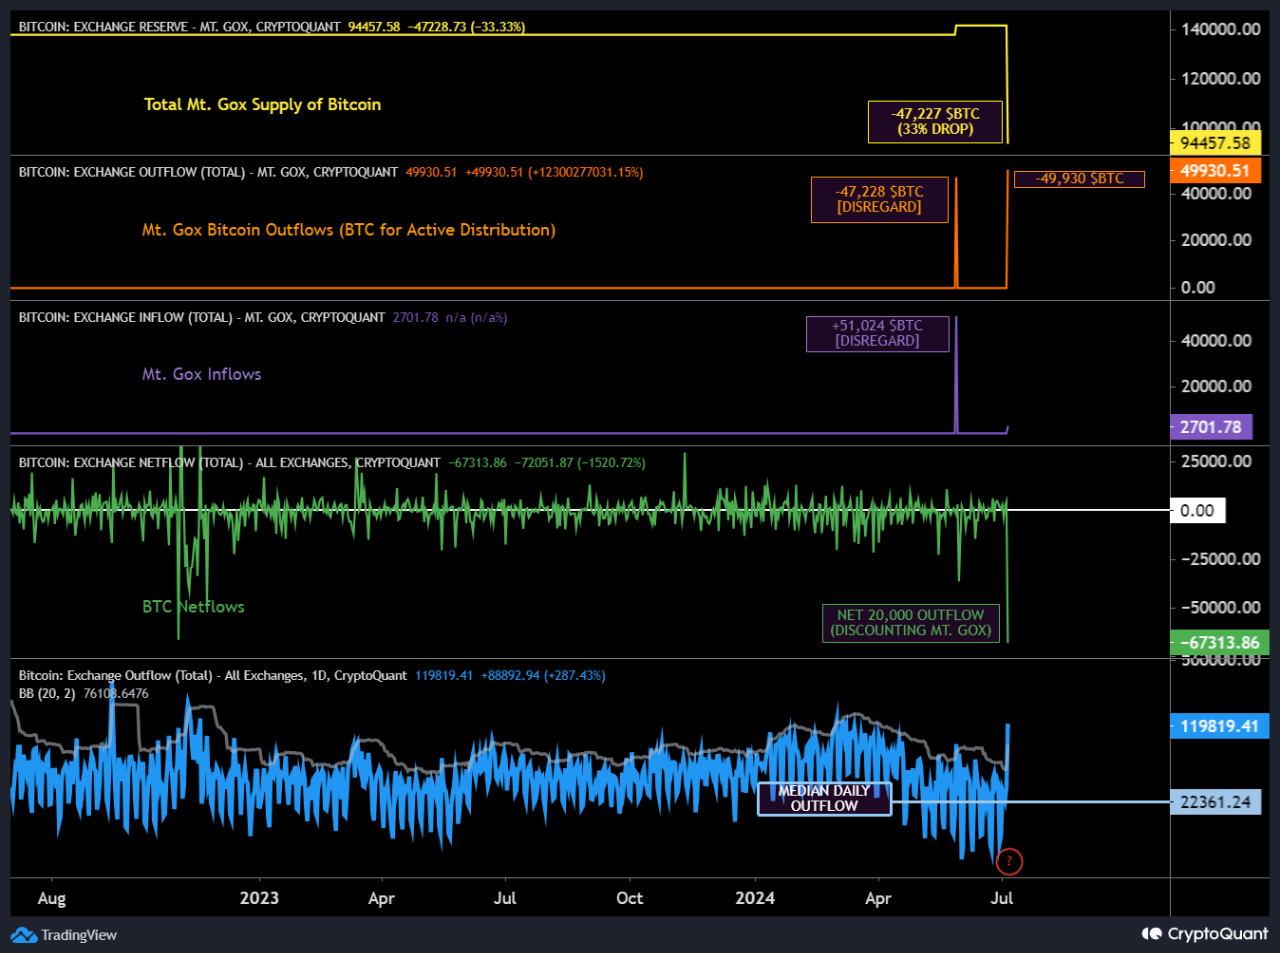
This dashboard provides several insights:
1. Total Supply of Mt. Gox BTC: Approximately 33% of the total supply (~47,000 BTC) has been set aside for distribution.
2. Mt. Gox BTC Outflows: Logs BTC leaving their holdings, indicating preparation for distribution.
3. Mt. Gox BTC Inflows: Tracks any inflows to Mt. Gox reserves, which is rare but possible.
4. BTC Netflows: The net result of daily inflows and outflows, a crucial secondary metric indicating market absorption capacity. Recently, there's been an average net positive flow of around 150 BTC daily, indicating a weakly bearish trend with more BTC coming in than leaving exchanges.
5. BTC Total Daily Outflow: Raw outflow numbers suggest implied buying pressure. This has been trending towards bear market levels, correlating with bearish sentiment driven by Mt. Gox, Germany, and other uncertainties.
Final Thoughts:
Netflows currently suggest an inability to absorb significant BTC inflows. If large-scale deposits occur from Germany or Mt. Gox BTC holders, prices could drop into the $40,000 range or even the upper $30,000s in a worst-case scenario.
Looking purely at numbers, the market can't absorb significant more BTC inflows, but small sales, say a few hundred more a day, won't have a significant impact on price. OTC deals could also influence the trend.
Improvements in macroeconomic sentiment, such as recent promising US inflation data, or the upcoming Ethereum ETFs, could improve market sentiment and the capacity to absorb more BTC selling, suggesting a potentially bullish Q4-24.

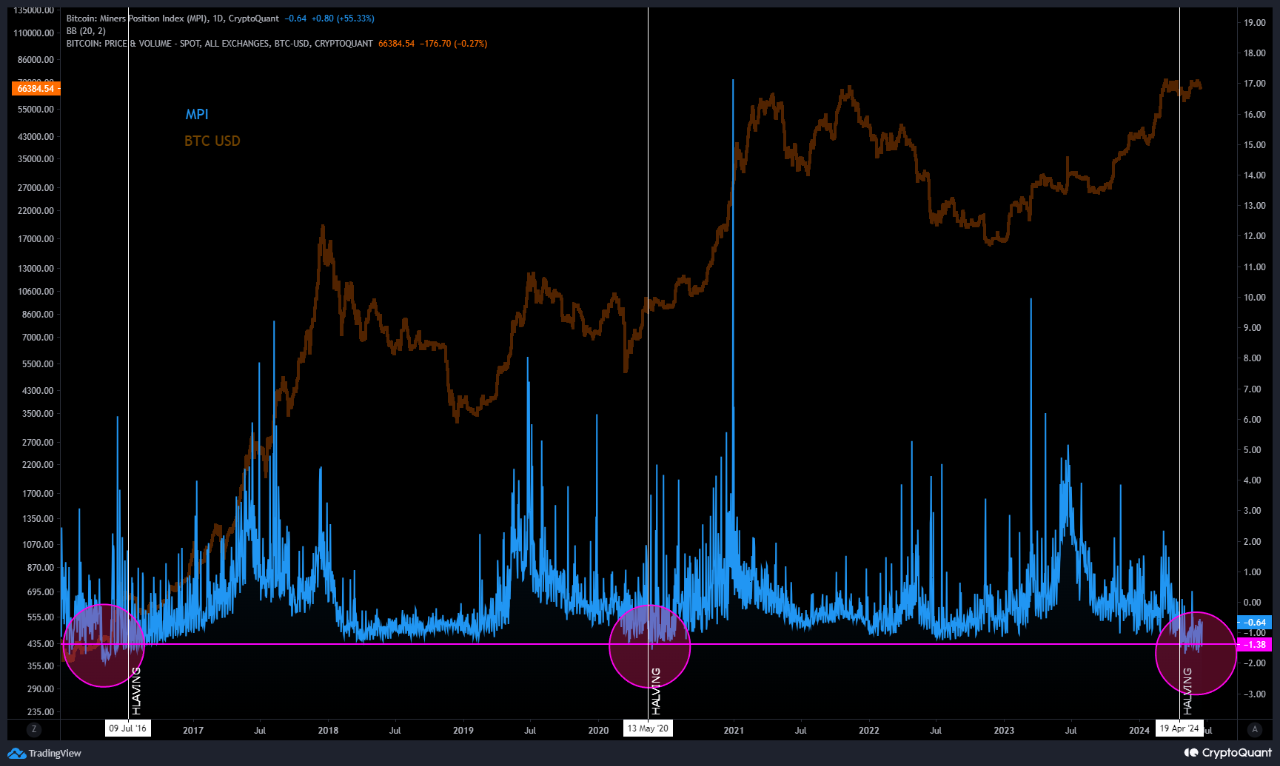
View original →Summary: After the Miner Position Index (MPI), which measures implied miner sell pressure, reaches its cycle low— likely below 1.4— the bull run resumes. This process can take many months.
Post-halving is a challenging time for miners, as their struggle to adapt to lower rewards can produce volatility in miner flows, negatively impacting prices on shorter timeframes, which can produce or aggravate mid-cycle slumps.
Once the MPI stabilizes post-halving and reaches its lowest historic range (below 1.4), it correlates with the end of the mid-cycle slump. This is typically followed by a gradual, then parabolic, second half of the bull cycle.
Of course its not an immediate up-only, and other factors play into the timing and duration.
Also consider that Bitcoin is in the midst of a prolonged consolidation period post-halving, and such large consolidations typically lead to significant expansions.
We also observe inflation data declining at the end of a rate cycle, coinciding with a U.S. election where, for the first time, crypto is an increasingly bullish topic, and U.S. ETFs for BTC and ETH are finally approved.
All of these factors suggest an incredible and rare confluence of bullish conditions.

View original →Miner holdings of Bitcoin are in decline, down 50% from highs. It was over 5,000 days, or 14 years, since miner reserve of Bitcoin was this low.
To give some context:
14 years ago Satoshi was still active on the Bitcoin project, no altcoins existed yet, Obama was President, and it would be another 10 years until Michael Saylor and MSTR bought their first Bitcoin.
Compound this with higher demand, lower inflation, and we continue marching towards an epic supply crunch in the coming years.
Companies and investors with foresight enough to understand the long term implications of supply will do extremely well. Slowly.. then all at once.


View original →Looking at MPI & Puell Multiple (miner selling and profitability).
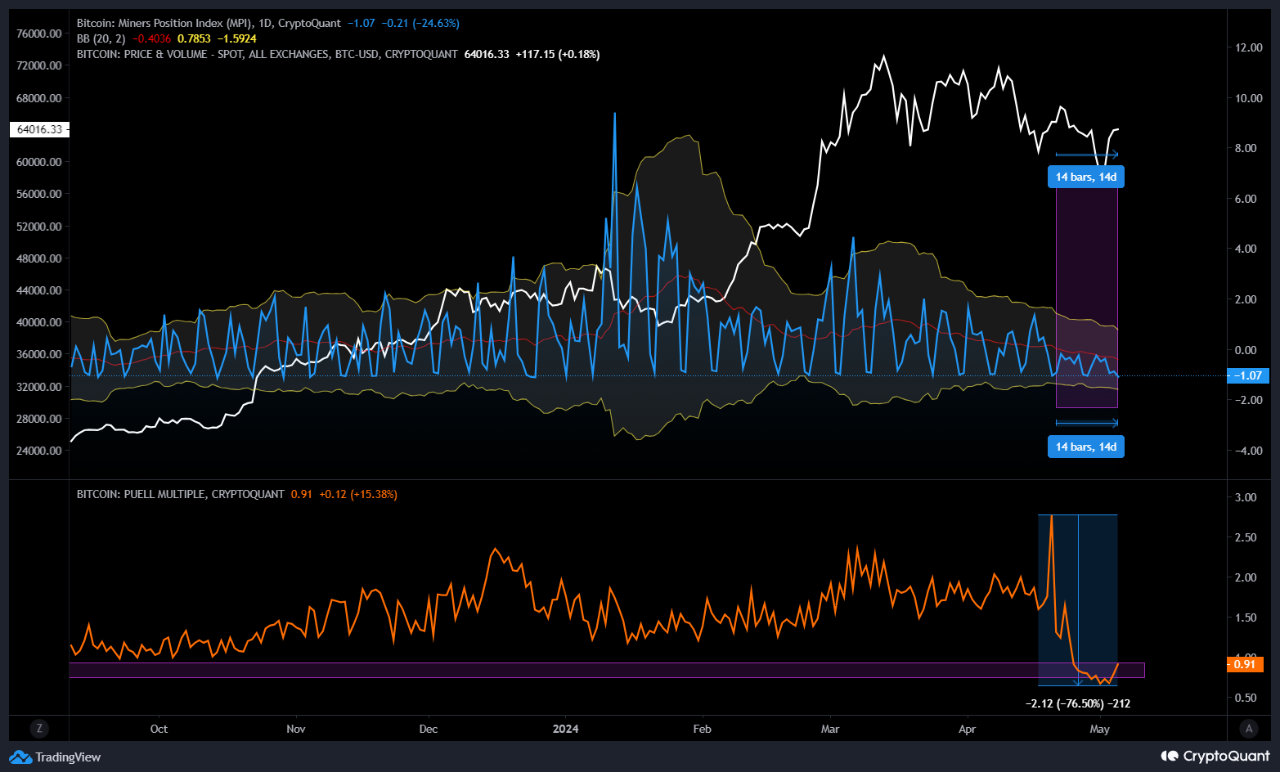
Post-halving we are in the longest period of reduced miner sell pressure since Bitcoin was ranged along $16k (14 days and counting). Miners are also logging their lowest revenue in a year.
With ETF flows rising, and odds increasing of a rate cut in Q4, miners are likely accumulating in anticipation of higher prices to sell into.

View original →The past couple weeks were euphoric, we broke new highs on Bitcoin, altcoins were running hot! But once again we find ourselves under the previous high.
Is the bull market over? There is no major indication the bull market is over. Historically, Bitcoin cycles never stopped at previous all-time highs (ATH), and with the ETF and Halving momentum, there is no reason to expect that now.
In 2020 it took nearly two months to escape the previous ATH range. If you are confident we go higher (as I am), this is an excellent opportunity to stack more or rotate a into high performers.
Lets review some popular data points:
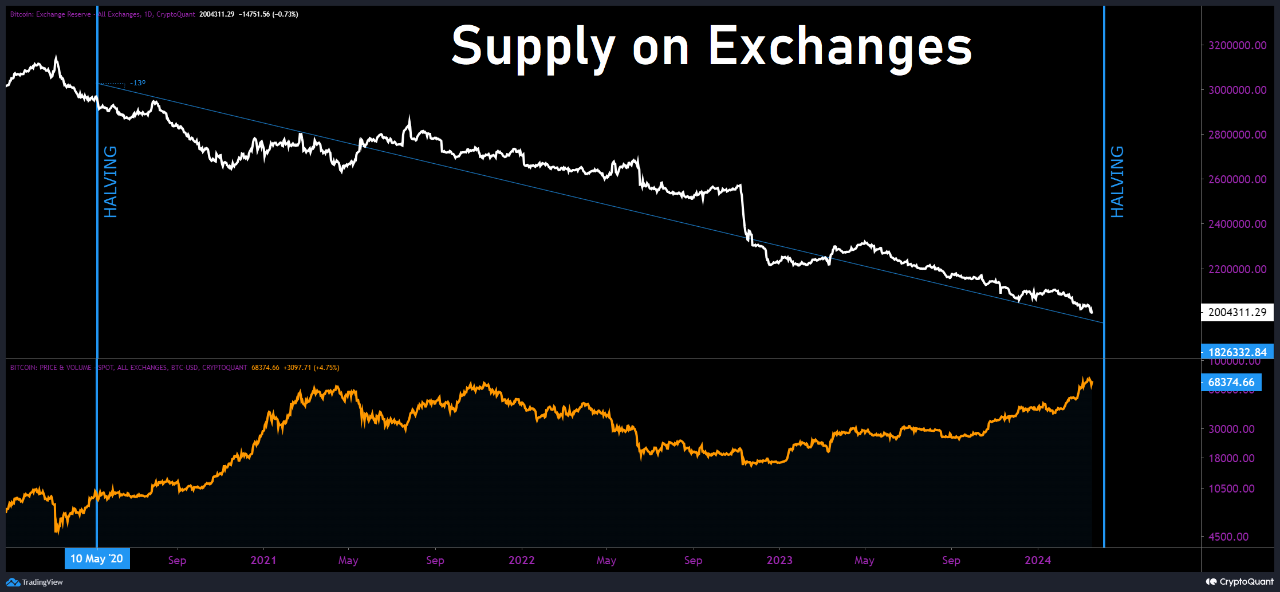
1. Supply of Bitcoin on Exchanges: nearly 40% drop in 4 years, and no signs of slowing into 2024 Halving.
More Bitcoin is being bought and HODL’d than is being mined, and this has been the prevailing trend since 2020. As we know with commodities, scarcity boosts perceived value. This new trend suggests that we won't see a pronounced rise in supply towards the end of the cycle.
2. Net Unrealized Profit and Loss (NUPL): moderately bearish on LTF, but room to run on HTF.
NUPL cooled off with the current correction but is still trending into the greedy range of “belief,” where traders are mostly in-profit, but holding and expect more upside.
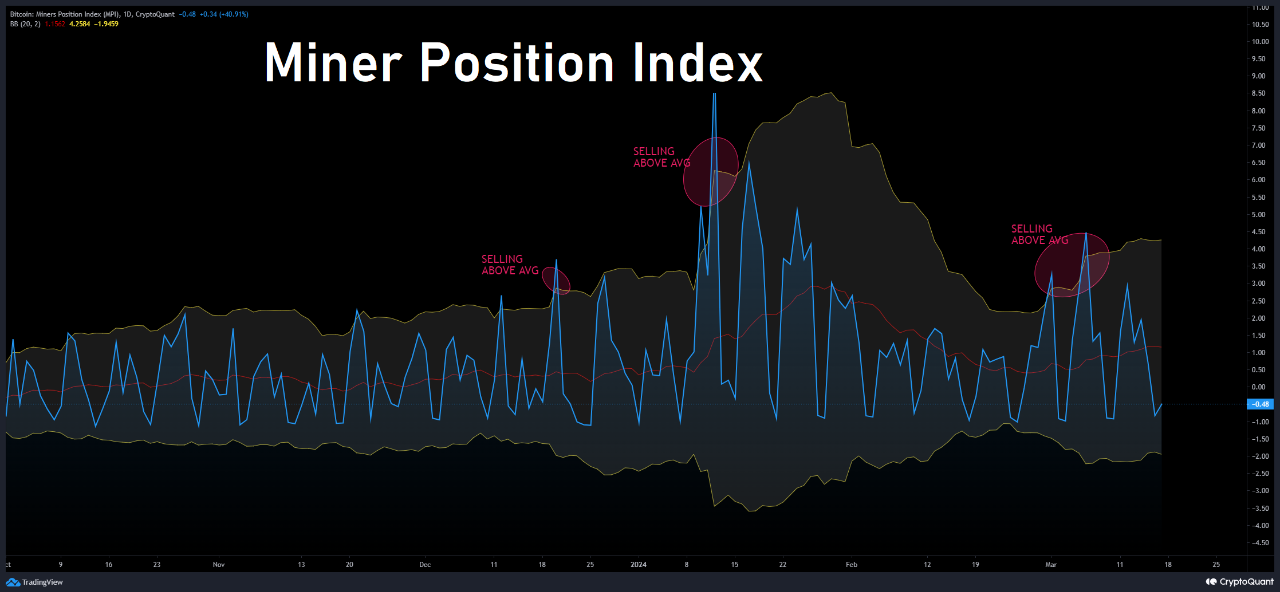
3. Miner Position Index (MPI): low selling pressure over the past two weeks, no signs of major selloff.
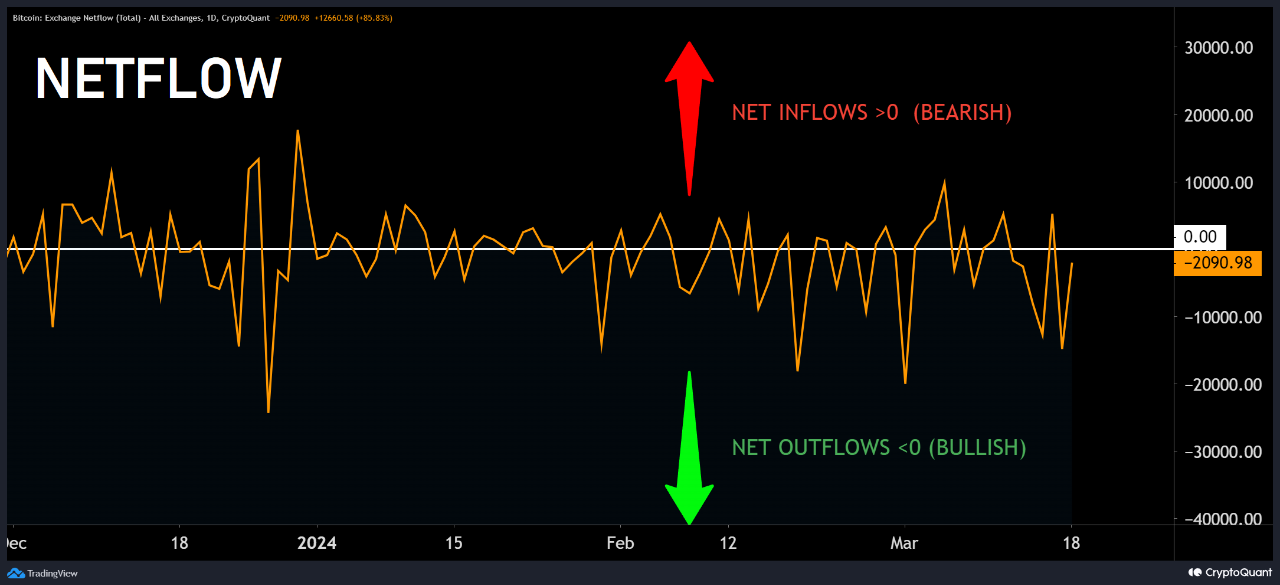
4. Bitcoin Netflow (All Exchanges): LTF rise in sell pressure, but flows remain overall bullish in recent weeks, even through this correction.
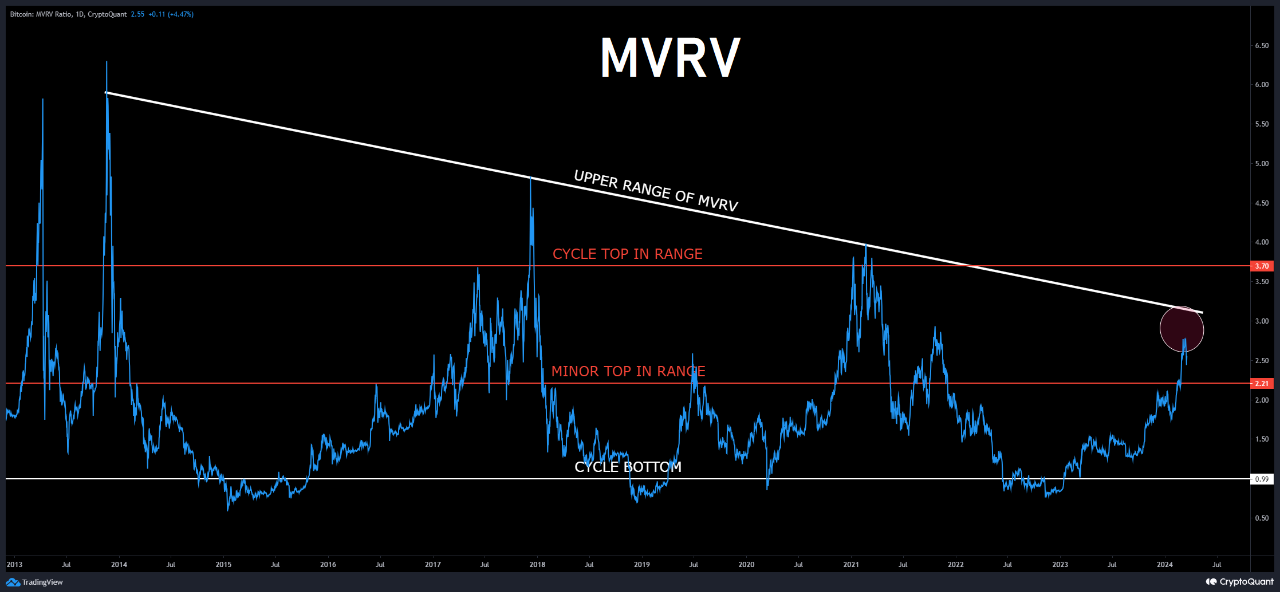
5. Market Cap to its Realized Cap (MVRV): cooled off after a small rejection along 2.8 minor resistance. For the first time, the long term (2013) diagonal resistance is lower than historically bearish horizontal level (red) of ~3.7 for cycle tops. Monitor both this cycle.
Sentiment:
1. Coinbase App: Dropped >200 ranks to ~500 globally; 50 in finance
2. Google Trend "Bitcoin" saw a strong drop after reaching 3rd highest level in 3 years.

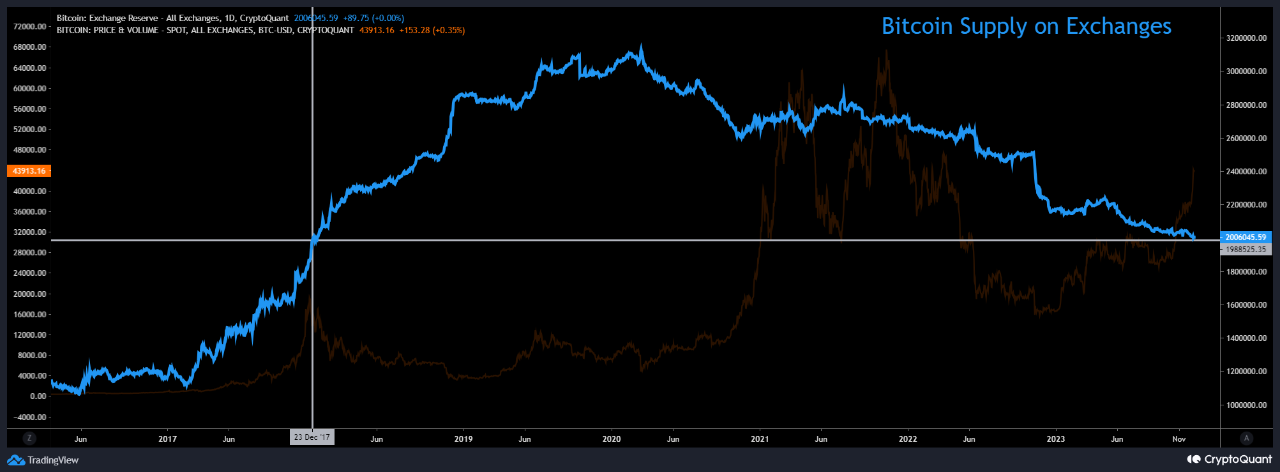
View original →This week reported the lowest supply of Bitcoin on centralized exchanges in six years. We are in the 45th month of diminishing supply.
For the first time, supply returned to 2017 levels.

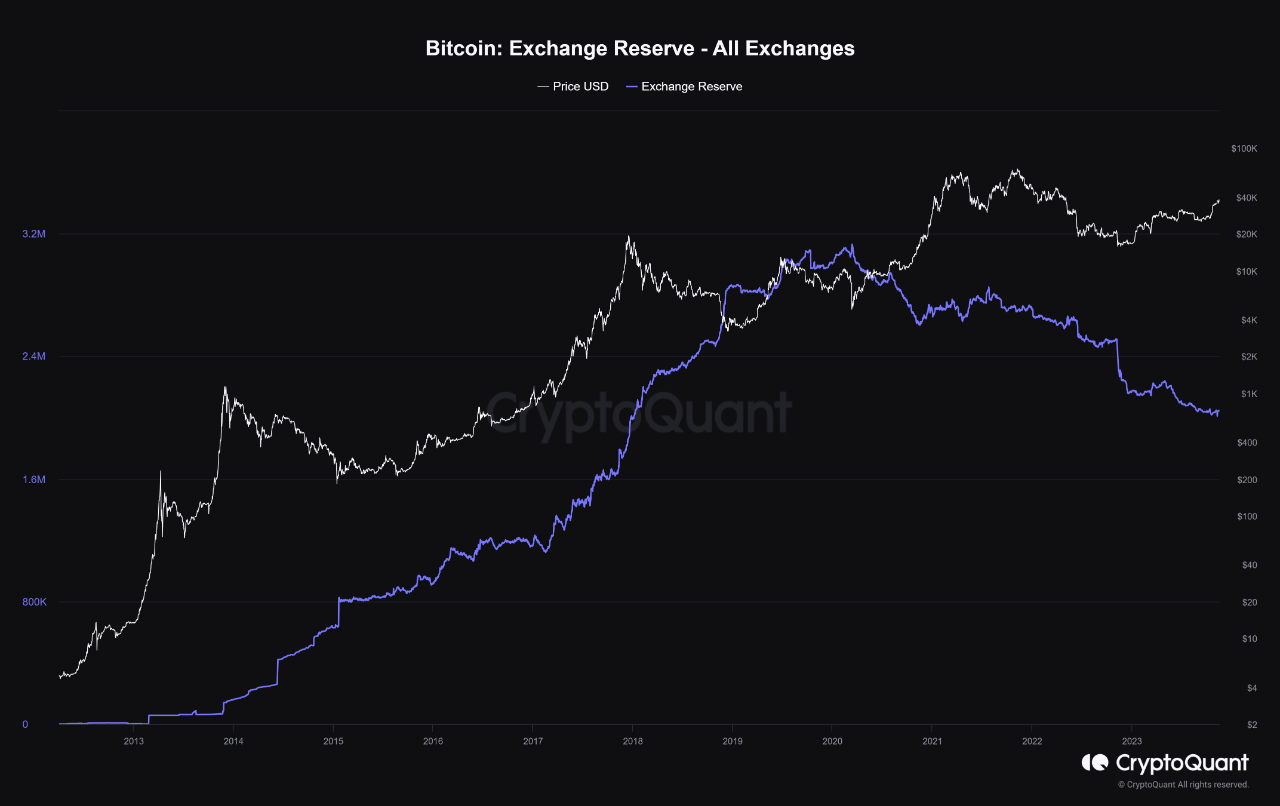
View original →Say what you will about COVID, but something in 2020 led the crypto market towards true adoption (finally).
That is when the supply of Bitcoin on exchanges flipped from inflationary to deflationary. Collectively they shed 36% of BTC supply from 2020 highs.
A confluence of factors at play-
Higher emissions and less demand in the first decade saw supply rise. I consider 2018 the last "early" cycle. The cat was out of the bag in 2020>2021. Remember all the Superbowl ads?
Since then, demand has outstripped supply, Bitcoin finally (truly) entered popular culture.
At this rate, a supply crunch seems inevitable.
I can't speculate how much will go to large funds and institutions for the ETFs, and a lot of that will likely be custodied by entities like Coinbase, but that will take a lot of Bitcoin out of public circulation.
At the current rate, even if ETFs don't expedite the drain on exchange supply, we'll still be trending towards near zero within the decade.

View original →

