Bearish(Nuanced)BTC
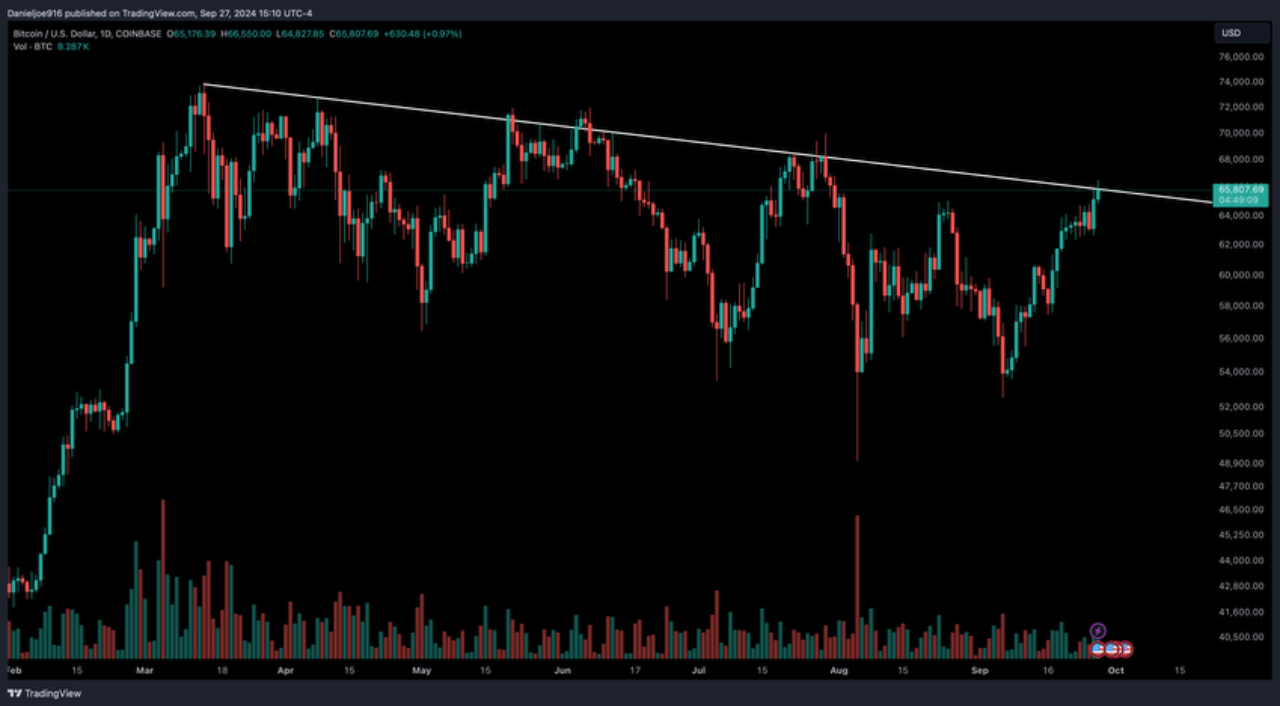
9/27/2024 Bitcoin has consolidated for over 6 months now, printing lower highs and lower lows. I follow the Coinbase Premium Index closely, to gauge buy and sell pressure from the US market.
In general, strong US buy pressure tends to push the Coinbase Premium Index higher above 0, while strong US sell pressure pushes the index below 0.
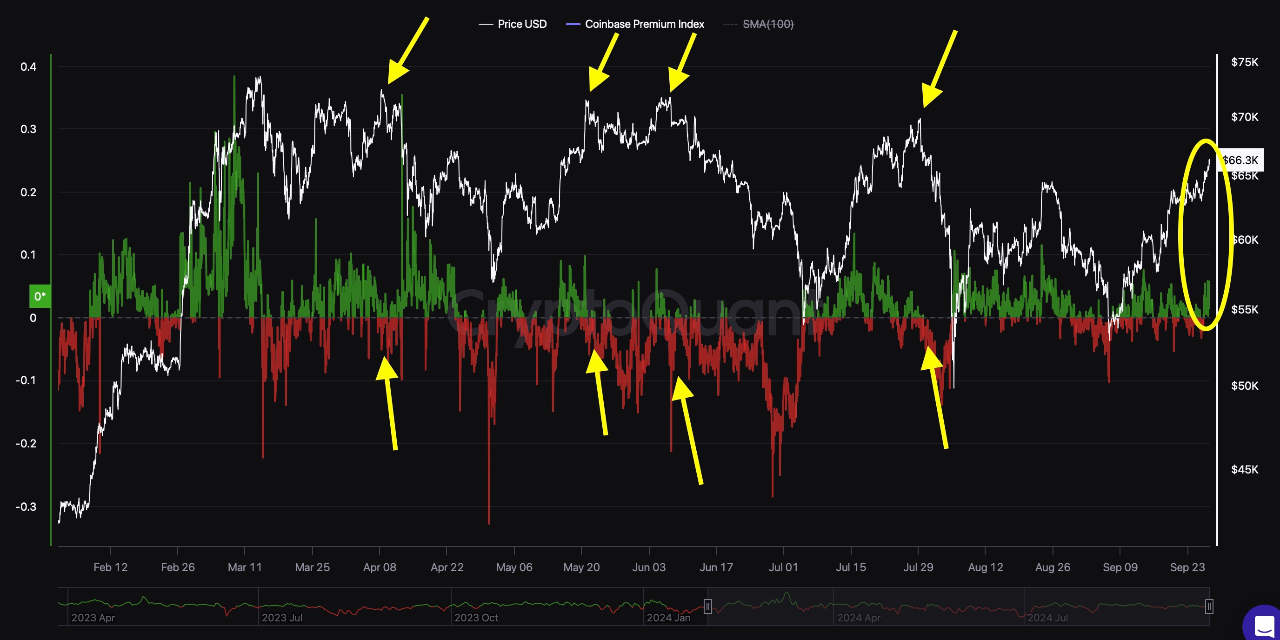
I noticed a trend forming with every lower high being printed during the past 6 months. Every time BTC formed a lower high, the Coinbase Premium Index was below 0, suggesting buy pressure was drying up, being overwhelmed with sellers.
The chart below highlights these occurrences (on an hourly chart). In my opinion, in order for Bitcoin to breakout of the 6 month consolidation, and especially the multi month downtrend line around $65.9k (as of 9/27/24), we need to see the Coinbse Premium firmly flip positive and remain positive.
In other words, we need strong and consistent US buy pressure to come in at these levels to trigger a breakout.
The global macro backdrop is very bullish when considering global central banks have been easy monetary policy, the Federal Reserve just cut the Fed Funds Rate by 50 bps, DXY has been declining, with the market about to enter Q4, a historically bullish period, especially on a post halving basis.
With leverage, anything can happen in crypto, so I wouldn't be surprised to see near term liquidations to the upside and downside. We should expect a breakout higher in the next few weeks if not months as Bitcoin enters Uptober, if we see a positive Coinbase Premium Index along.
Keep in mind, the US election is very uncertain, so its possible the next significant leg higher for Bitcoin could come after the election, when certainty returns to the market.

View original →With Bitcoin entering September, a historically volatile month after a 5 month long consolidation, it might make sense for investors to consider allocating to publicly traded Bitcoin miners, especially with Bitcoin's historically favorable performance in Q4 during halving cycles.
Not all publicly traded mining companies are the same. It is important to analyze a variety of onchain, quantitative, and qualitative metrics to identify which miners are best positioned for the rest of the bull market.
I will be starting a series of posts covering how I analyze publicly traded Bitcoin miners.
Today, we will be covering CleanSpark (Ticker:CLSK), one of the largest US publicly traded Bitcoin mining companies. While a company’s hashrate is important, metrics such as energy cost per kWh, mining efficiency, hash rate growth, liquidity, gross margins, and overall company execution carry greater weight.
With the Bitcoin halving occurring back in April 2024, block subsidies have fallen in half, thereby doubling the cost of production for all miners. This puts more emphasis on miner’s operating efficiency and energy cost, to preserve margins.
When valuing Bitcoin miners, I prefer to look at an adjusted book value per share metric, which factors in various company assets and debt to give a more accurate reading of true book value. With current data, CleanSpark trades at roughly 1.9x book value. As Bitcoin was slowly recovering from the bear market, CleanSpark was trading significantly below book value, representing a multi year opportunity to accumulate shares.
Since then, CleanSpark has roughly maintained it’s 2x book value per share multiple, which I interpret as the market showing confidence in CleanSpark’s strong execution, as its valued at a higher multiple than its competitors.
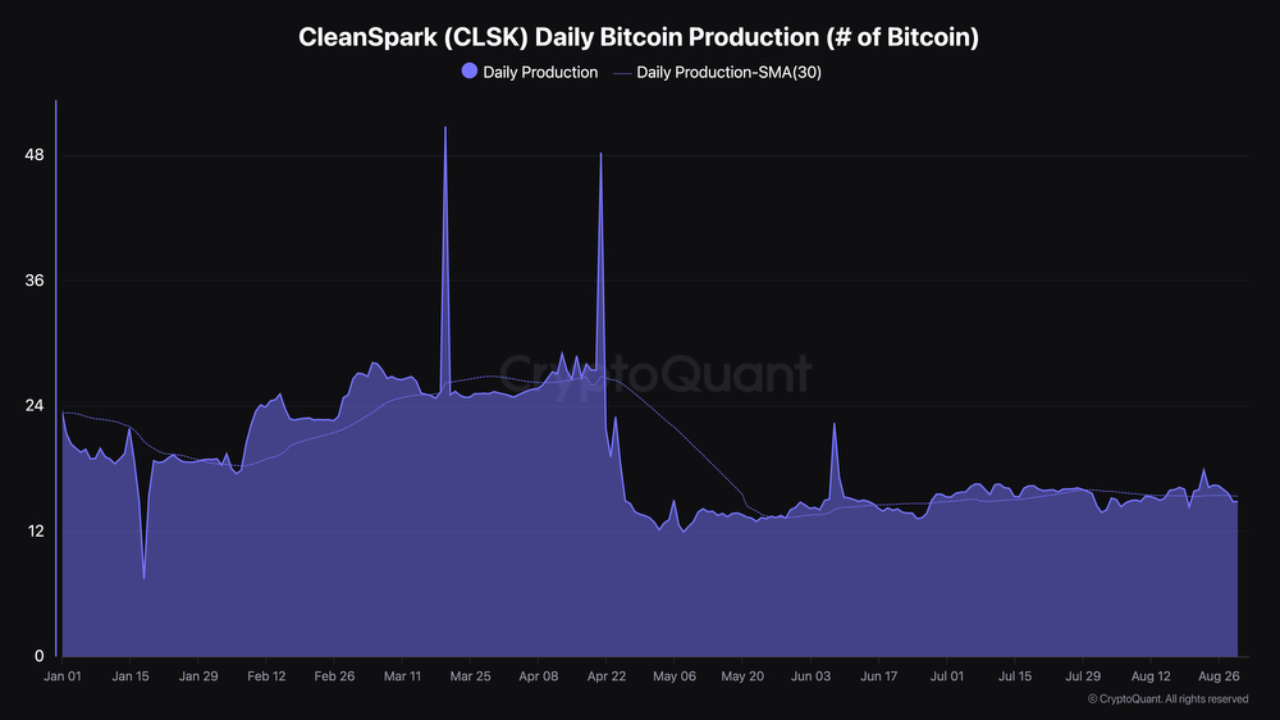
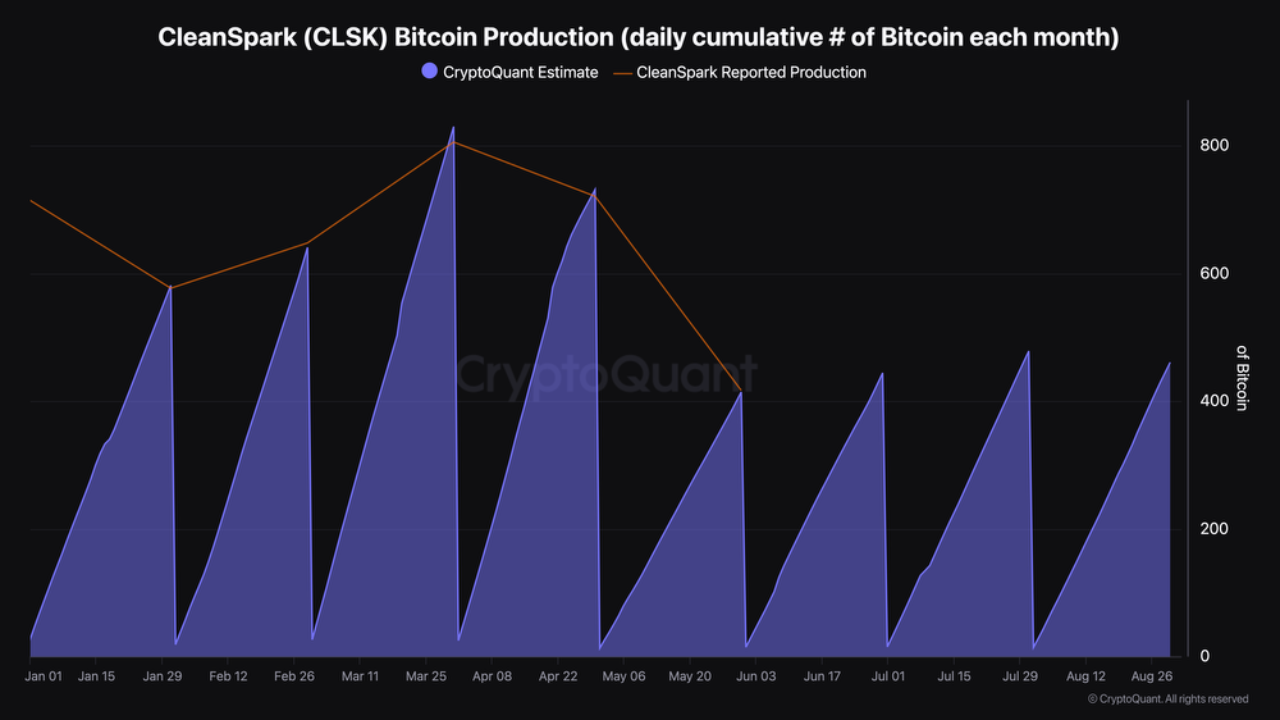
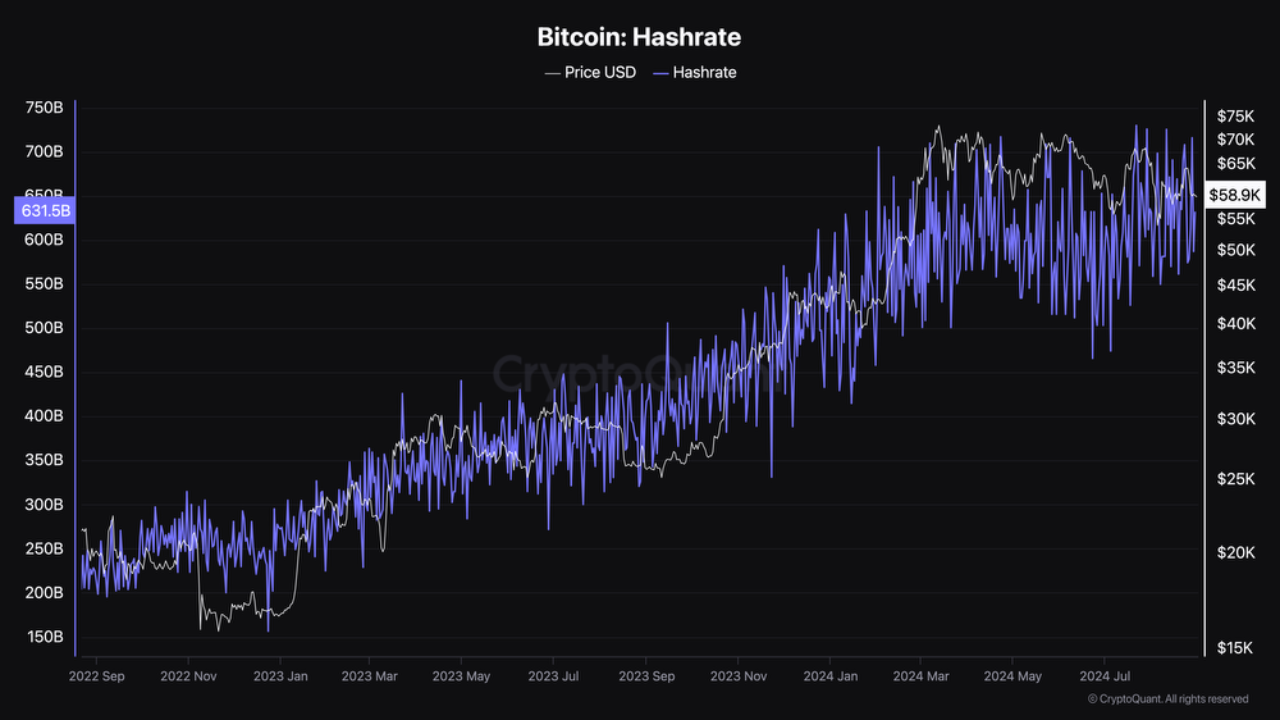
To track daily production, I use CQ’s Mining Companies Dashboard. I find this dashboard very useful because it allows investors to track intra-month performance of miners before the miners post.

View original →
This is a continuation of my previous post covering the Mean Exchange Inflow Sell Signal. To recap, a successful sell signal occurs when BTC price declines by more than 1% within 48 hours after the Mean Exchange Inflow metric (Spot Exchange) crosses above 7 on the hourly chart.
For this update, we will cover Q1 2024, but specifically the post Spot BTC ETF launch period, to see how the sell signal performed with ETFs trading now.
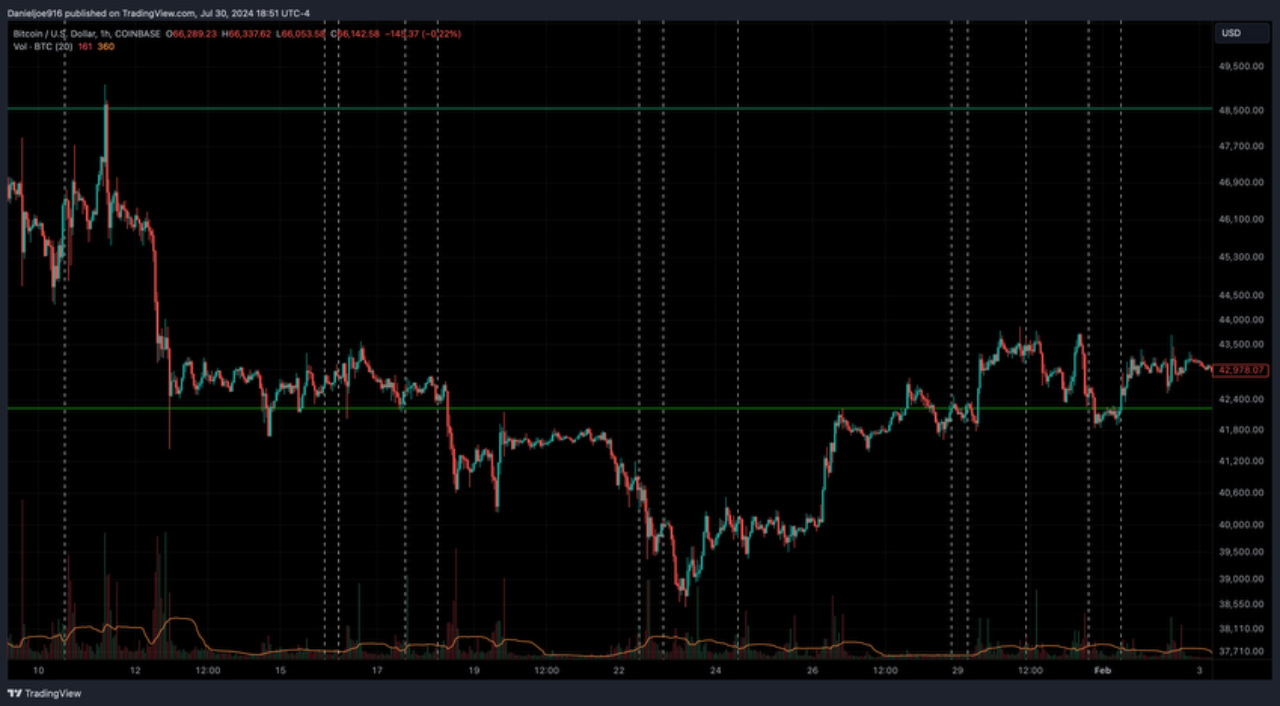
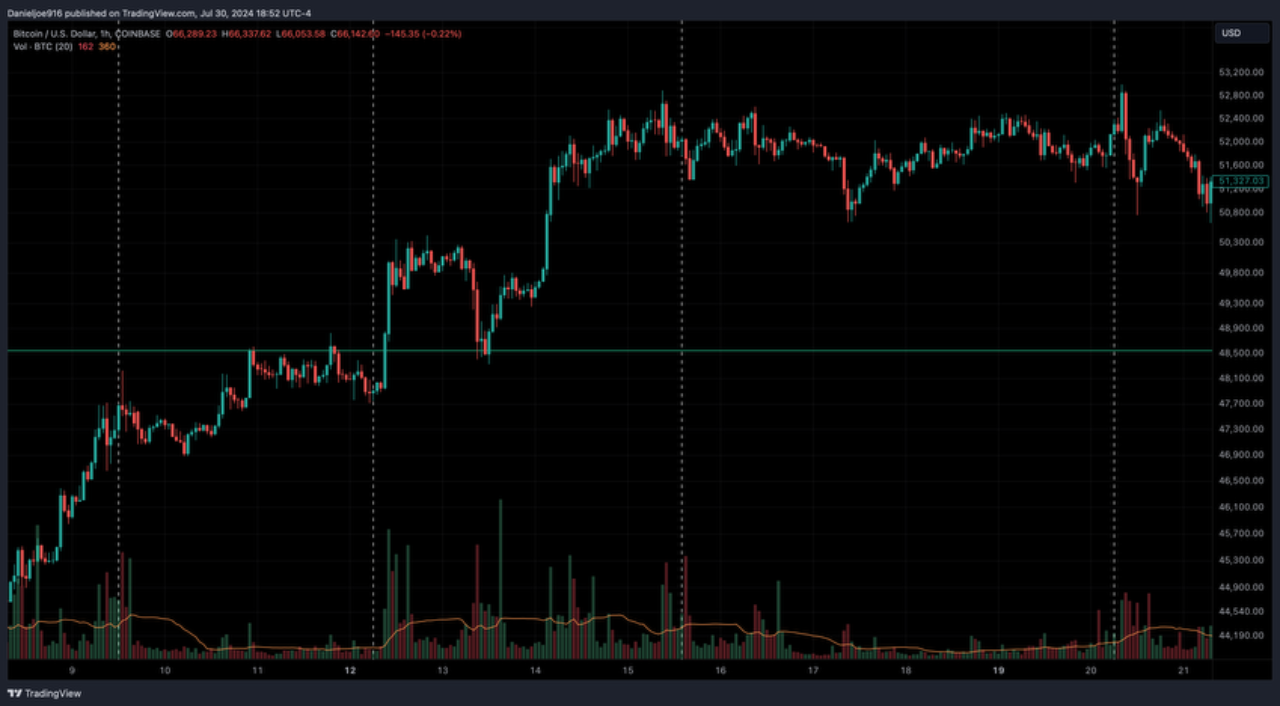
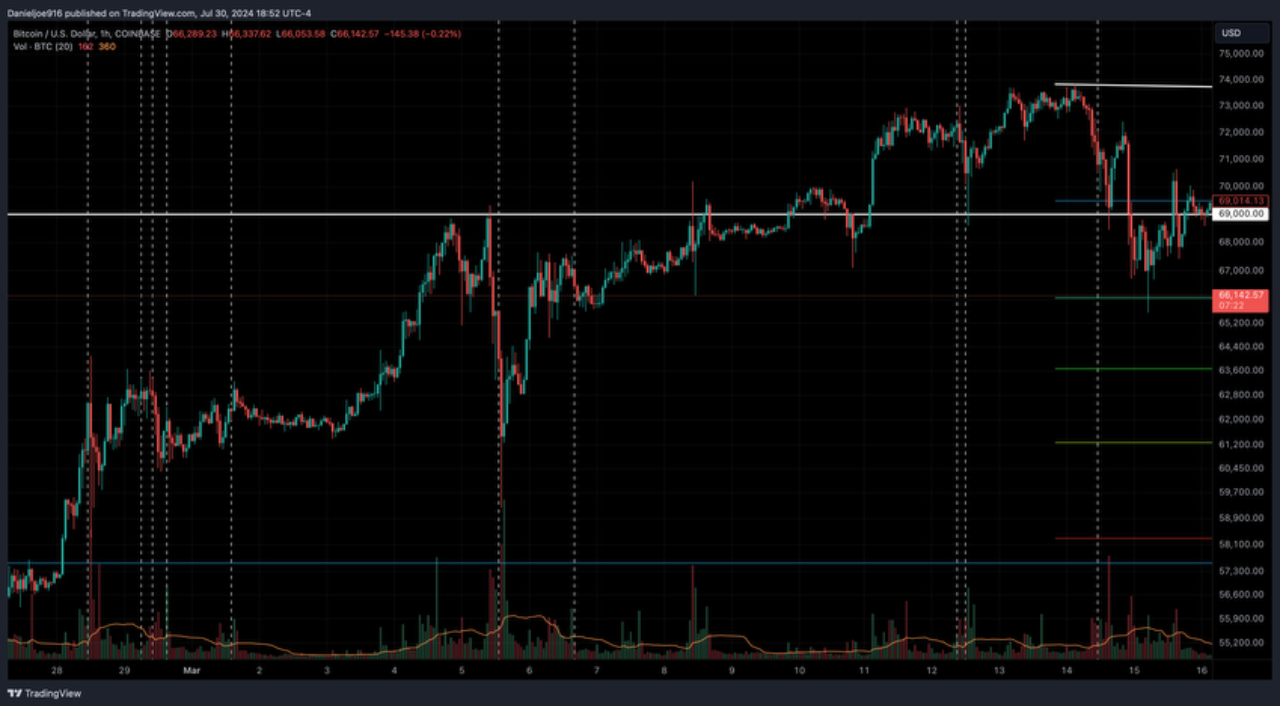
Between January 10th to March 31st 2024, a total of 33 sell signals flashed. 31 out of 33 sell signals were successful, resulting in BTC declining more than 1% within 48 hours of the signal flashing, with a success rate of 93.9%.
The average decline across all 33 sell signals came in at -3.2% while the average decline for the 31 successful sell signals came in at -3.38%.
The largest decline recorded during the Q1 2024 period came in at -9.73%, which occurred on March 5th, 2024. The range of declines for successful sell signals was between -1.05% to -9.73%.
10 out of 33 or 30.3% of the sell signals came in between -1.05% to -1.95%.
The charts below marked with vertical dashed lines show when the sell signals occurred.
In reference to the previous post, from 2017 to January 2024, the Mean Exchange Sell Signal averaged a success rate of 87.69% compared to Q1 2024 coming in at 93.9%. It’s good to see an improvement in accuracy especially with Spot BTC ETF’s launching during the recorded period.
I would like to note, the average decline across successful and unsuccessful signals from 2017 to January 2024 was -5.5% while Q1 2024 came in at -3.2%. Considering the periods analyzed, its not surprising to see, given Bitcoin has matured as an asset class, especially with institutions starting to allocate to Bitcoin through Spot ETFs.
We should expect Bitcoin volatility to decline over the years as Bitcoin grows in market cap and as more institutions and eventually sovereigns allocate to Bitcoin.
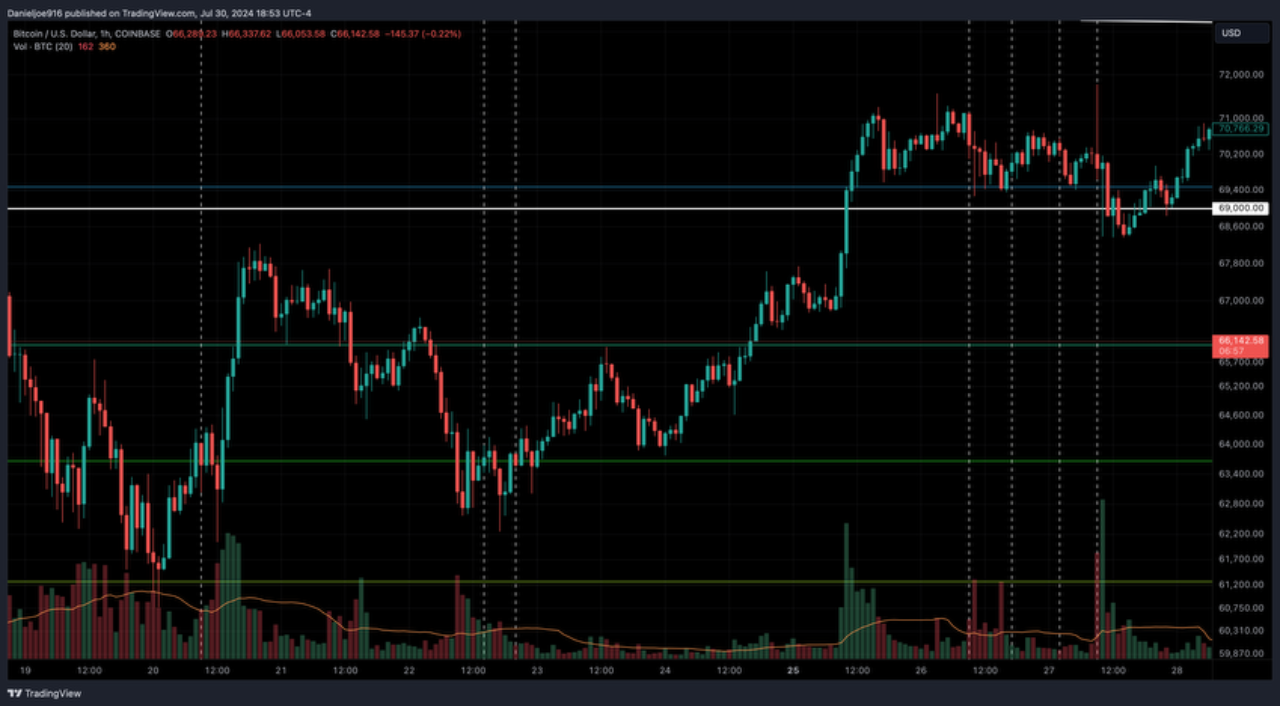

View original →This will be a series of posts covering my Mean Exchange Inflow Sell Signal backtesting results.
The Mean Exchange Inflow Sell Signal I posted about a while ago occurs whenever the mean exchange inflow on spot exchanges crosses above 7 BTC on the hourly time frame.
During my initial backtests from the last 24 months, it appears this signal can be quite helpful at identifying potential incoming sell pressure. To recap, a successful sell signal occurs when BTC declines more than 1% up to 48 hours after the signal flashes. I measured the % decline from where Bitcoin was trading at when the signal flashed, to the trough (deepest point of decline) within a 48 hour period.
I was able to backtest all the way back to 2017, which captured the second half of the 2017 bull market.
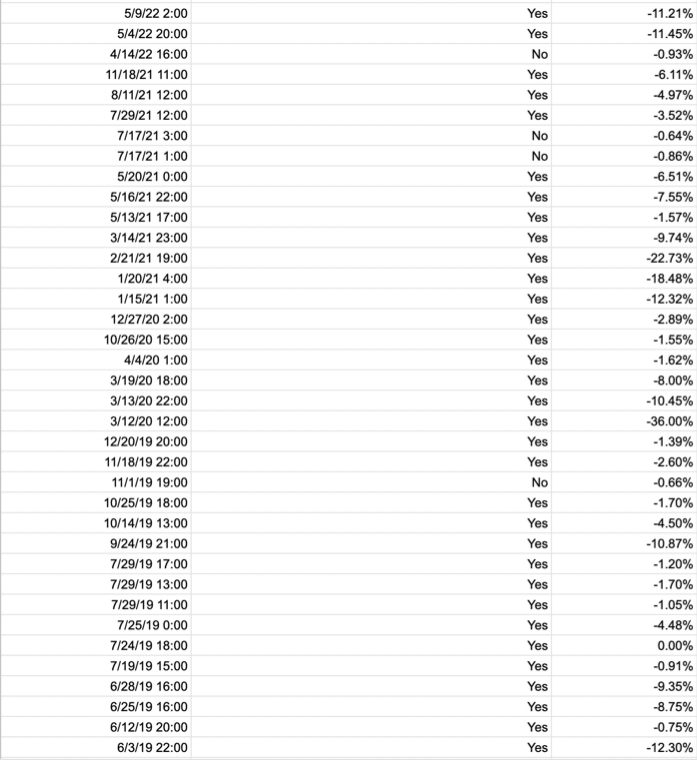
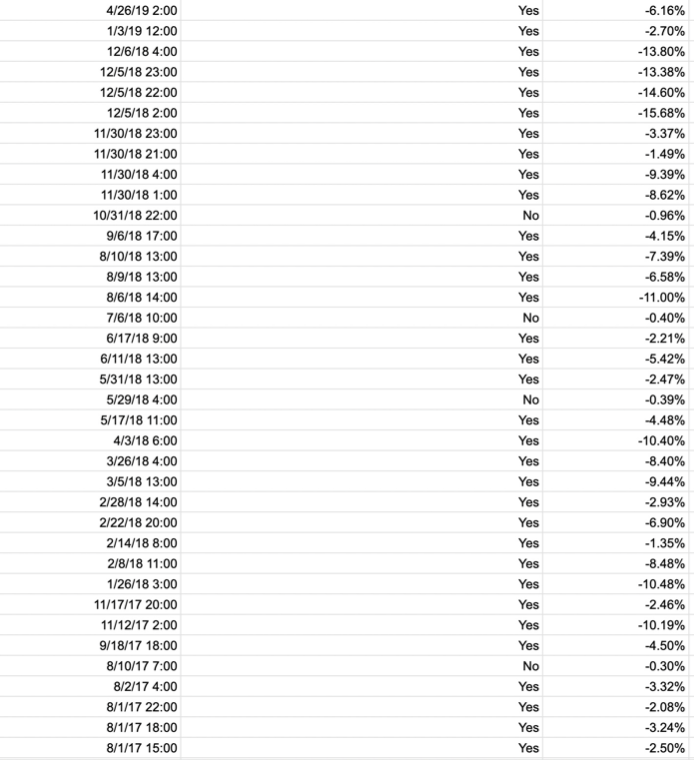
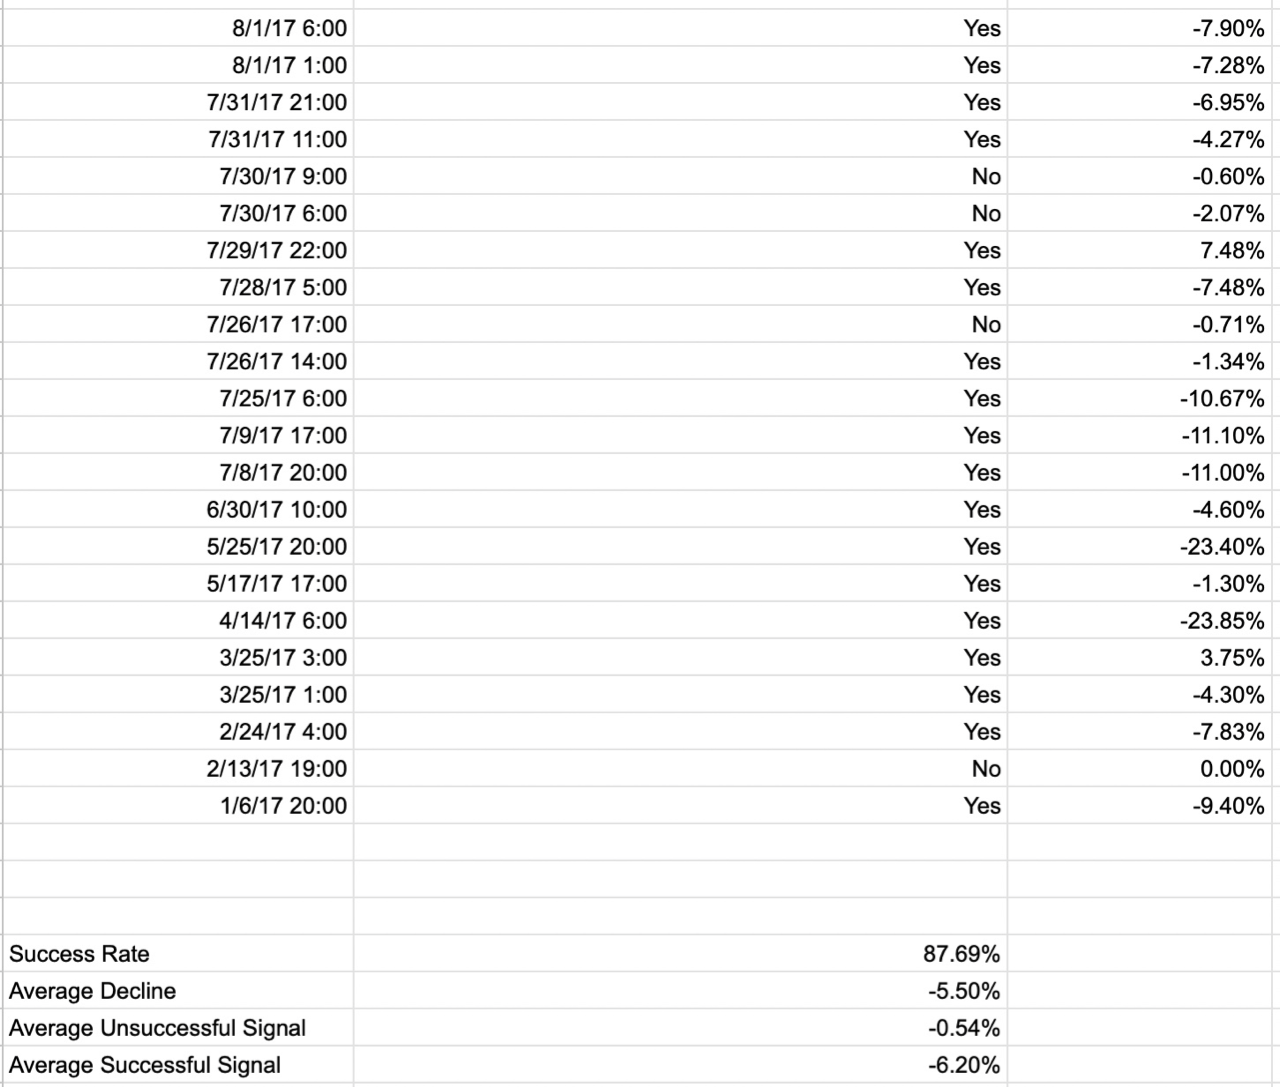
From January 2024 to early 2017 the Mean Exchange Inflow Sell Signal occurred 130 times.
So far, the success rate has been 87.69%. Of the 130 signals recorded, 114 signals were successful while 16 signals were not.
The average % decline Bitcoin price made 48 hours after the signal flashed for both successful and unsuccessful signals was -5.5%.
For successful signals, Bitcoin price made an average decline of -6.2%. Meanwhile the average unsuccessful signal was -0.54% (defined as a decline of less than 1% within 48 hours of the signal flashing).
The deepest Bitcoin price declined after the sell signal flashed was -36%, which occurred during the March 2020 crash.
24 out of the 130 sell signals (or 18.46%) resulted in Bitcoin price declining more than 10% within 48 hours.
I found it very interesting how the Mean Exchange Inflow sell signals managed to identify near term tops in Bitcoin in some instances. I will dig deeper with charts in my next post breaking down how the Mean Exchange Inflow performed during previous bull and bear markets.
Now that BTC Spot ETFs are trading, I am interested to see how the Mean Exchange Inflow continues to perform.
The screenshots show the results.
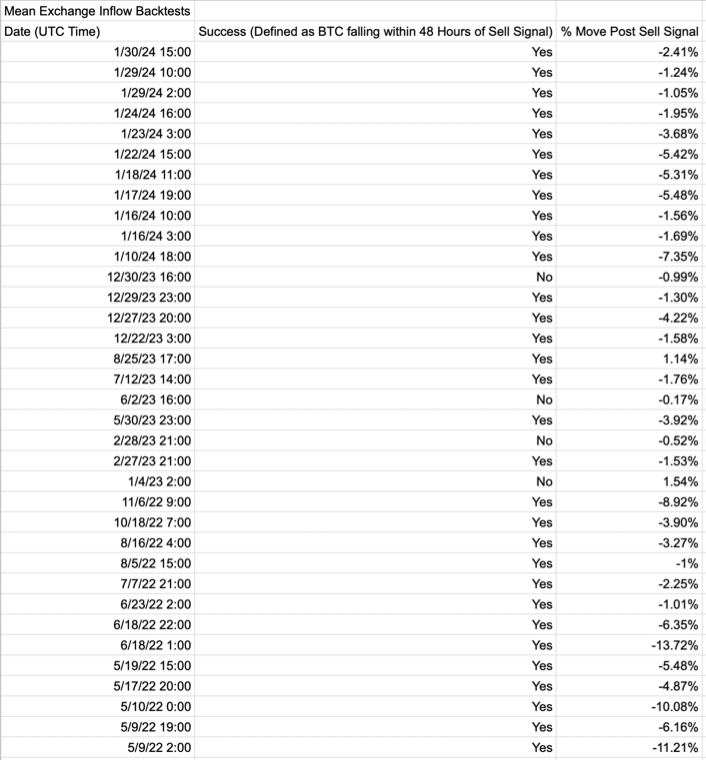

View original →In today’s Quicktake, we will be covering historical data that strongly suggests institutions are firmly here and entering the 2024 bull market.
The yellow line shows Exchange Depositing Transactions, the blue line is the Mean Exchange Inflow metric, while the orange line is Bitcoin price.
During the previous bull market in 2021, we saw a surge in Exchange Depositing Transactions, with a below average reading in Mean Exchange Inflow. High exchange depositing transactions with a lower Mean Exchange Inflow strongly suggests the previous bull market had retail investors speculating on price, with not much activity from the large institutions we see today.
The 2022 bear market led to a steady decline in the number of Exchange Depositing Transactions and retail interest, likely due to the implosion of crypto companies and tokens.
After things settled, notice how in the later part of 2023, the Mean Exchange Inflow began to slowly trend higher even with a continuing decline in Exchange Depositing Transactions. This suggests larger players began entering the market, with higher volume activity, causing the Mean Exchange Inflow to rise.
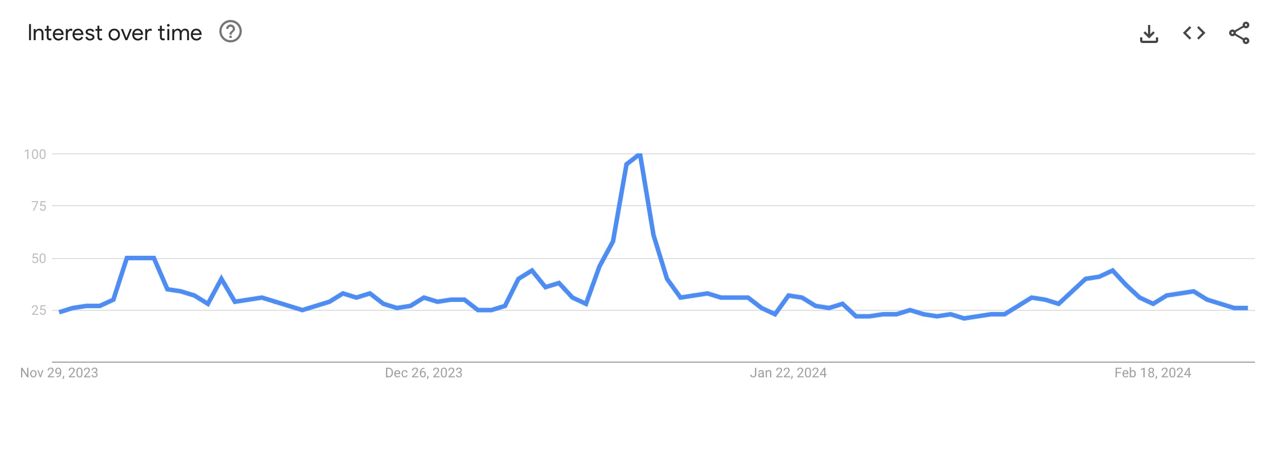
The consistent downtrend in Exchange Depositing Transactions can also suggest that retail investors have not entered Bitcoin yet. Google search trends show a low reading on Bitcoin, despite price nearing the all time highs in 2021.
The Spot ETF flows in my opinion, will influence the Mean Exchange inflow metric as we are seeing a lot of volume traded through the Spot ETFs. I expect the Mean Exchange Inflow metric to continue trending higher, as more investors enter Bitcoin through the ETFs as the bull market continues.
The trend of this data along with new records in CME BTC Futures Open Interest suggest further upside for Bitcoin.


View original →This is a follow up to my previous post on the Mean Exchange Inflow Sell Signal. To recap, when the Mean Exchange Inflow crosses above 7 BTC on an hourly basis, this has historically led to incoming sell pressure within a few hours to a few days. Mean Exchange Inflow refers to the mean amount of coins per transaction on a specified period. In this case, we are measuring in hours.
For today’s analysis, I decided to run a backtest starting from January 10th, 2024, the day before the Spot BTC ETFs launched and also when a sell signal flashed. I was curious to see how the Mean Exchange Inflow sell signal would perform now that the 9 Spot BTC ETFs are trading.
To be clear, this is for research purposes only. This is not financial advice.
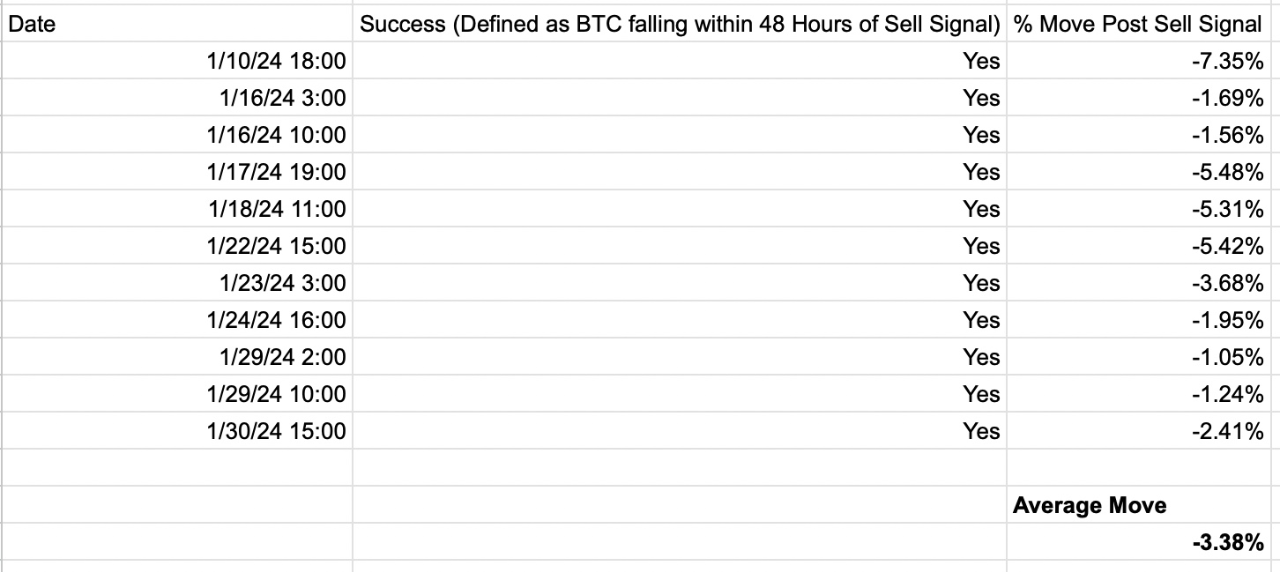
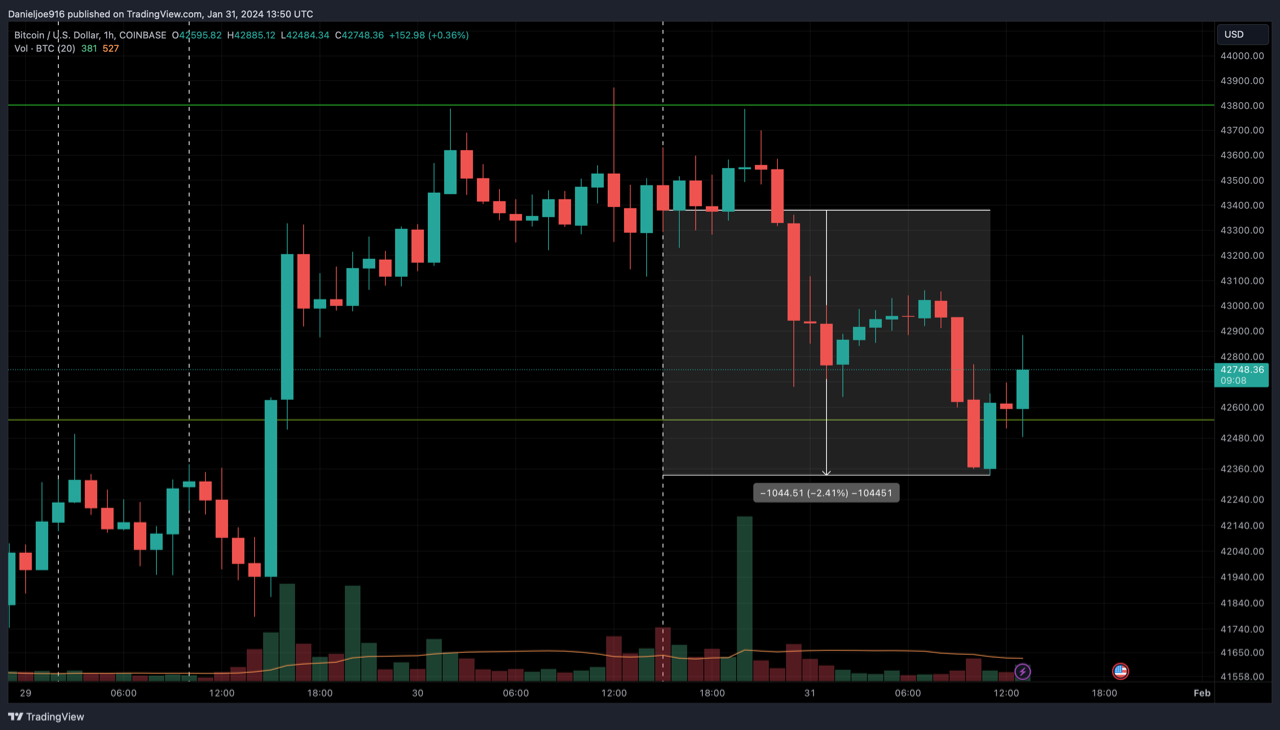
I defined a successful sell signal as BTC price moving lower by more than 1% within a 48 hour window from when the sell signal flashed. In the exhibit below, I measured the percentage depth of Bitcoin’s pullback from when the sell signal flashed within the 48 hour period.
Since January 10th, 2024, 11 sell signals have flashed. The average move lower came in at -3.38% within a 48 hour window. The largest drawdown recorded during this period was -7.35%.
The most recent sell signal flashed on 1/30/24 at 15:00 UTC time, leading BTC to decline by -2.41% at the trough.
Overall, I think this sell signal is helpful so far. I will continue tracking the Mean Exchange Inflow sell signal’s performance as the Spot BTC ETFs continue to trade.
As always, do not rely on one metric or indicator, its best to look at a variety of indicators that can help provide context.

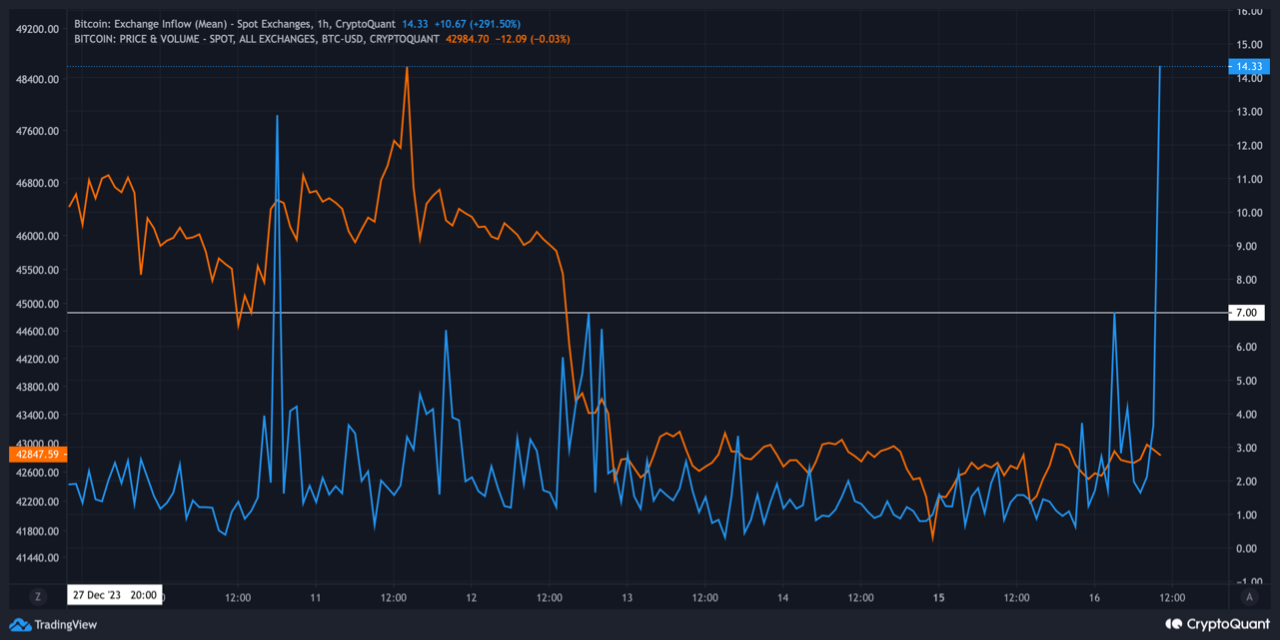
View original →In my previous post, I shared a simple analysis by looking at the hourly Mean Exchange Inflow. My analysis has found that a Mean Exchange Inflow reading above 7 is a warning of incoming sell pressure, possibly within a few hours to a few days. I backtested this going back a few years and its quite accurate.
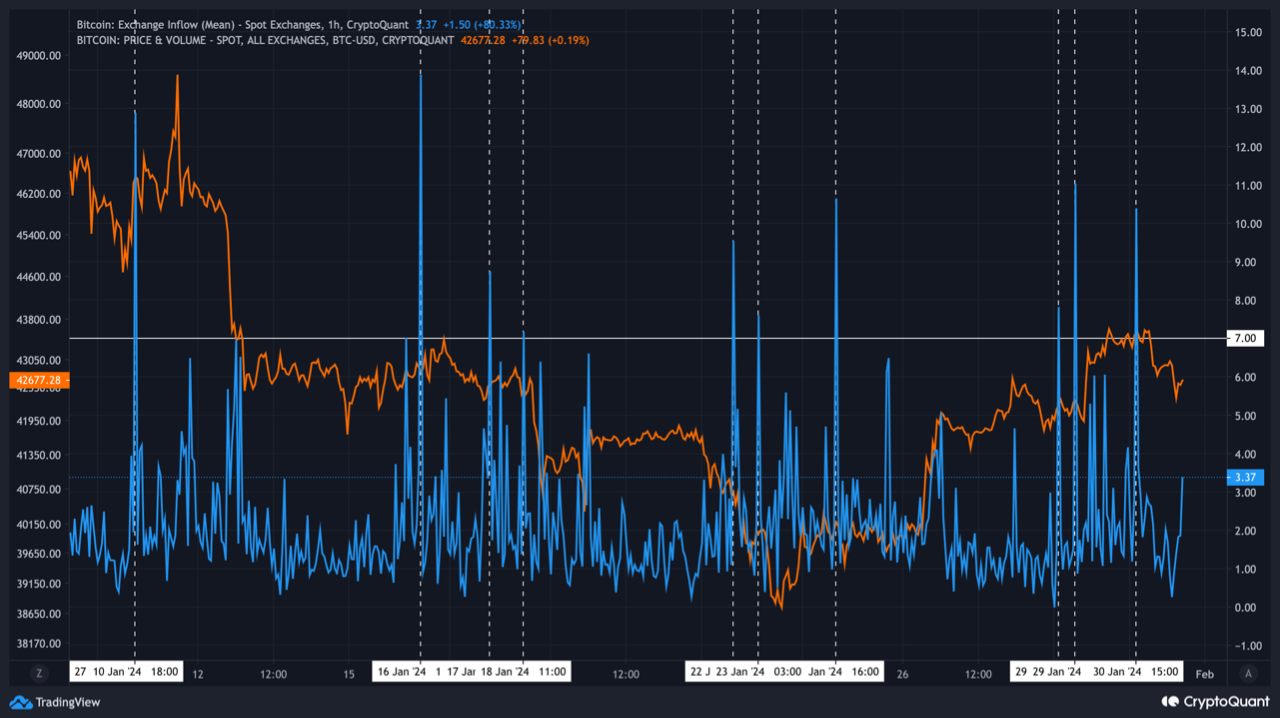
This metric recently flashed another sell signal, as we head into market open, suggesting selling pressure could be coming this week.
As shown in the chart below, this metric flashed a sell signal on the day of the Spot ETF approval, and we saw sell pressure the next day as trading of the ETFs began.
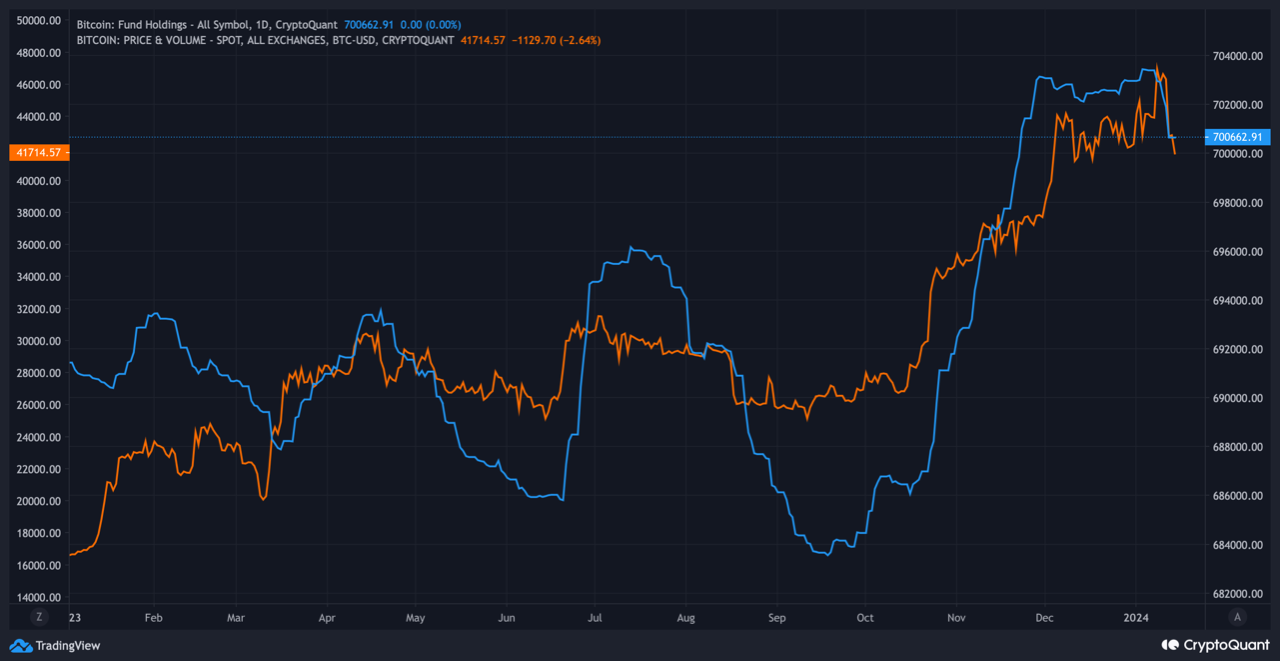
Regarding GBTC sell pressure, I think it could take another week of trading for the market to absorb the GBTC holders looking to sell at NAV in addition to Grayscale's higher fees.
Bitcoin had a large run up into the Spot BTC ETF approval, so I think its time for a bull market correction.

View original →Bullish(Nuanced)BTC
12/27/2023 Hi everyone, it's great to be back. Hope everyone is ready for the 2024 halving and bull market!
This post was inspired by the CQ author Onchain Edge's recent analysis on Mean Exchange Inflows exceeding 15, which triggers a near term sell signal suggesting Whales are taking profit. I made slight adjustments using different time frames and trigger levels, and also found this to be a potential leading indicator for a near term sell off.
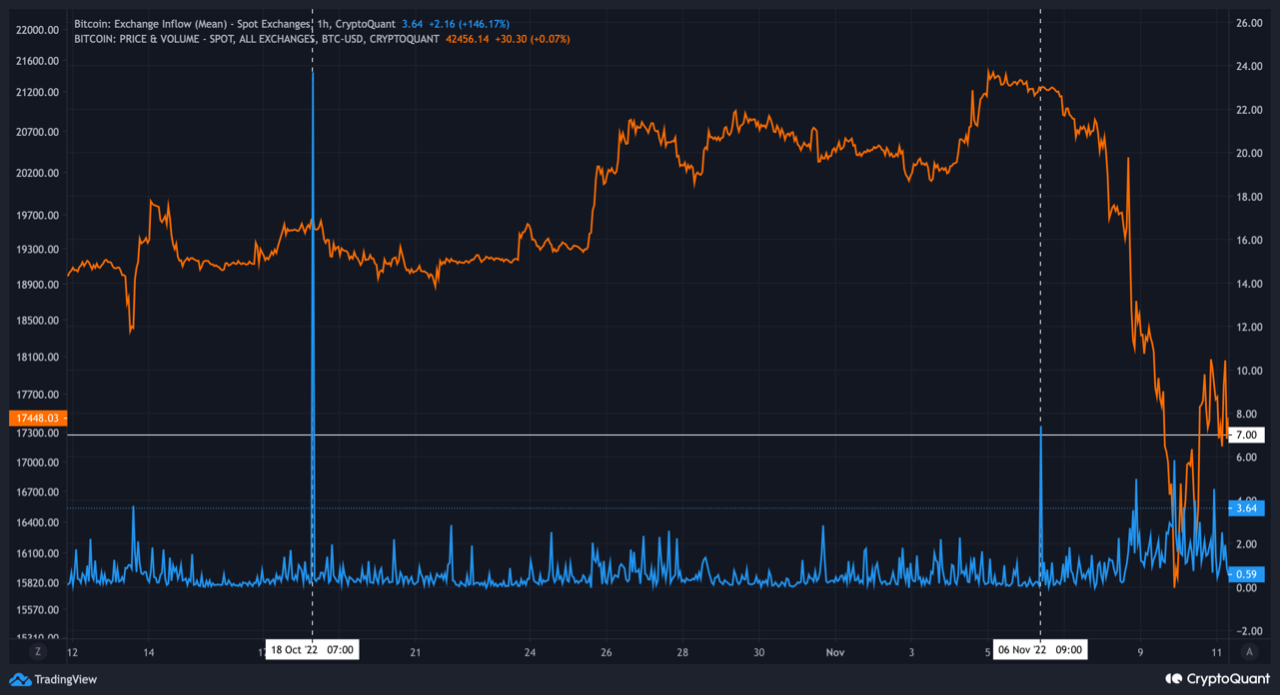
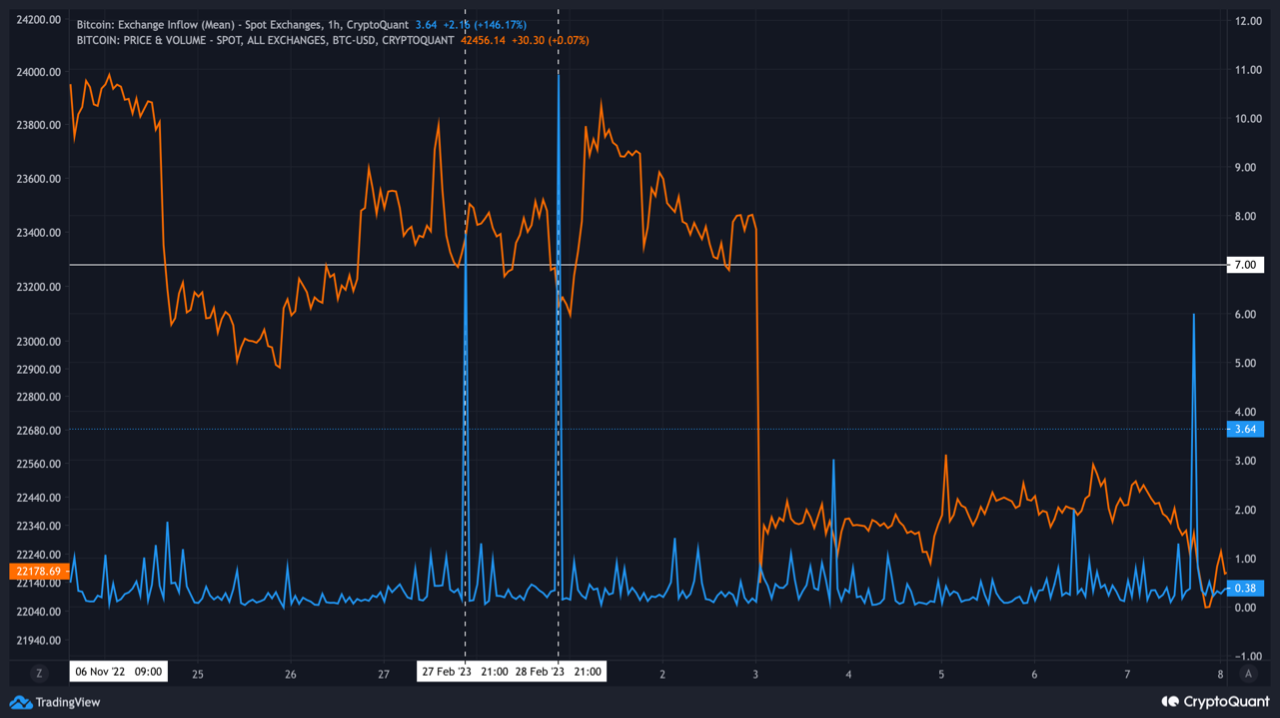
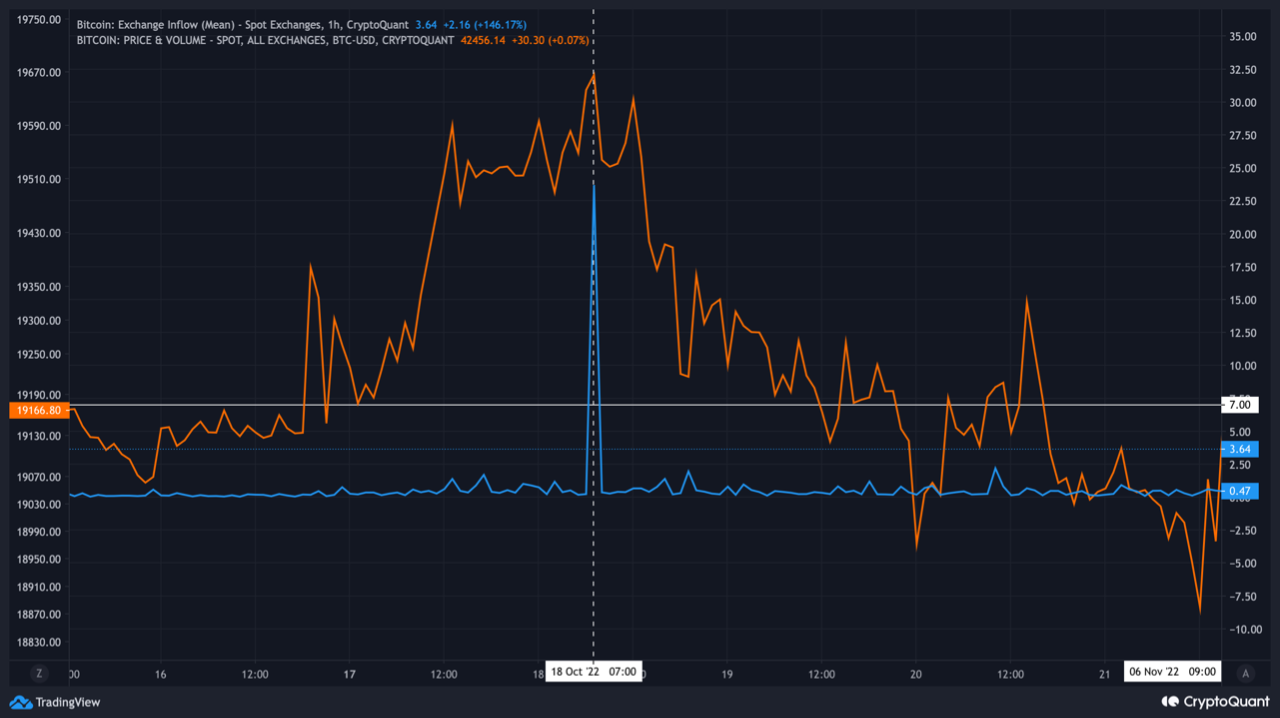
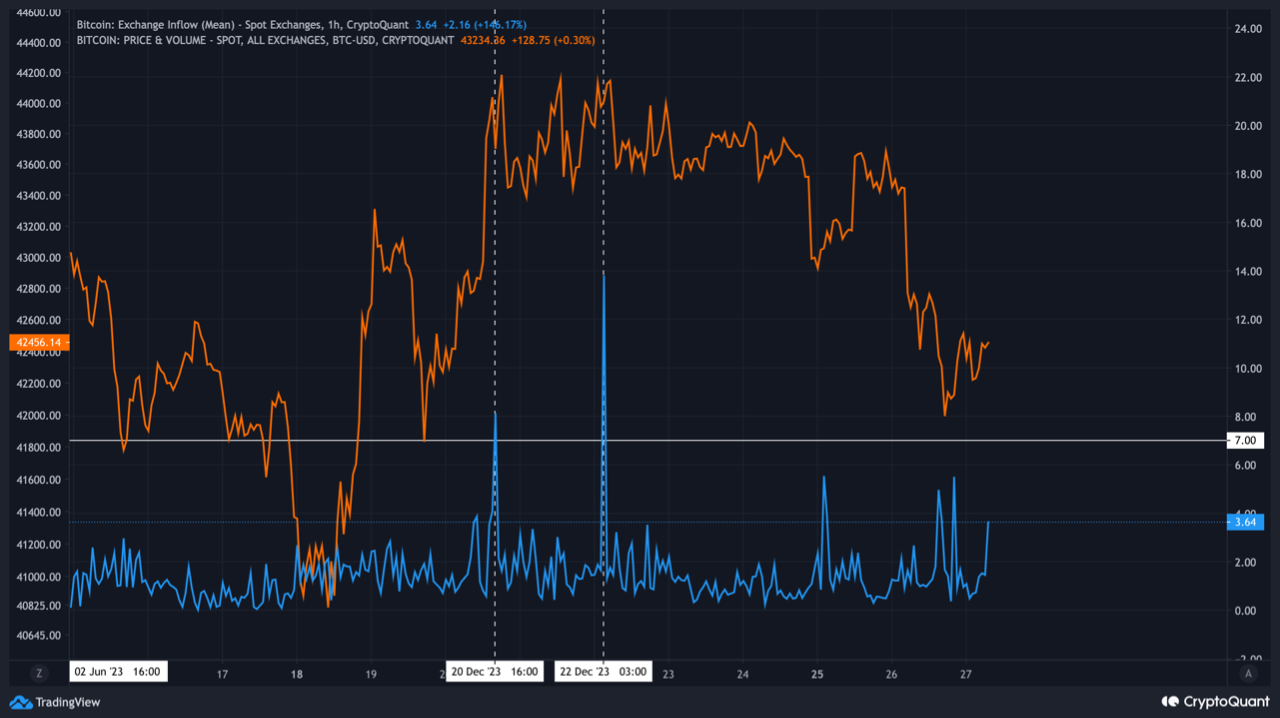
The Exchange Inflow (Mean) metric set on hourly time frame, with a trigger point at or above 7 BTC does a relatively good job at predicting near term selling pressure.
Looking back from late 2022 to now, whenever Exchange Inflow (Mean) rises above 7 BTC for the hour, this has led near term selling pressure within a few days.
As shown in the charts below, this metric exceeded 7 BTC (blue line crossing above the white horizontal line) in October 2022, November 2022, February 2023, and more recently December 20th and 23rd, 2023.
I must emphasize, this isn't a perfect indicator, as this metric spiked above 7 during the lows of the 2022 bear market, which did lead to sideways price action, but overall, its been quite helpful in predicting near term sell pressure.
With the recent sell signal flashing within the last week, its good to see Bitcoin correcting after an impressive rally, driven by anticipation of the Spot BTC ETF approval. If we see more readings above 7 BTC, I will remain near term cautious on BTC and anticipate further near term downside. Near term technicals have also been forming bearish divergence.
Let me know what you think.

View original →On a macro basis, Bitcoin and the dollar generally have been inversely correlated. A declining dollar is bullish for Bitcoin, while a strengthening dollar is bearish for Bitcoin.
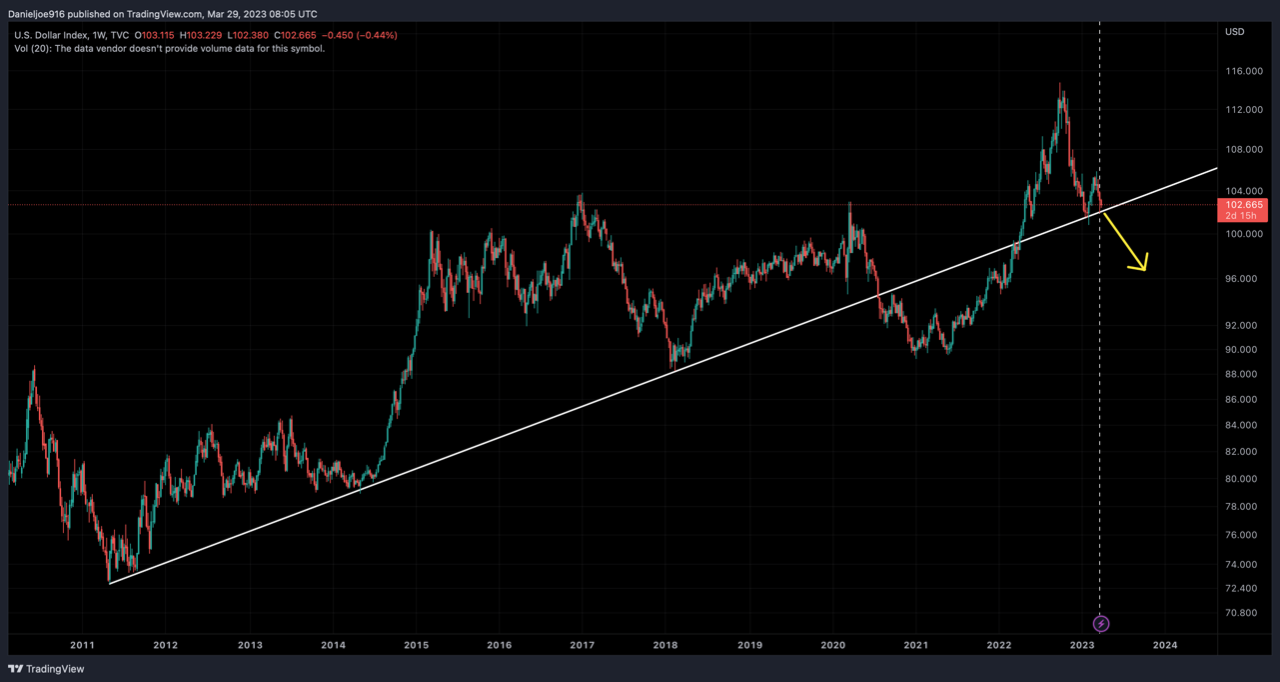
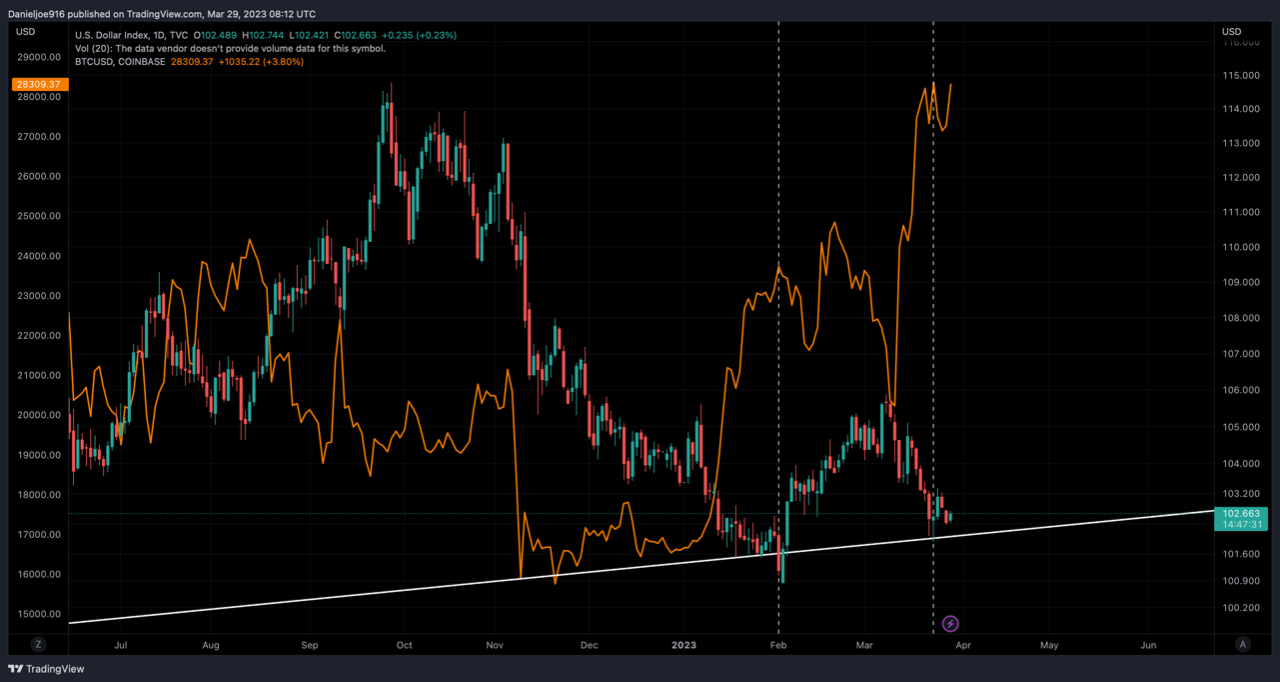
I have been tracking a 12 year uptrend support line on the DXY, which leads me to believe the DXY's next major move will likely cause a large move in BTC price. Assuming this 12 year uptrend support line in the DXY continues to be respected as support, near term bottoms in the DXY can cause near term tops in BTC.
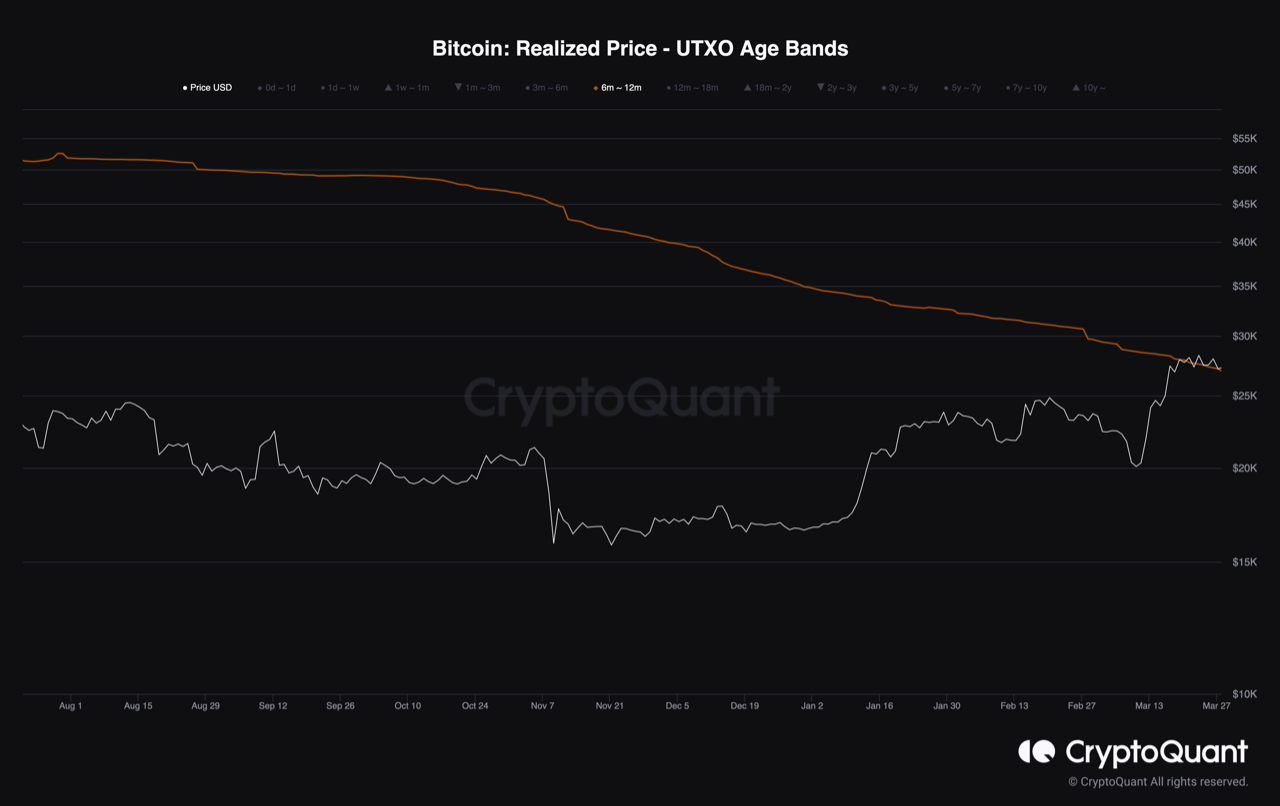
In the charts below, we can clearly see the DXY (candles) finding support on the trend line, while BTC (orange line) formed local tops back in early February and more recently in March. Also in late March, BTC began testing the 6 to 12 month UTXO Realized Price in the upper 20k area, confluent with the DXY testing support.
In my opinion, if the DXY makes a breakout to the downside below the 12 year uptrend support line, this will likely fuel a powerful rally for BTC, especially with investors around the world opening up to Bitcoin amid the banking crisis.
From a technical view, its always good to see price consolidate or pullback after a quick rally. I would like to see BTC backtest the 200 week MA as support after recently breaking out above this key level.
As many have covered, the rally has primarily been driven by spot buying without excessive long positioning, which puts a "early bull market" narrative on relatively solid footing. We just need to see how the macro environment plays out along with well timed key catalsyts for BTC to make its next major move.
Given the recent political developments undermining the US dollar, I find it likely for the dollar to eventually breakout to the downside in the coming months or later this year especially with the Fed pausing rate hikes and eventually cutting rates.
There are multiple potential catalysts for the DXY to head lower, which makes the case for Bitcoin much stronger.

View original →Bullish(Nuanced)BTC
11/7/2022 Many have been calling BTC at $20k the new $6k. The multi-month consolidation between 17k to 20k has caused many to expect another 50% drawdown towards 10k simply because of the resemblance of the 2018 bear market crash from $6k to $3k.
Anything is possible given the current macro conditions, but from a fundamental and valuation perspective, comparing the current consolidation to the 2018 6k to 3k crash is unfounded.
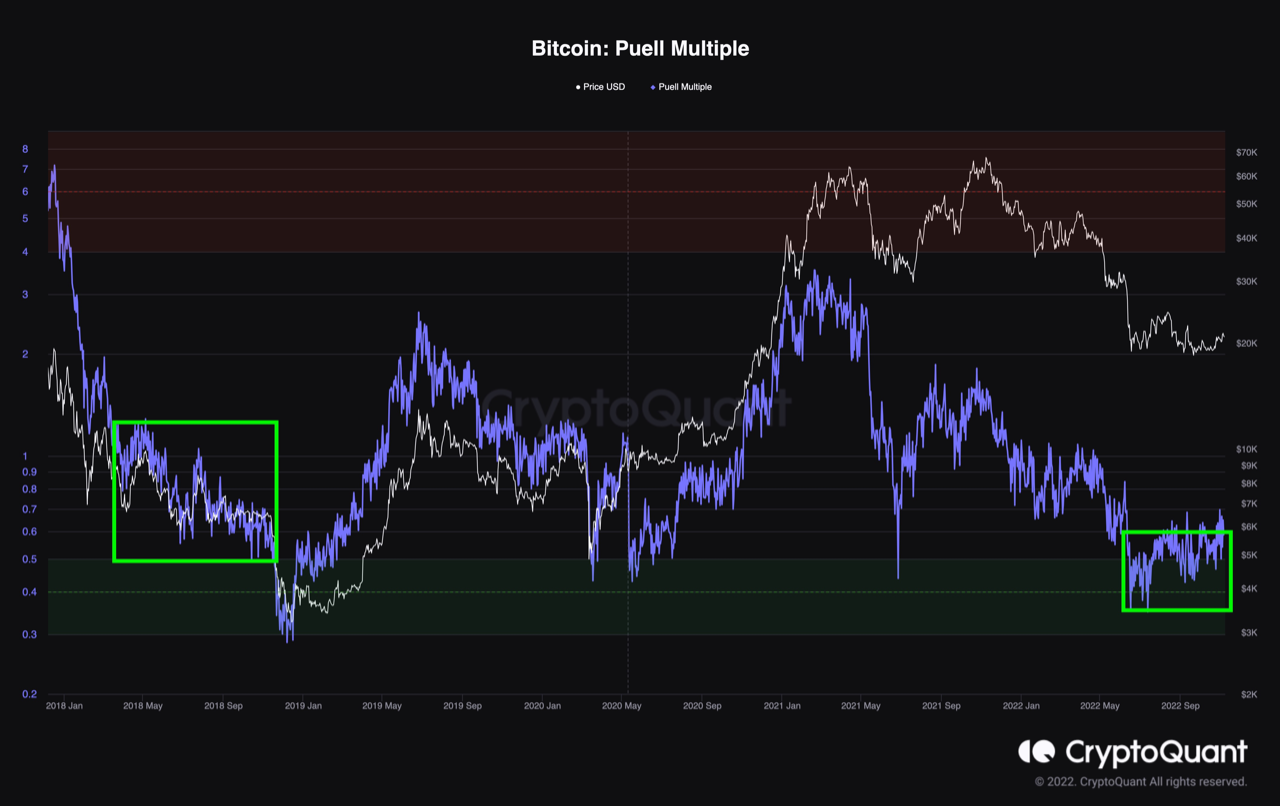
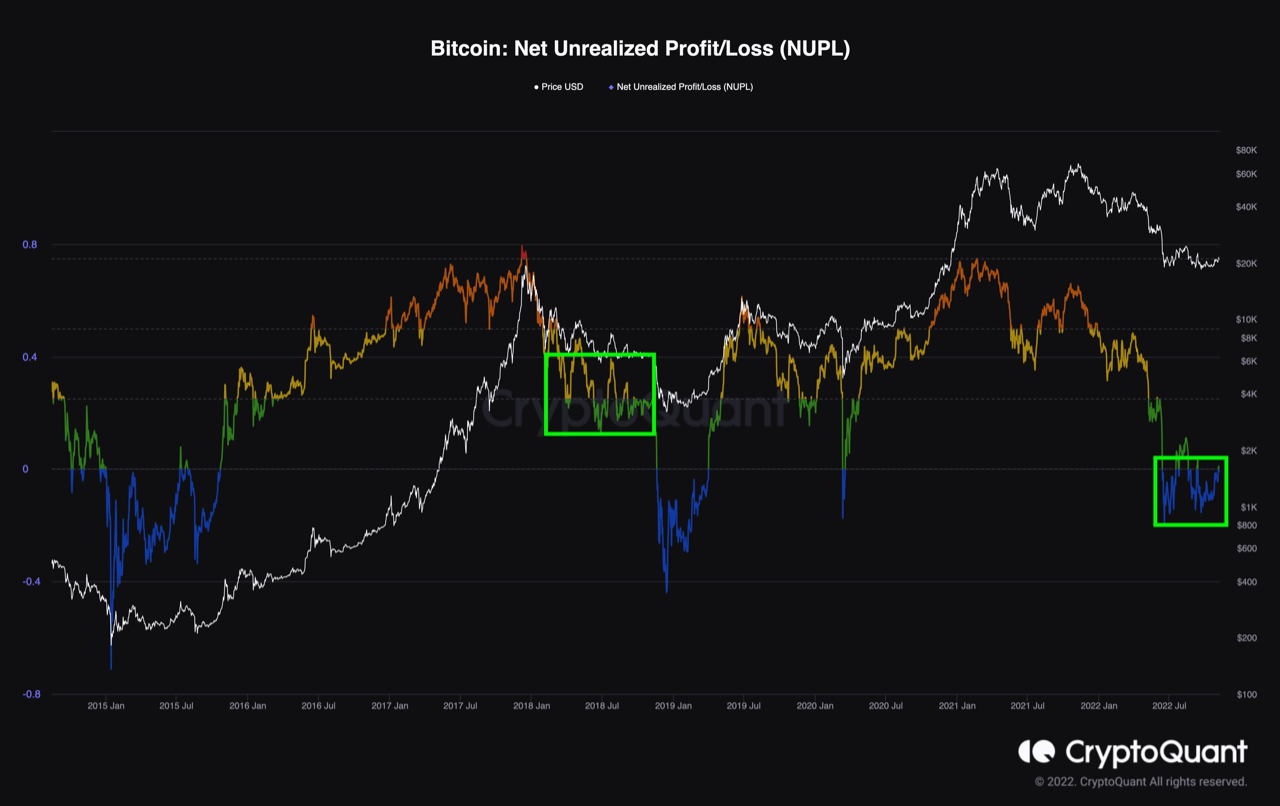
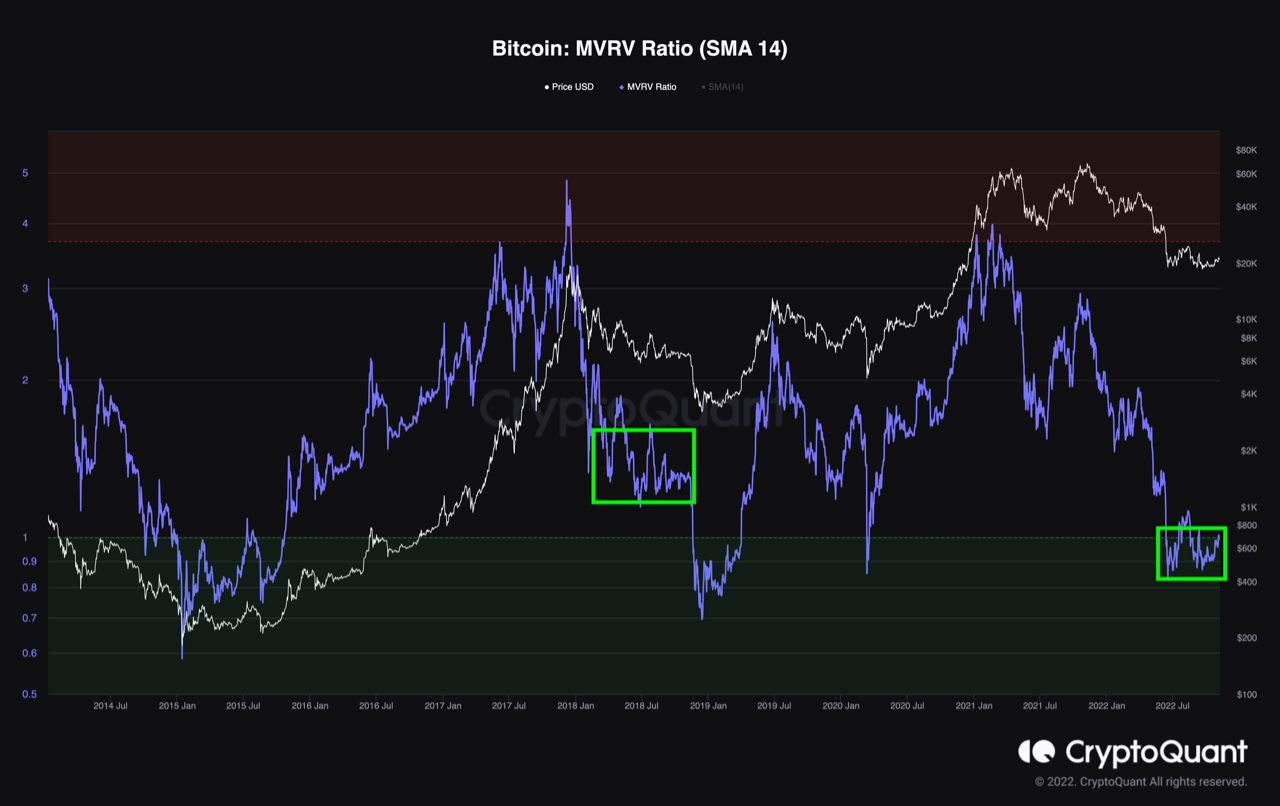
Many fundamental valuation metrics such as the Puell Multiple, Net Unrealized Profit Loss, and MVRV Ratio during Bitcoin's 2018 consolidation at $6k were nowhere close to historical bear market bottom levels as shown in the charts below.
These same metrics in June 2022 reached or fell very close to bear market bottom levels and have been consolidating at generational buy levels for multiple months. Fundamentally, this suggests 50% downside from current prices of $21k is less likely, macro permitting.
I will cover the charts in more detail in Part 2 of this series.

View original →

