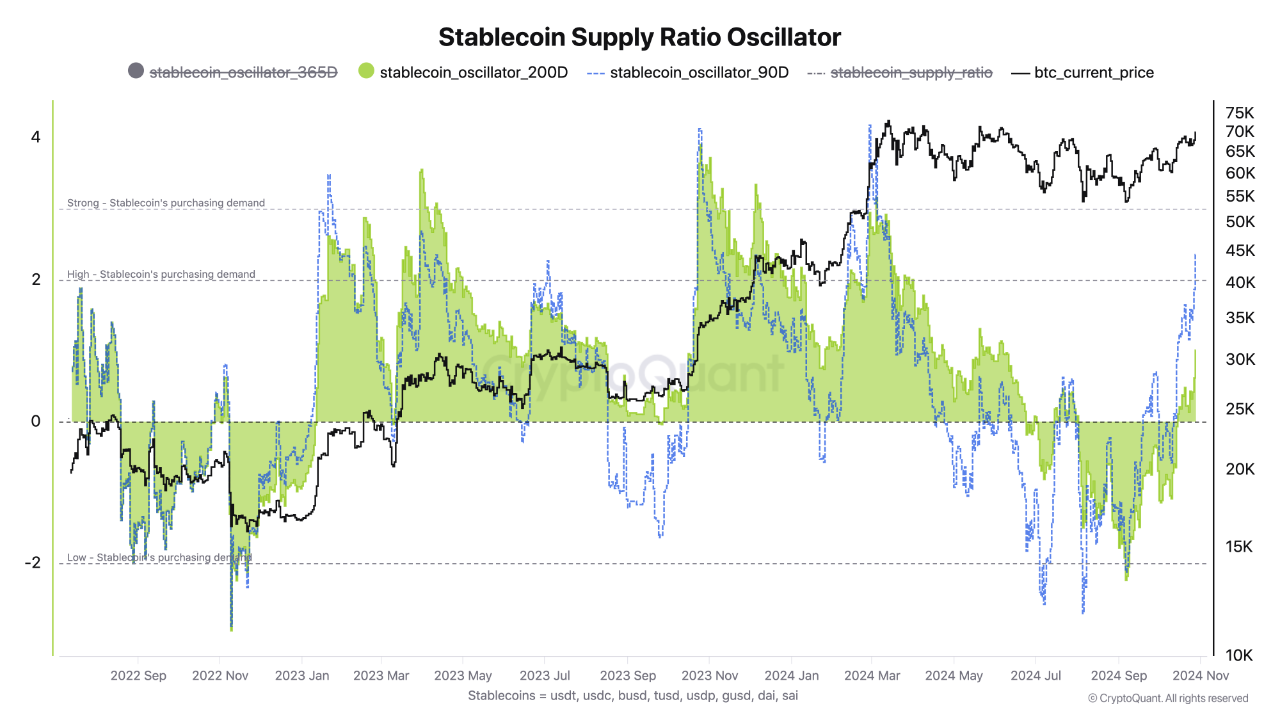
The Stablecoin Supply Ratio Oscillator (SSRO) is based on the ratio of Bitcoin's market cap to the market cap of stablecoins, including #USDT, #USDC, #BUSD, #TUSD, #USDP, #GUSD, #DAI and #SAI.
This oscillator allows us to estimate the demand for purchasing or betting by consuming these stablecoins.
Since Bitcoin bottomed in November 2022, the 90-day and 200-day oscillators have seen lows similar to that bottom during the 3 months of Q3 2024.
However, October has once again been an 'Uptober' as Bitcoin has recovered to 70K and may retest the ATH high set in Q1 earlier this year.
SSRO indicates high demands on the average quarterly data set (90d), breaking above the positive 2-points. If demand continues to sustain and the announcements and news in early November include some favorable macro and election data, a move to and break above the positive 3-points is possible, which has happened three times in the bull cycle: in January 2023, October 2023, and February 2024.

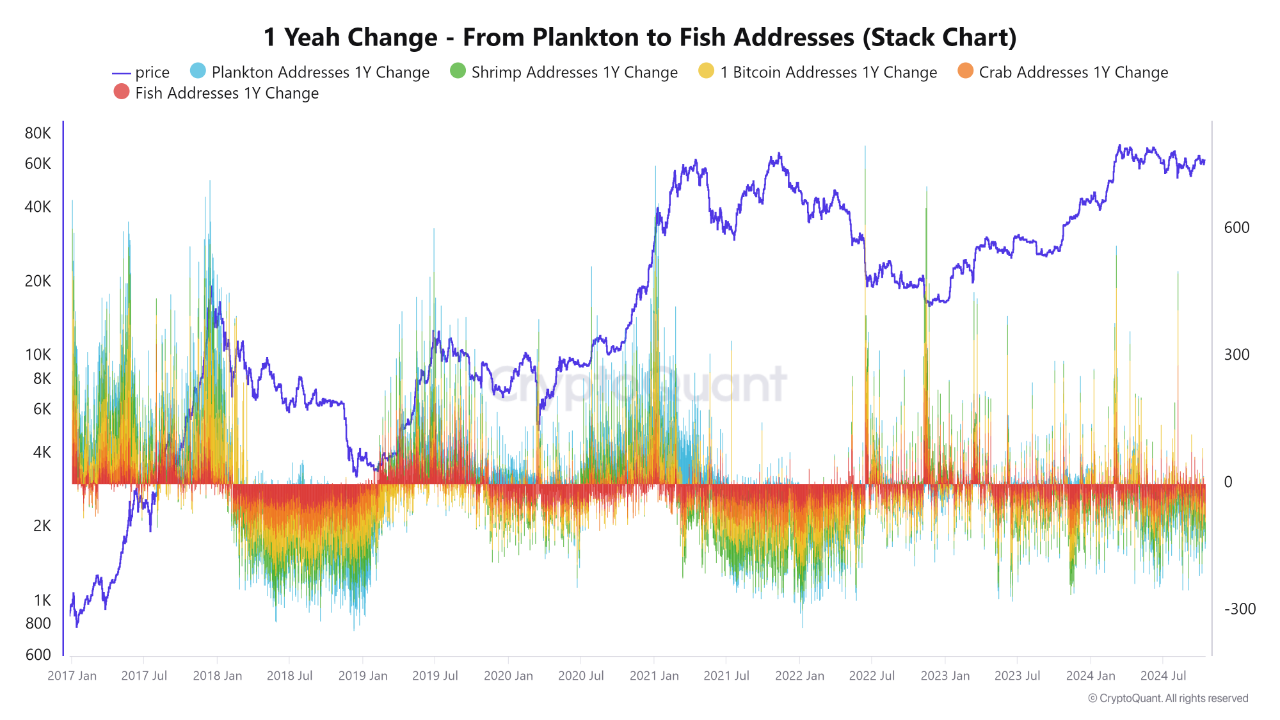
View original →Since BTC began surging in early 2024, much debate has arisen about whether retail investors and newcomers have re-entered the market. The answer, however, is nuanced.
By analyzing specific data, we can gain a clearer picture.
Let's focus on the yearly changes in Bitcoin addresses holding varying amounts, categorized as follows:
Plankton addresses holding >0 & <=0.1 BTC
Shrimp addresses holding >0.1 & <1 BTC
Addresses holding exactly 1 BTC
Crab addresses holding >1 & <10 BTC
Fish addresses holding >=10 & <100 BTC
I've deliberately chosen these smaller groups rather than larger ones (like Dolphin, Shark, Whale, or Humpback) because the latter often represent exchanges, custodial wallets, or cold storage, which tend to show fluctuations that are difficult to track. In contrast, the smaller groups give us a more accurate reflection of the general market and sentiment.
If we look back at previous cycles, Bitcoin's price increases have typically coincided with a steady rise in the number of addresses belonging to these retail groups, particularly during peak periods. This pattern also highlights the extent of FOMO that drives market behavior during these times.
The rise in these group addresses in the current cycle suggests that retail participation is indeed present. However, the growth is weaker and more uneven than in previous cycles, especially during market rallies. This is understandable, given that global monetary flows have generally declined over the past three years.
So, the data suggests that future FOMO waves are still possible in this cycle.
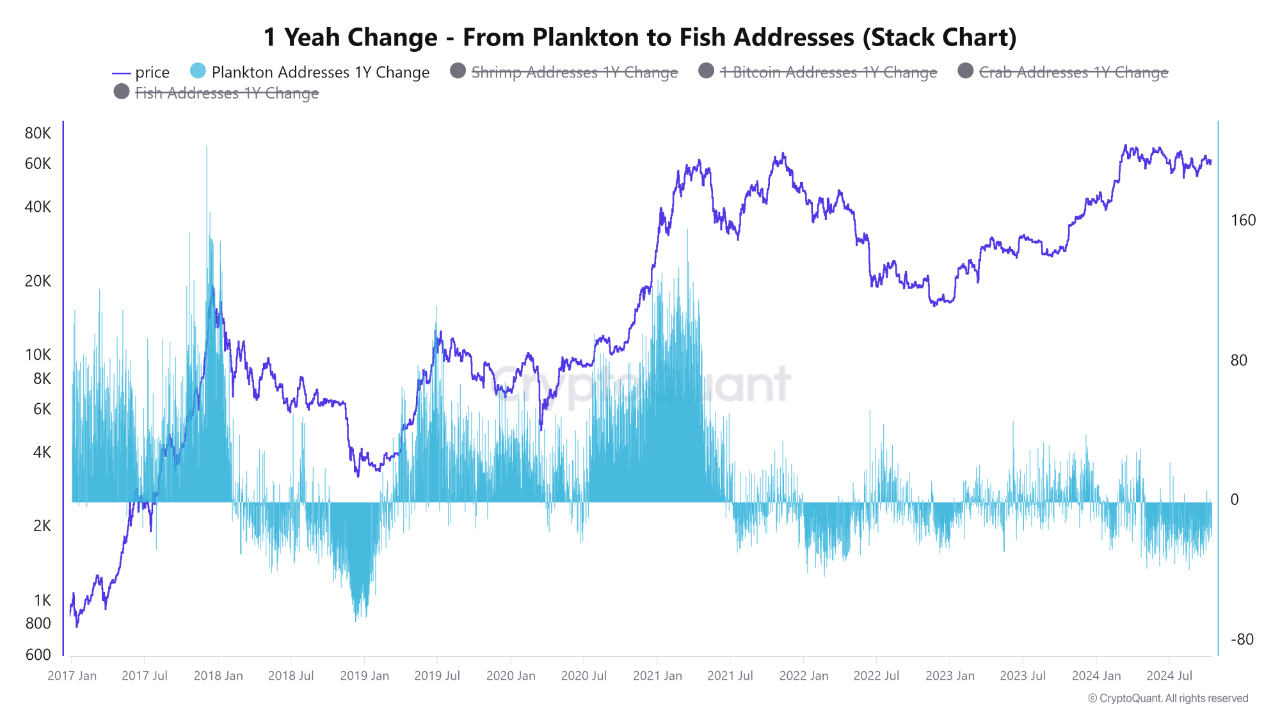
The most noticeable trend appears in the Plankton chart (holding >0 and = 0.1 Bitcoin). As BTC's price rises, newbies tend to invest in tiny amounts. From the start of 2023 to now, the growth in this group's address number has been negligible, especially compared to the surges of the previous two cycles.
Based on these observations, I conclude there is still a basis to look forward to a final wave in this cycle.

View original →Neutral10/7/2024
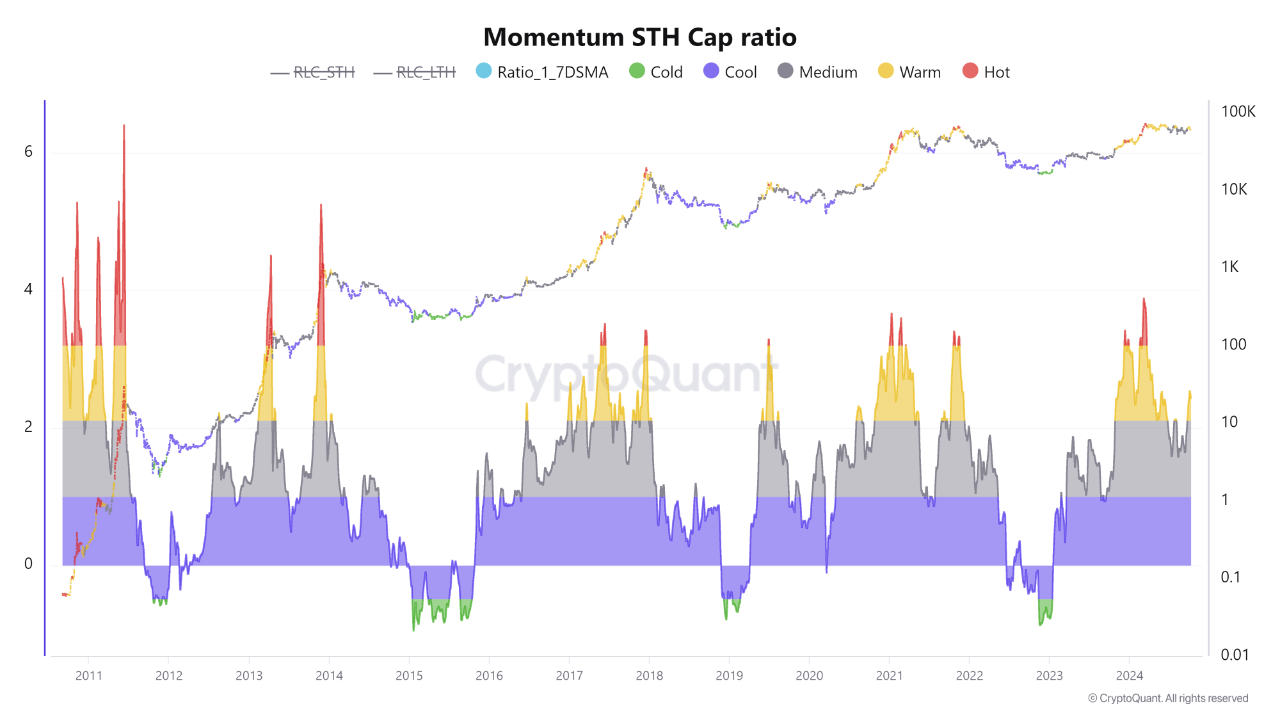
Momentum Short-term Cap is my experimental metric, which is calculated as a ratio based on the difference between Market Cap and Realized Cap divided by the total Realized Cap of the short-term cohorts.
The difference between the Market Cap and Realized Cap is important, as it allows one to show the degree of change in the asset's value over short-term periods.
Therefore, with a relatively high degree of accuracy, this ratio shows the peaks where the price reaches the hottest threshold of the short-term cohort's market cap momentum (less than six months).
At present, the ratio value has recovered back to the WARM phase; however, less favorable conditions in terms of impact psychology and slow changes in macro conditions are promoting slow momentum.
Time is still allowed, and once the macro factors stabilize or show positive shifts, the momentum will quickly return to the hot threshold. This will probably be the final top of this cycle.

View original →Bearish8/2/2024
Jay Powell remains calm about the US economic outlook, despite the Fed holding interest rates steady and acknowledging signs of a cooling economy. US economic data has disappointed since May, with full-time employment declining and credit card delinquencies rising. Recent economic growth has largely relied on government spending and public sector jobs, while consumer spending has outpaced income.
Leading economic indicators and the market are signaling recession risks. The Fed may have been too slow in cutting interest rates, leading to excessive demand restraint. Economic momentum loss could quickly become a self-reinforcing spiral, increasing unemployment, delinquencies, and bankruptcies. Recession warnings are flashing and should not be taken lightly.
Geopolitical turmoil in the Middle East also contributes to market anxiety as retaliatory actions in the region could impact overall market sentiment. The upcoming US presidential election in November adds to this uncertainty. Cryptocurrency market sentiment is further unsettled by large Bitcoin movements from MtGox and the US government, following a price drop due to the German government's net selling in June.
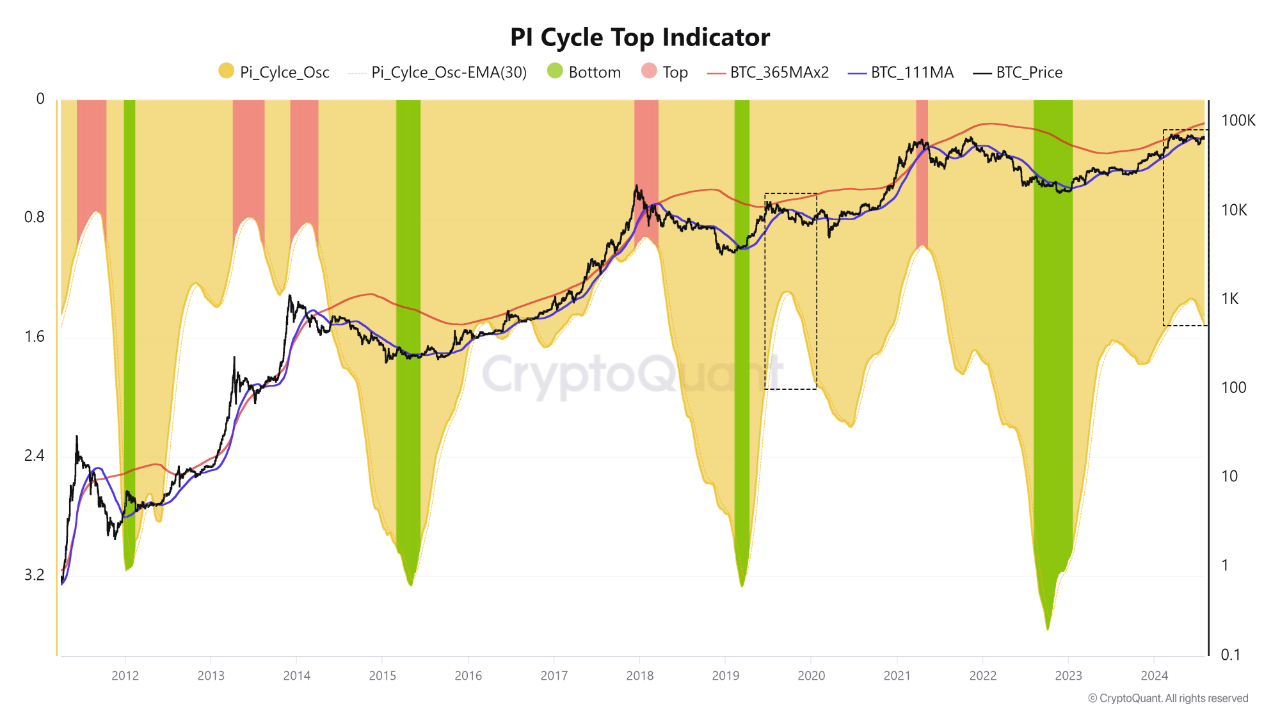
One fundamental indicator based on historical price data, the Pi Cycle, with 111 and 365x2 moving averages and the (MA365)x2/MA111 oscillator, has confirmed a similar downward momentum to late 2020. While historical patterns do not guarantee future outcomes, warning signs of a potential downturn or prolonged sideways movement should not be ignored.
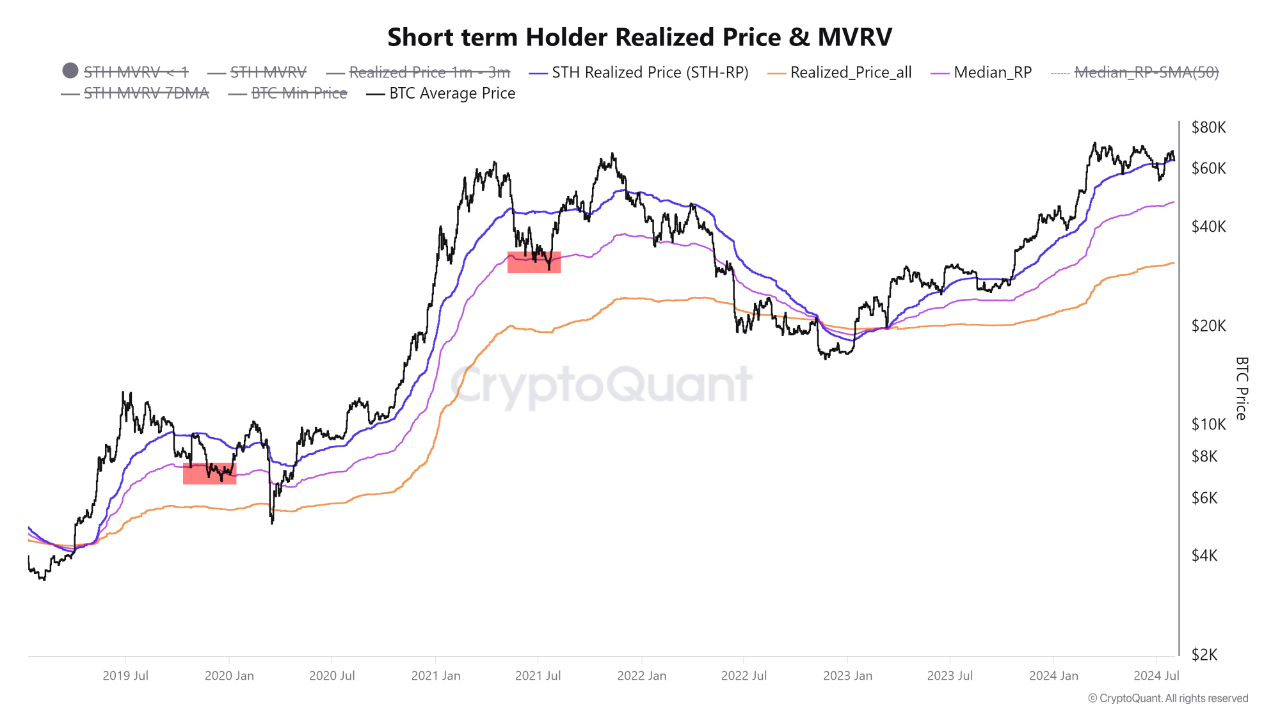
Based on the 4-year cycle and STH Realized Price and Realized Price data, preparing for unexpected developments is essential. For instance, during the significant downturns from October to December 2019 and May to July 2021, Bitcoin prices dropped to the Median RP area before recovering and reaching new highs. While there is no guarantee of absolute accuracy, being mentally prepared for unexpected developments is always necessary.

View original →Bearish(Nuanced)BTC
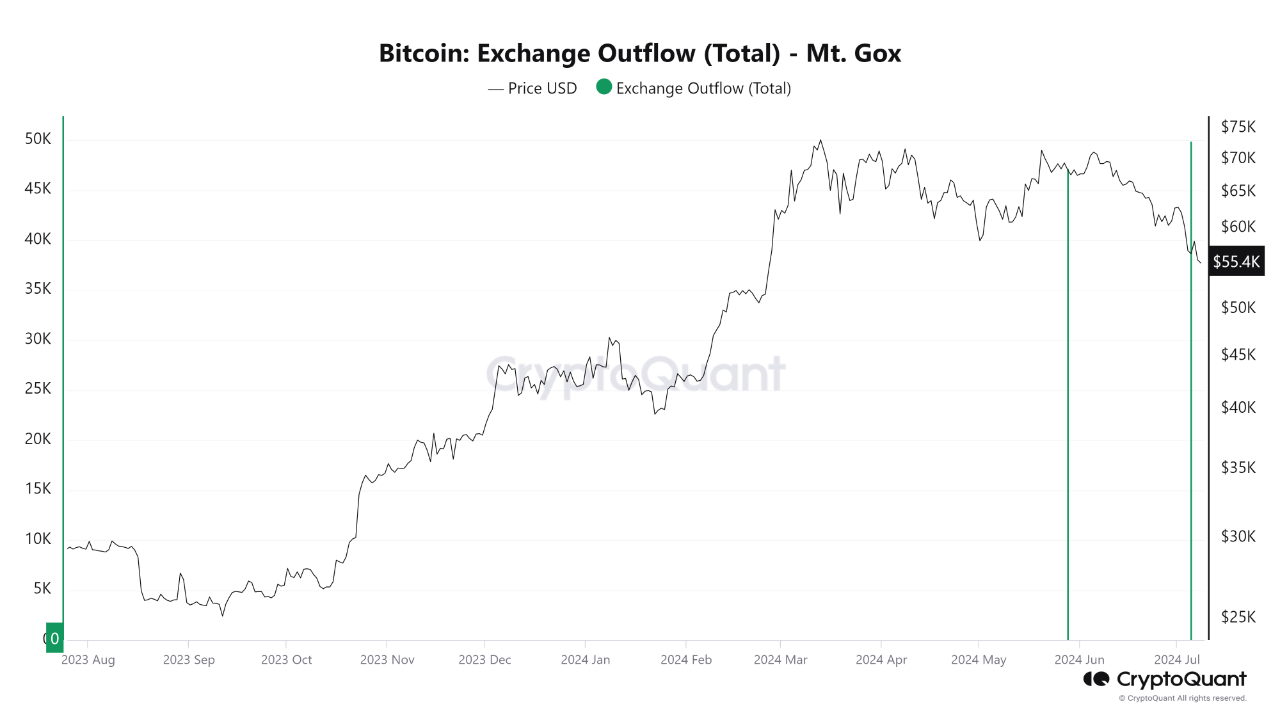
7/8/2024 Bitcoin and cryptocurrency investors have continued to face downward pressure since the beginning of Q2, including concerns about potential selling by creditors of the Mt. Gox exchange, which has an approximately $8 billion hoard of the most prominent digital asset in the market (Chart 1).
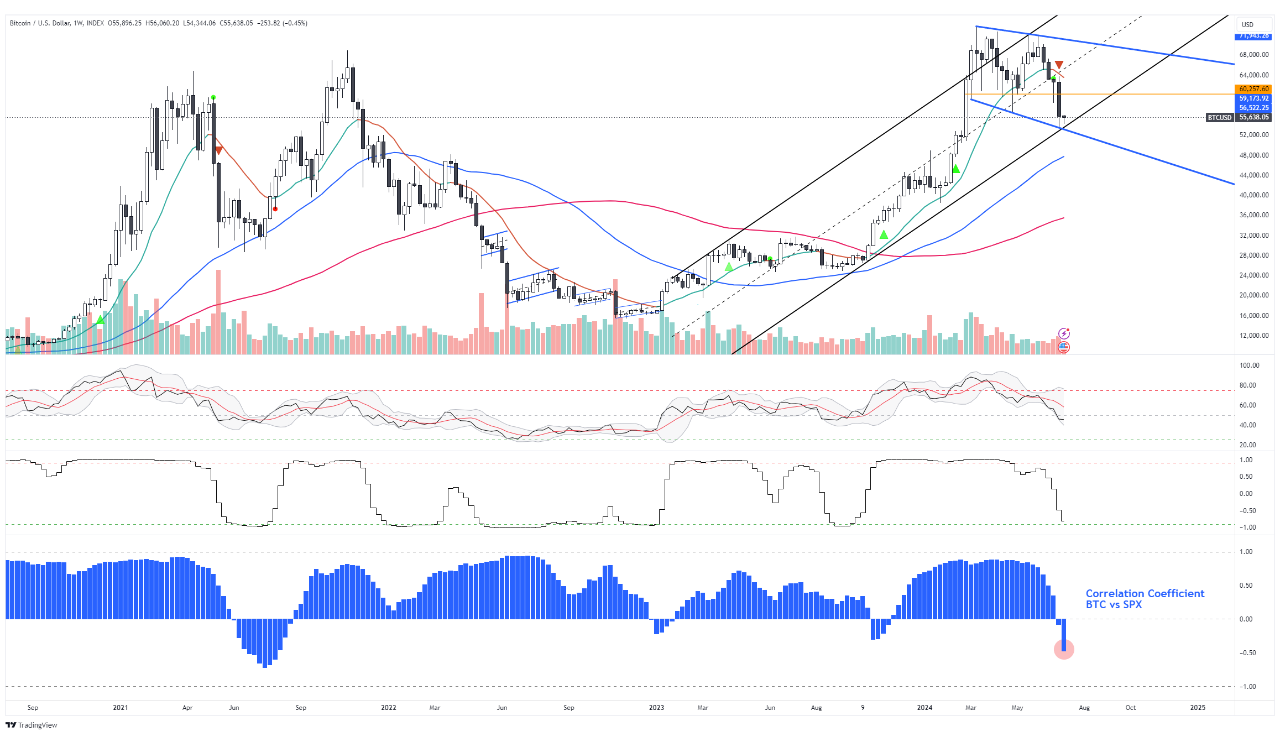
In addition, the historical lesson of high central bank interest rates continues to overshadow investment decisions in high-risk assets. Although US stocks continue to accelerate, the correlation between Bitcoin and SPX's index has dropped to its lowest level since January 2022 (Chart 2), which shows that the lingering riskiness of the cryptocurrency market is still quite a painful issue.
In particular, the momentum of the digital currency market has decreased sharply after the excitement from spot ETF approvals has reduced, and the level of investment from small individuals has not shown a breakthrough, which is the primary energy source for previous bull runs.
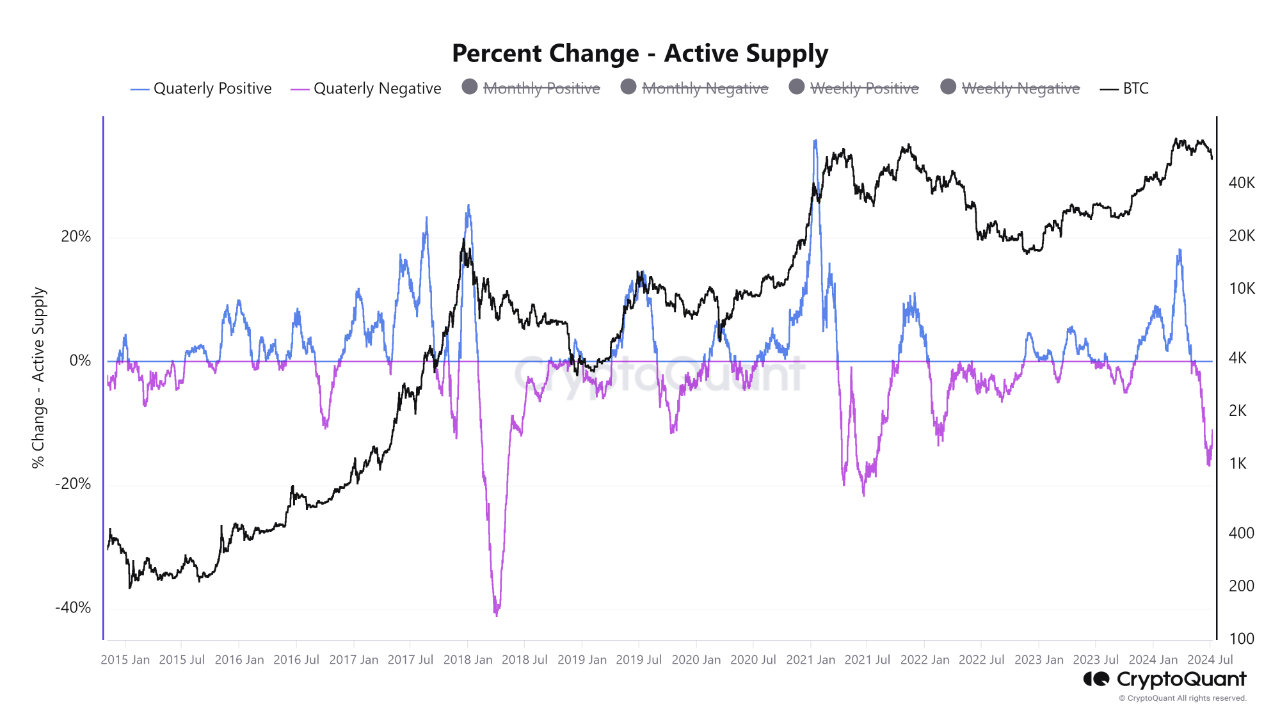
The evidence is that the percentage change rate of Active Supply data by quarter has decreased sharply since the peak in late March (Chart 3). The percentage decrease shows the cautious sentiment and (or) lack of interest from F0 investors. The appearance of spot ETFs is mainly aimed at investors in the US, and these investors, although strong, only account for a part of the global market. No one knows how many are new waves or are still just veterans trying to accumulate more assets with both right and left hands. (CEX, DEX + ETFs).
However, the bearish sentiment doesn't tell the whole story; the on-chain metrics of long-term holders are a sign that they are not yet content to distribute most of their holdings; if the 4-year cycle is a significant effect, then the 2-3 year investor cohorts are still holding on, I predict that it may be for the last bullish waves of this cycle. (Chart 4)
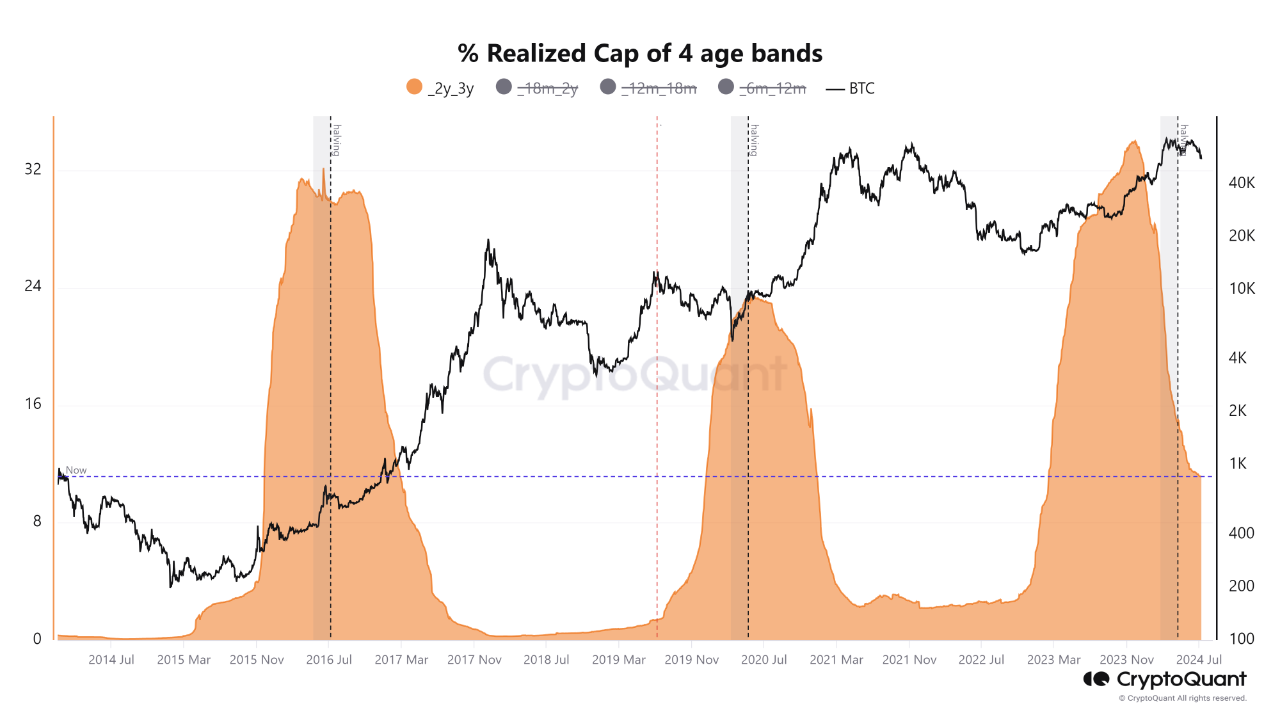

View original →Historically, investors who hold BTCs for 2 - 3 years often reap the most significant returns over a 4-year cycle.
Ignoring the excitement or accompanying risks while waiting for the final decisions from the upcoming SEC, in this analysis, I want to focus more deeply on the possibility of high-level distribution moves of this cohort.
First, we need to answer why this group plays a vital role at the current stage.
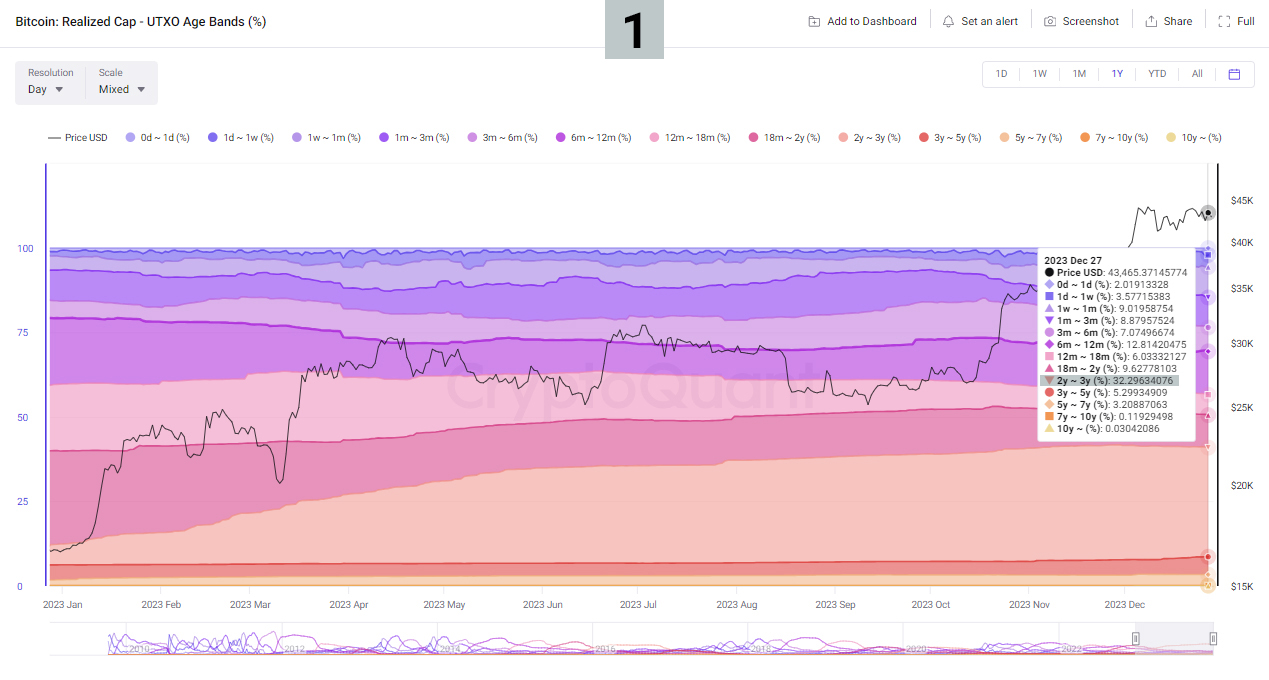
1/ Looking at the Realized Cap-UTXO Age Bands (%), this cohort is 1/3 of the total realized capitalization percentage of all age groups combined, including both short-term and long-term, equivalent to 32.29%. (chart 1)
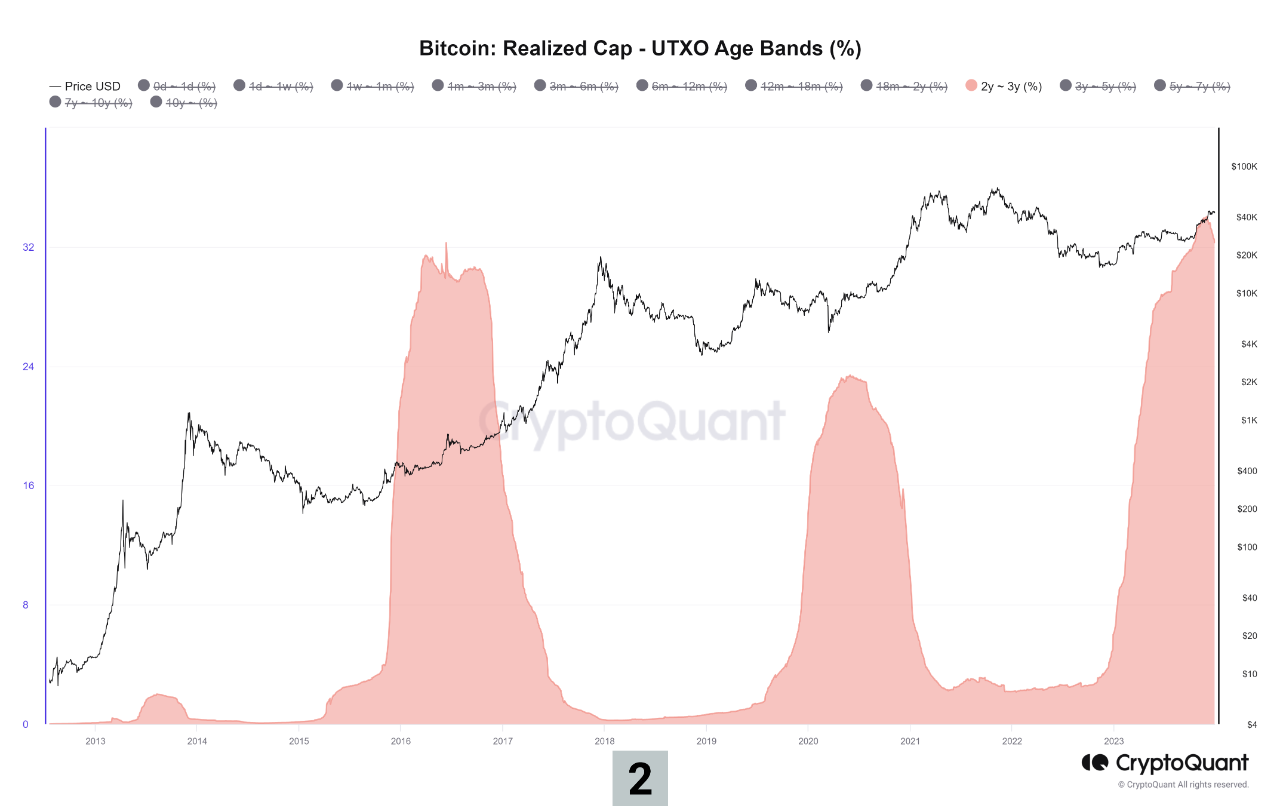
When compared to history, the percentage of real capitalization value of this group is the highest in history, which proves that more investors are holding for the long term in this period. (chart 2)
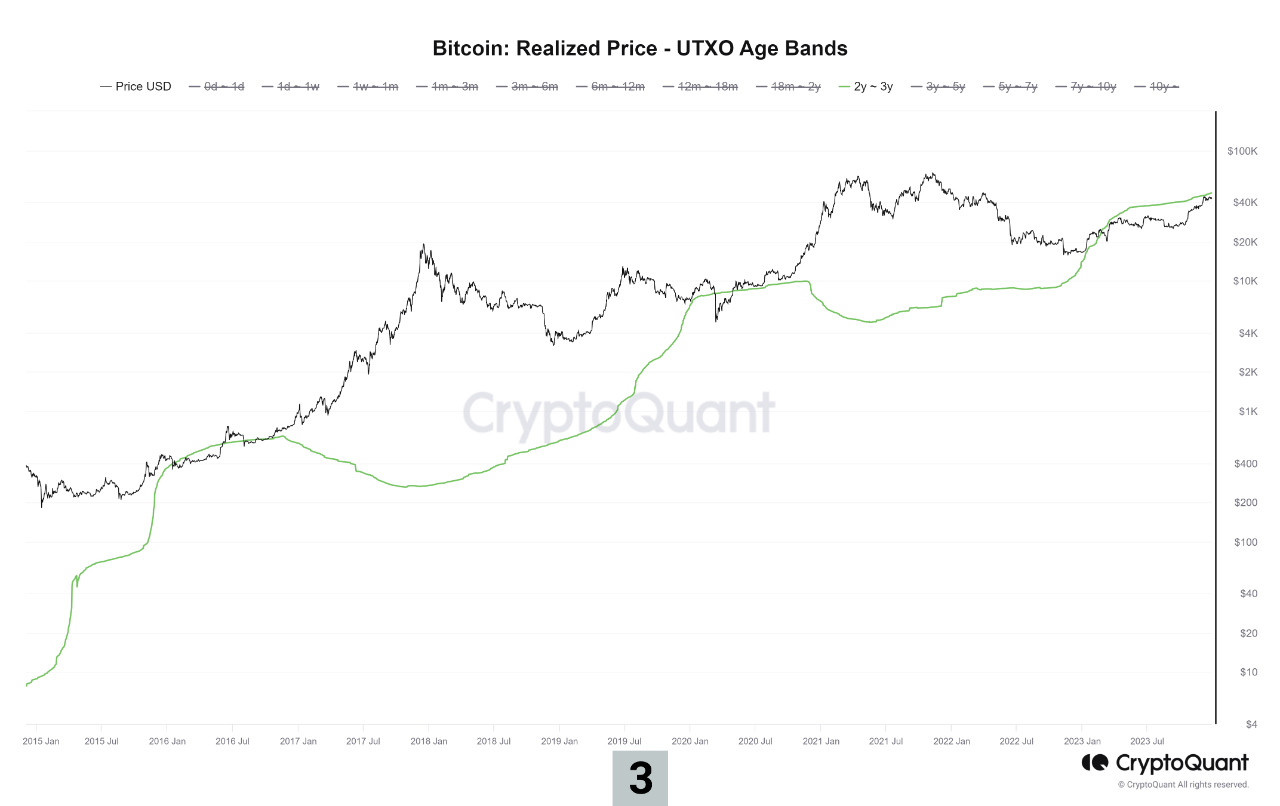
2/ When Bitcoin reached its local peak in June 2019, the Realized Price of this cohort recorded a very high profit level; the market price at that time was $11,955, and the realized price of the 2-3-year holding group was $1,228. Meanwhile, now the market price is still touching the resistance zone of this cohort's realized price. (chart 3)
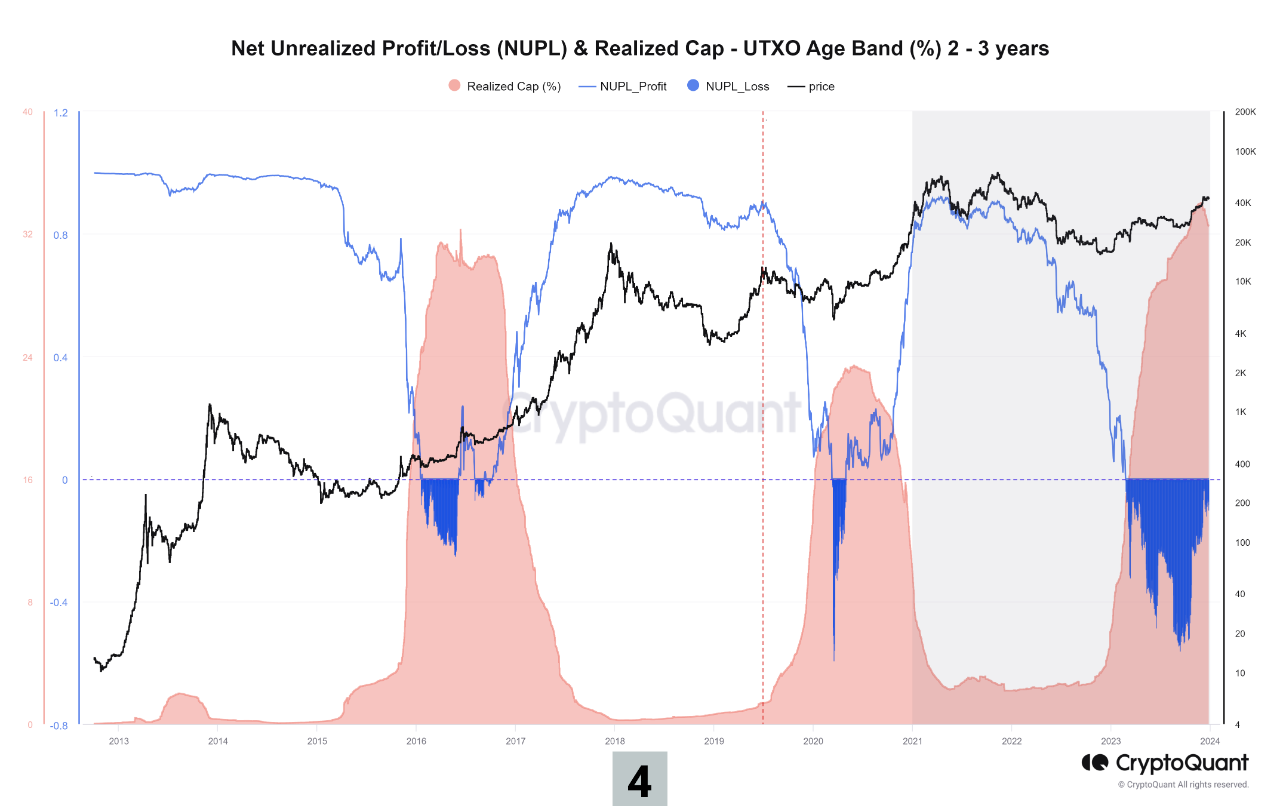
3/ That proves that long-term investors who bought BTCs between January 2021 and now are still only near the break-even point. This can be calculated using the NUPL data for this cohort alone (chart 4). The blue part shows the loss for the coins in this age group, and it is now just approaching the zero boundary, contrary to the recovery peaking locally in 2019 when this cohort still recorded extremely high levels of profit. (red line on chart 4)
Based on comparative data, ignoring the excitement and anxiety caused by the upcoming ETF decision and the positive macro situation, I do not see a risk when the group with the largest percentage of realized capitalization will quickly distribute and put pressure on the market price.

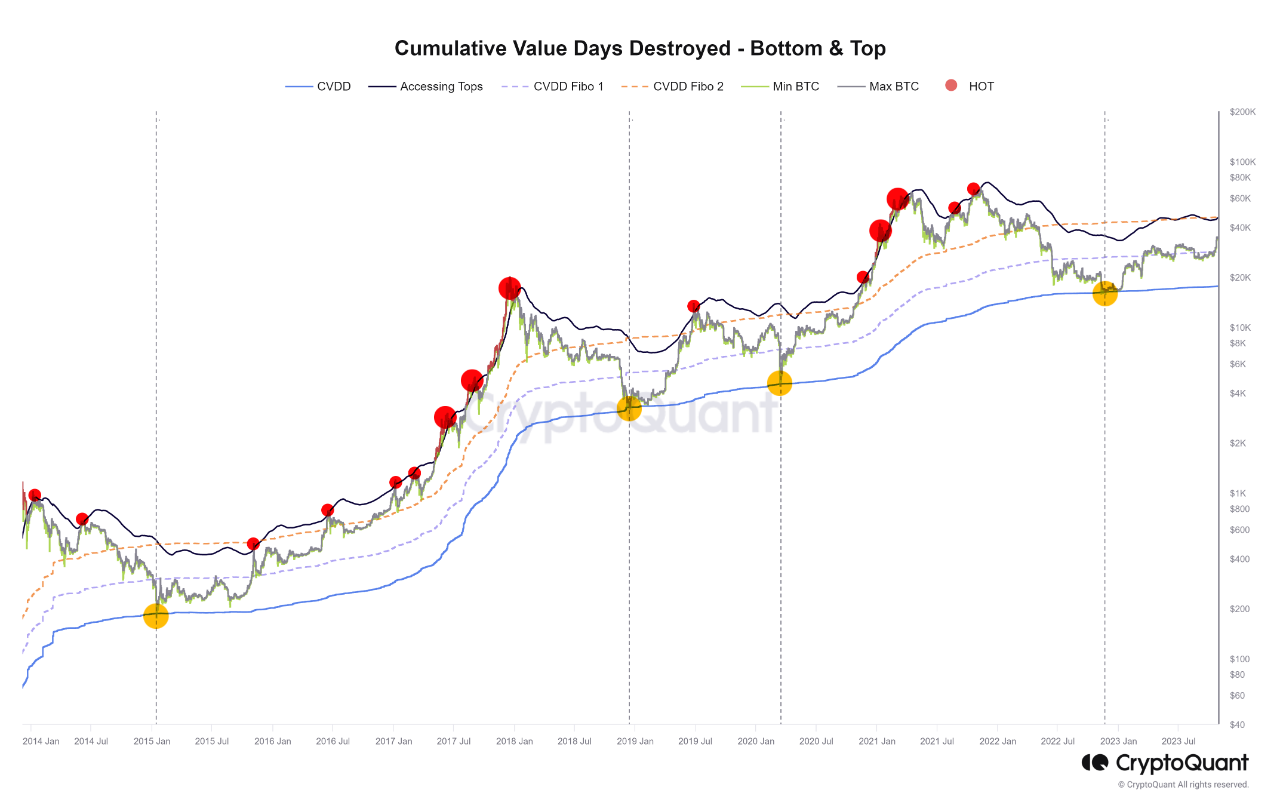
View original →Cumulative Value-Days Destroyed (CVDD) is the ratio of the cumulative USD value of Coin Days Destroyed and the market age (in days). Historically, the indicator has been an accurate indicator for absolute market bottoms. This was in 2015, 2019, 2020 (back swan), and the latest bottom 2022.
Because of the almost perfect accuracy of the major historical lows, based on this data, I added into CVDD the 50 moving average of the market price to create the "Accessing Tops" indicator.⚫
With the "Accessing Tops" indicator, we see that whenever the market price touches or exceeds this indicator, it shows that the market price is extra hot and will usually then approach a correction trend. The signs on the chart recognized this.🔴🟡
In the bull market, Bitcoin will also approach or near its cycle peak when the market price begins to maintain above the indicator threshold.
At least for now, with the momentum of the belief that there will soon be approved spot ETFs, and if there is not any bad news, gets only good news, the best further possible peak may occur when short-term investors decide to hold positions and continue to push BTC up to reach the indicator threshold.

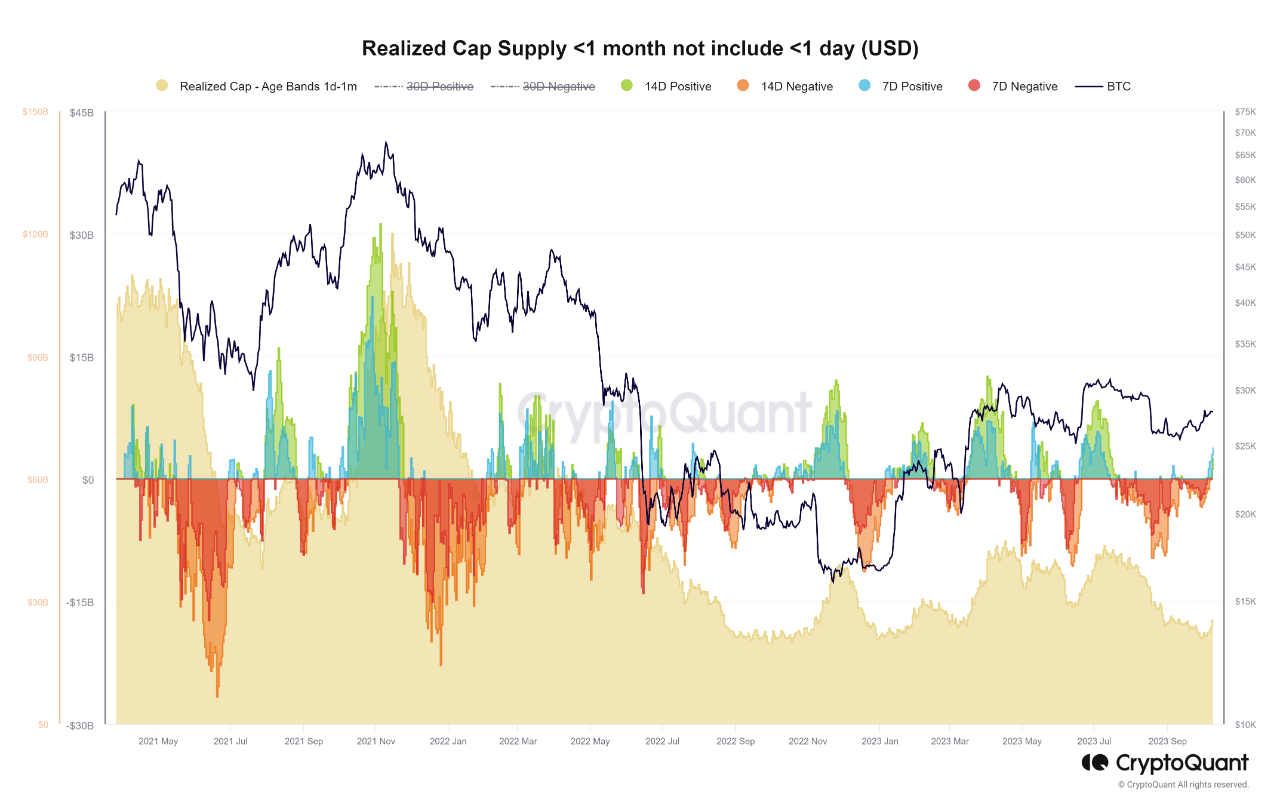
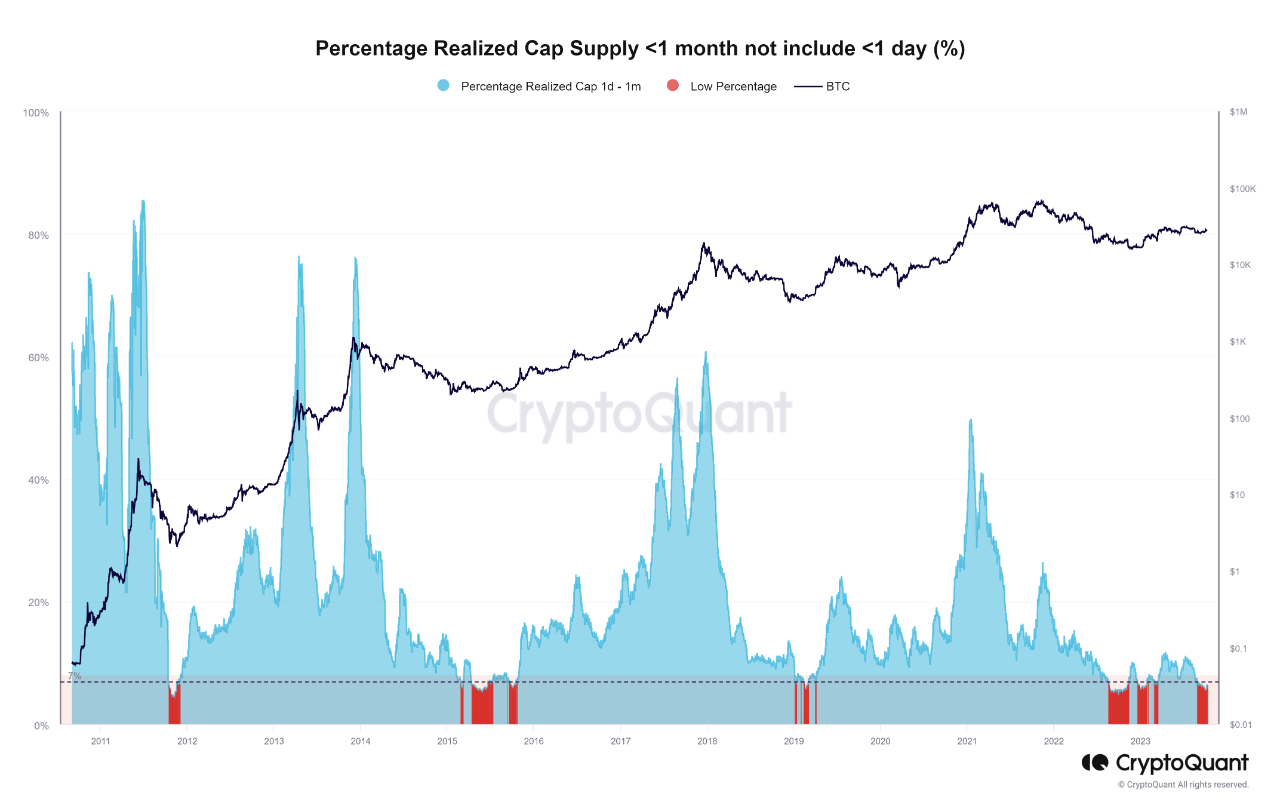
View original →The realized capitalization of the supply set, including coins existing from 24 hours to 1 month, is currently at a new recovery threshold following the most substantial decline of 2023.
In my view, this dataset effectively reflects Bitcoin's market price fluctuations. It represents recently acquired coins before they become long-term holdings or are continually traded in the short term.
1/ Historically, the percentage of realized capitalization for this age band (1d -1m) illustrates market progression, evident in peak or trough areas, in line with market price history.
In previous cycles, the market's upward momentum is reflected in this group's continuously rising or sustained percentage of realized capitalization. This suggests new investors or capital inflows for accumulating new unspent outputs have increased. However, this is not the case currently, as this data continuously fluctuates and hasn't surpassed the < 8% threshold.
2/ Data on the change in realized capitalization of this age band in USD also shows similarities.
Local peaks, bottoms, or medium-term bull/bear periods reflect a cautious mentality as investors inject more capital to accumulate.
During late 2022's bottom, this group's Realized Cap decreased to ~$19.8B and recovered to ~$44B when BTC peaked at $30K-31K. However, it has since fallen back to ~$20B and is recovering slightly.
The current change in this data (in blue and green) shows an inconsistent recovery, partly due to general market sentiment, including macroeconomic and geopolitical issues.
The market will likely remain uncertain if these data don't show significant and positive trends from now until the year's end. The volatility will be unpredictable, so newcomers should not expect continuous and strong price increases as in the first half of this year.
Remaining patient & waiting for clarity is the best course of action.
Check charts in my query dashboard.

View original →Since the beginning of this year, when US officials were determined to thwart much of the crypto market, the digital asset industry trying to battle regulations has finally won a significant victory.
"A US appeals court’s ruling to overturn the Securities and Exchange Commission’s decision to block the first exchange-traded fund tied to the spot price of Bitcoin sent the original cryptocurrency soaring more than 7%, its biggest daily gain in months. Perhaps just as important, it boosted spirits in a sector that’s been contending with a near-constant blast of high-profile regulatory enforcement actions, bankruptcies and lawsuits." according to Bloomberg.
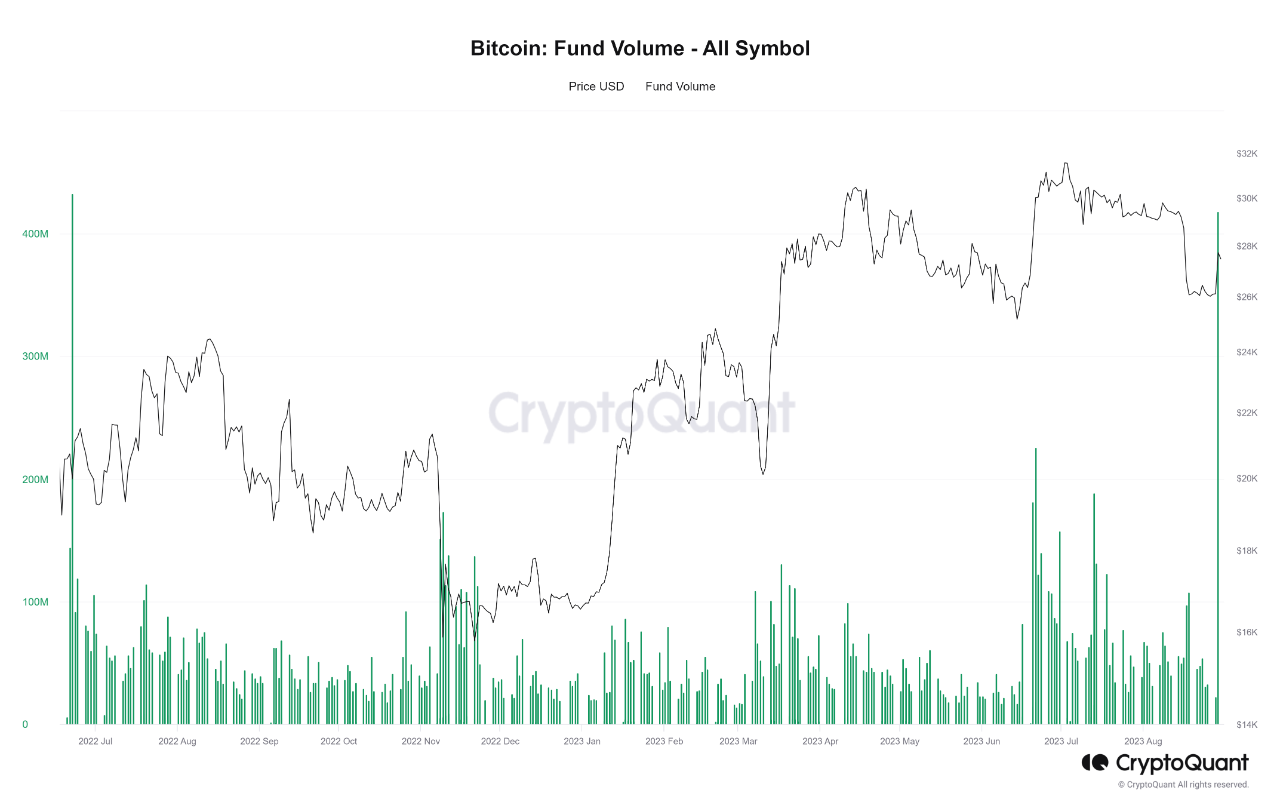
During the gloomy periods from the end of the second quarter to the present, trading volume on spot exchanges decreased and was mainly led by volume on derivatives exchanges, where long-term positivity is not guaranteed.
After yesterday, the data on CryptoQuant marked an important sign that Fund volume spiked; the entire trading volume of coins by Funds has reached the highest level since the beginning of this year.
If small investors are sitting on the sidelines and waiting for good news before positioning their assets, there is a high chance you will miss out. The FOMO situation will continue when everything is clear, so an accumulation plan during the dull period is extremely important; no one knows when the boom will officially begin.
It is just a matter of time.

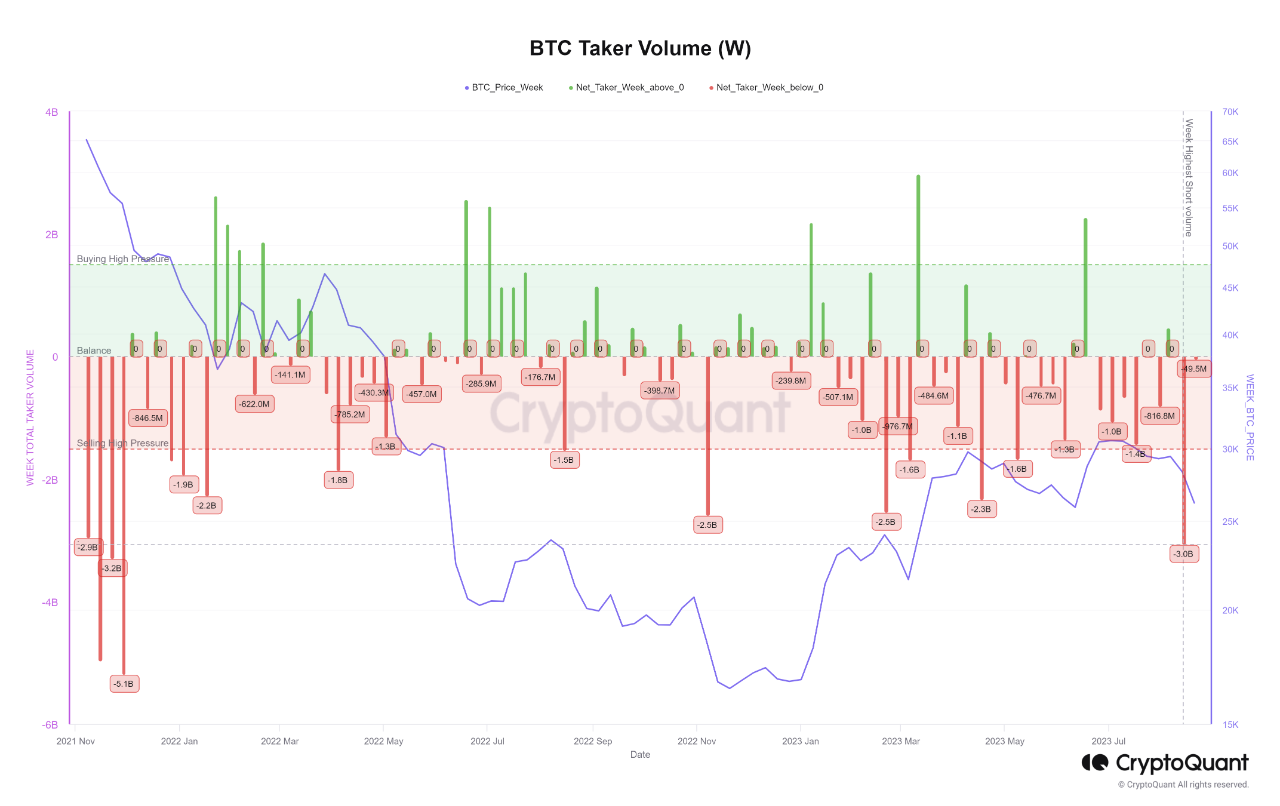
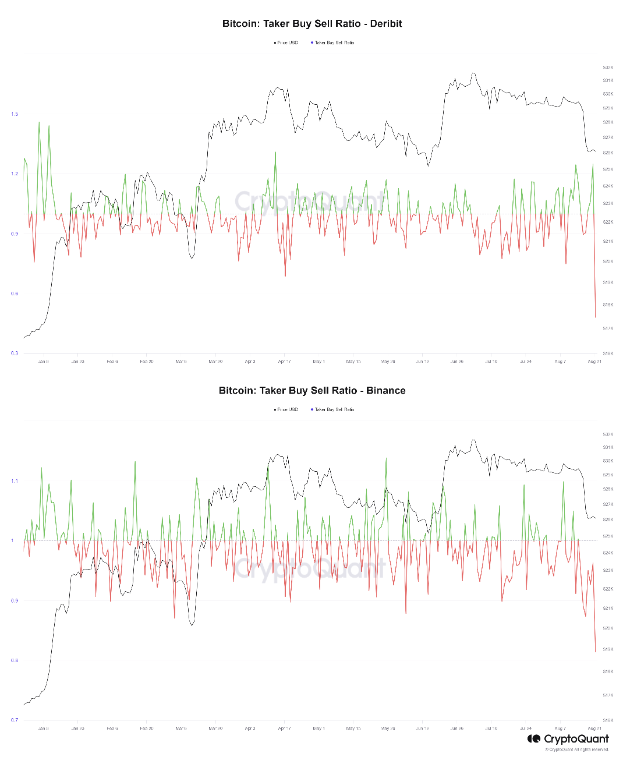
View original →1/ After a volatile week, Taker Volume aggregates the most significant negative data (shorts) from the beginning of 2022 to the present ($3B).
Based on CryptoQuant data, Fact is the lastest week volume was more remarkable than all the bloodiest stages, including Exchange or Bank run events that appeared during 2022.
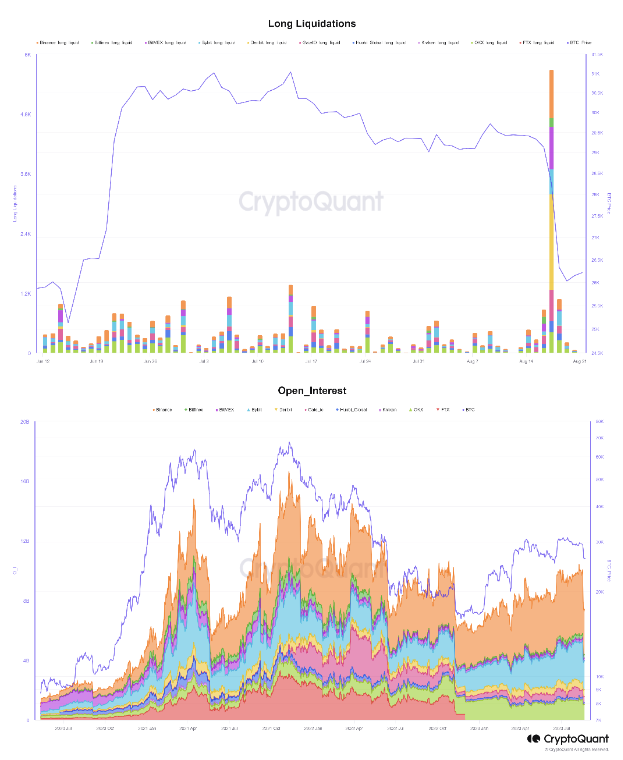
2/ Meanwhile, when comparing data on Long liquidations. We can easily recognize that the largest number belongs to Deribit, Binance, and BitMex exchanges. And these same exchanges are currently holding outstanding short-selling rates in turn.
Besides, the chart comparing the total number of Open Interest on 9 derivatives exchanges shows an impressive decrease more significant than the SVB period at the beginning of the year and the SEC FUD period.
Is this a turning point of psychological change to once again show that Bitcoin is still in the hands of a bear market? Or is it a trap that the micro and macro news have successfully set?
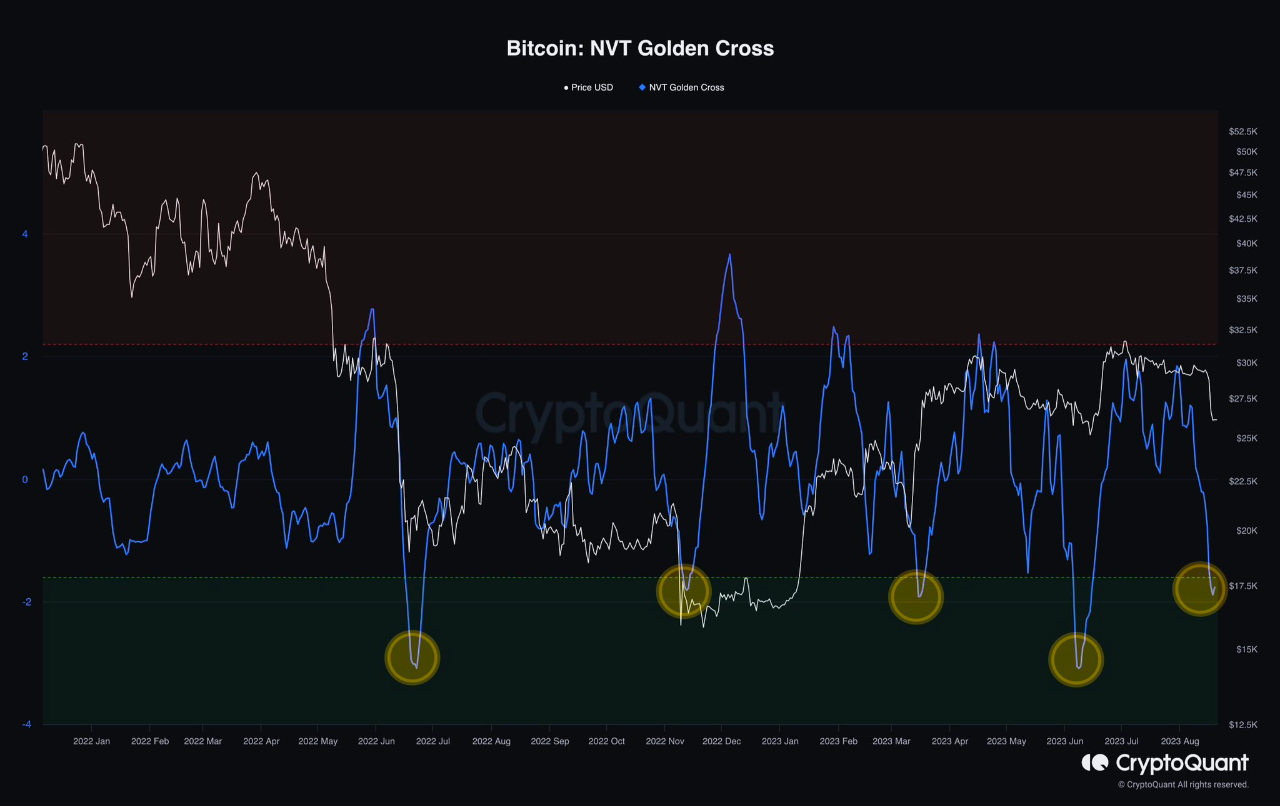
3/ The last thing to watch out for is the Golden Cross NVT data, a modified Network Value to Transaction (NVT) index that provides local tops/bottoms.
It is the fifth time NVT Golden Cross has been lower than -1.6 since the bear market started.
The previous Long signals were all successful, so what about this time?

View original →

