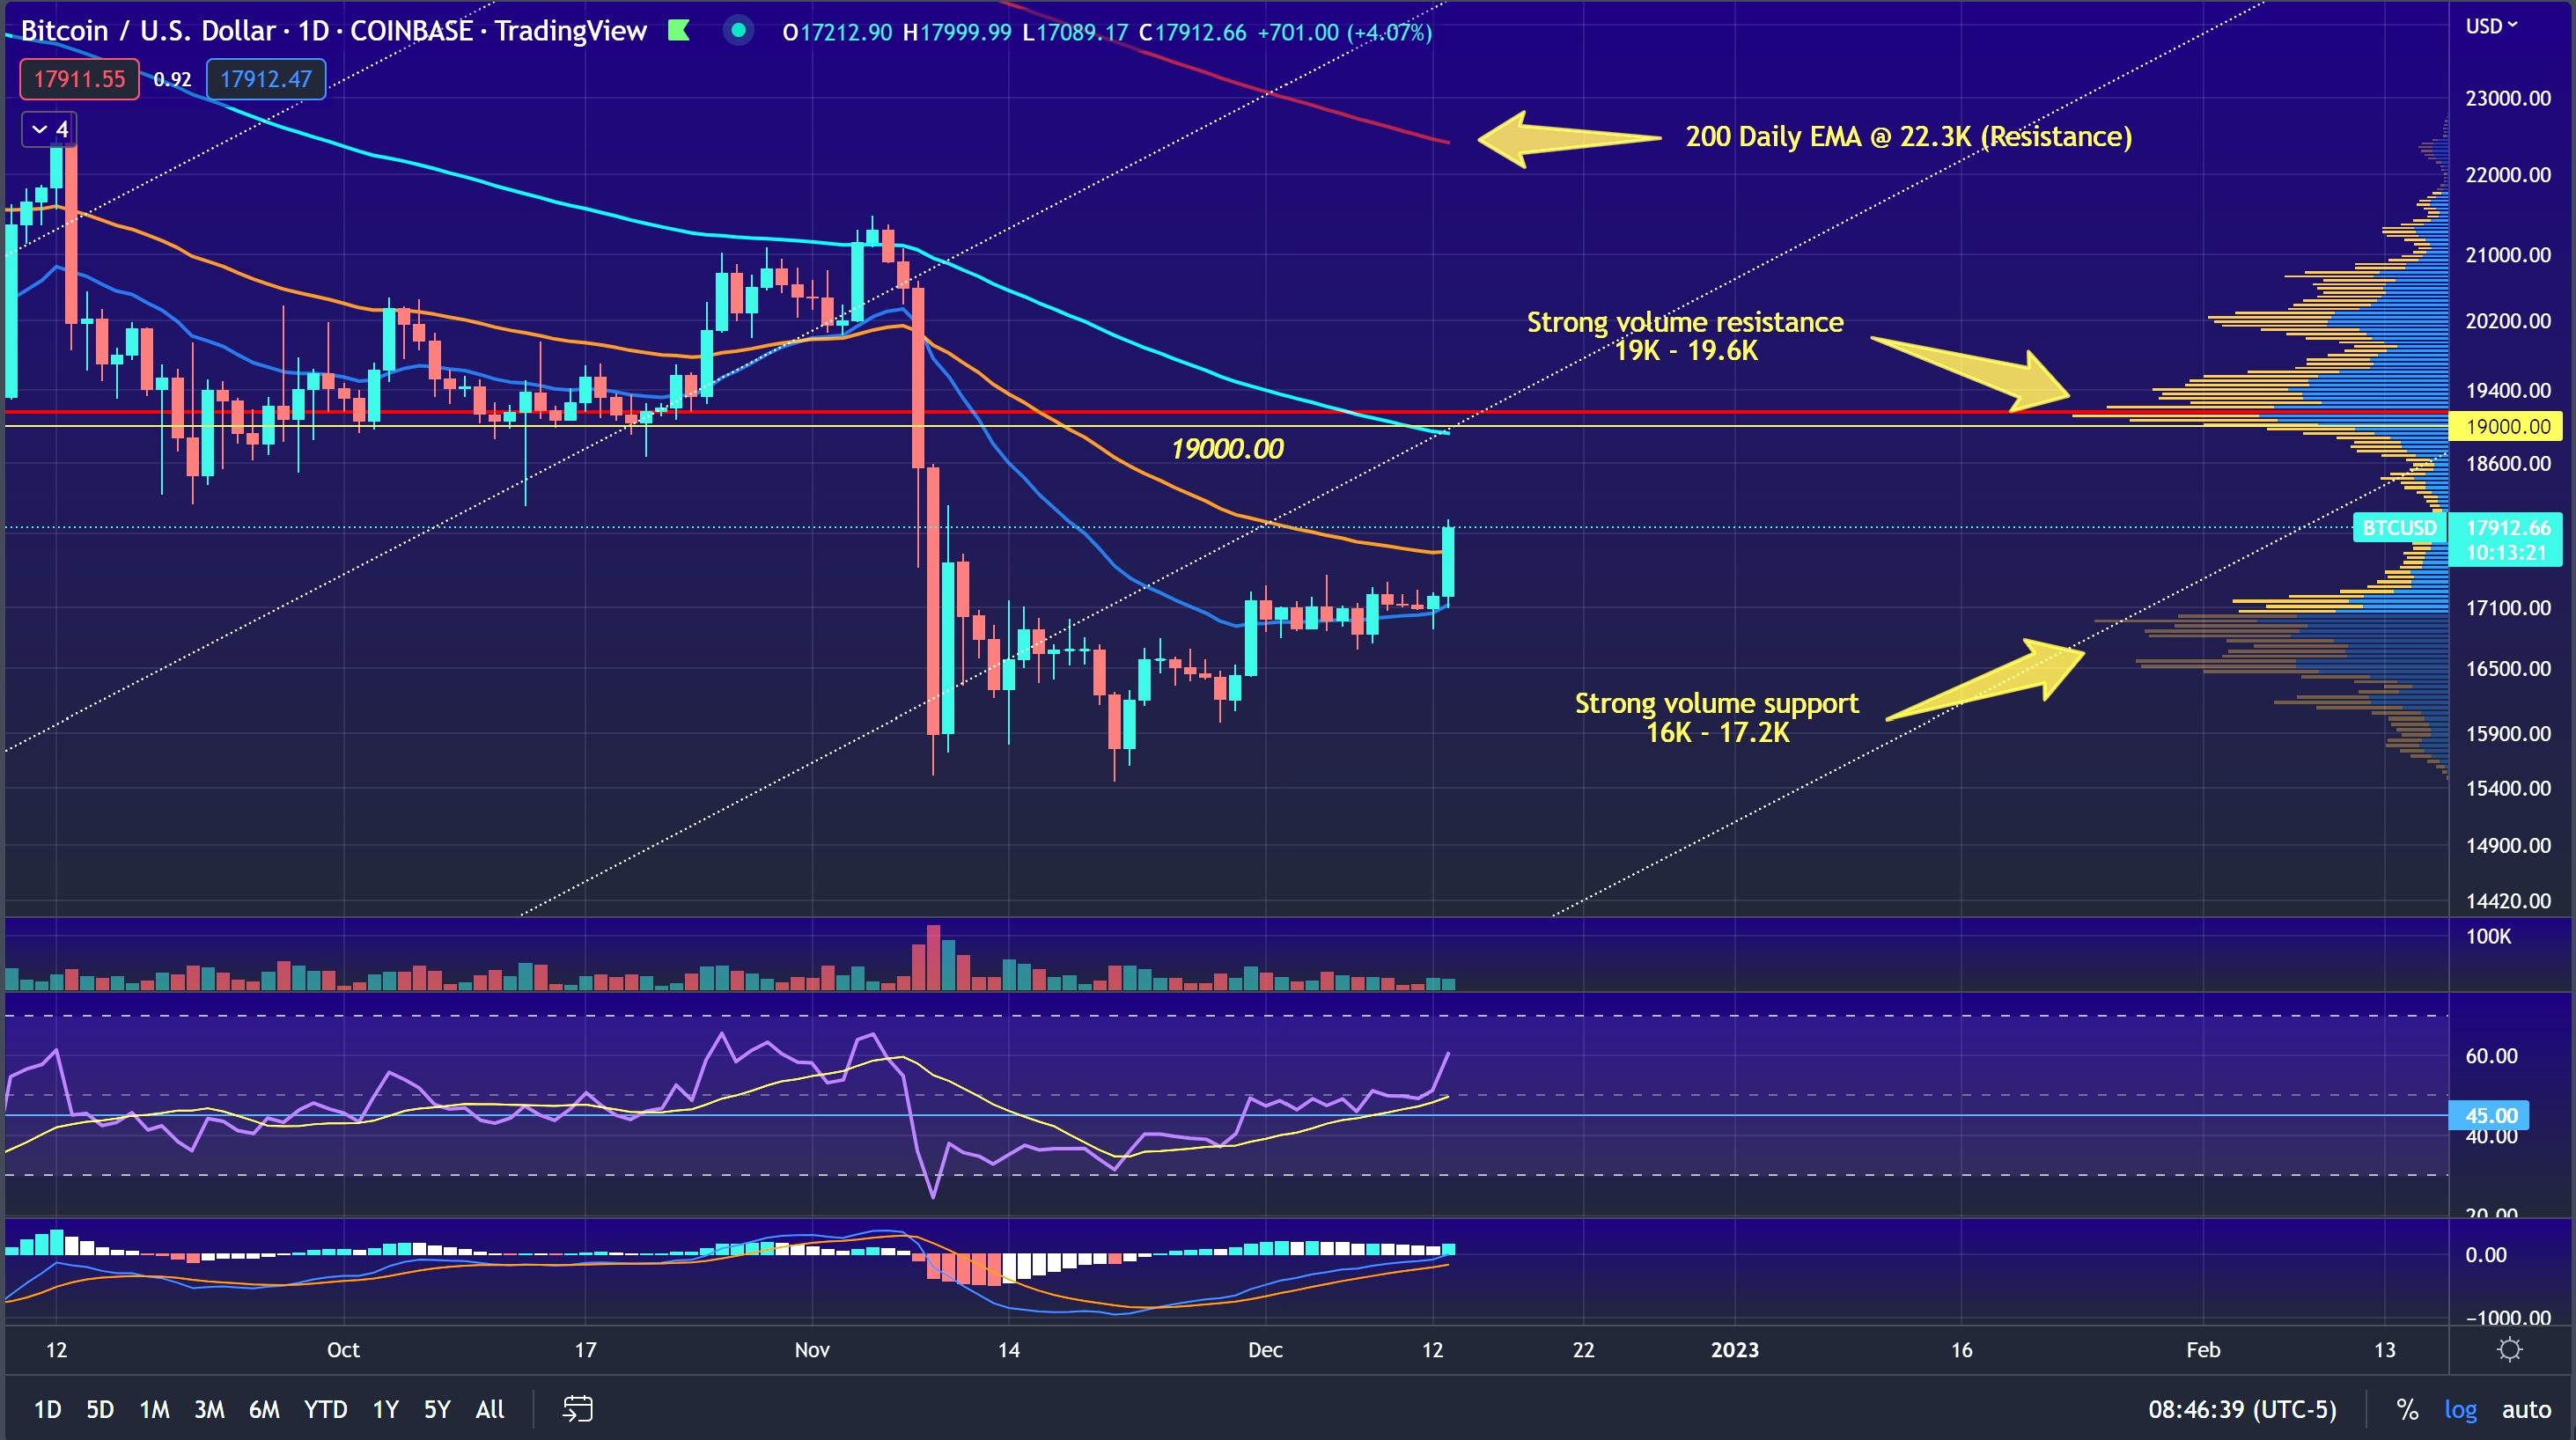
Bitcoin made it's most bullish move in a month! Why?
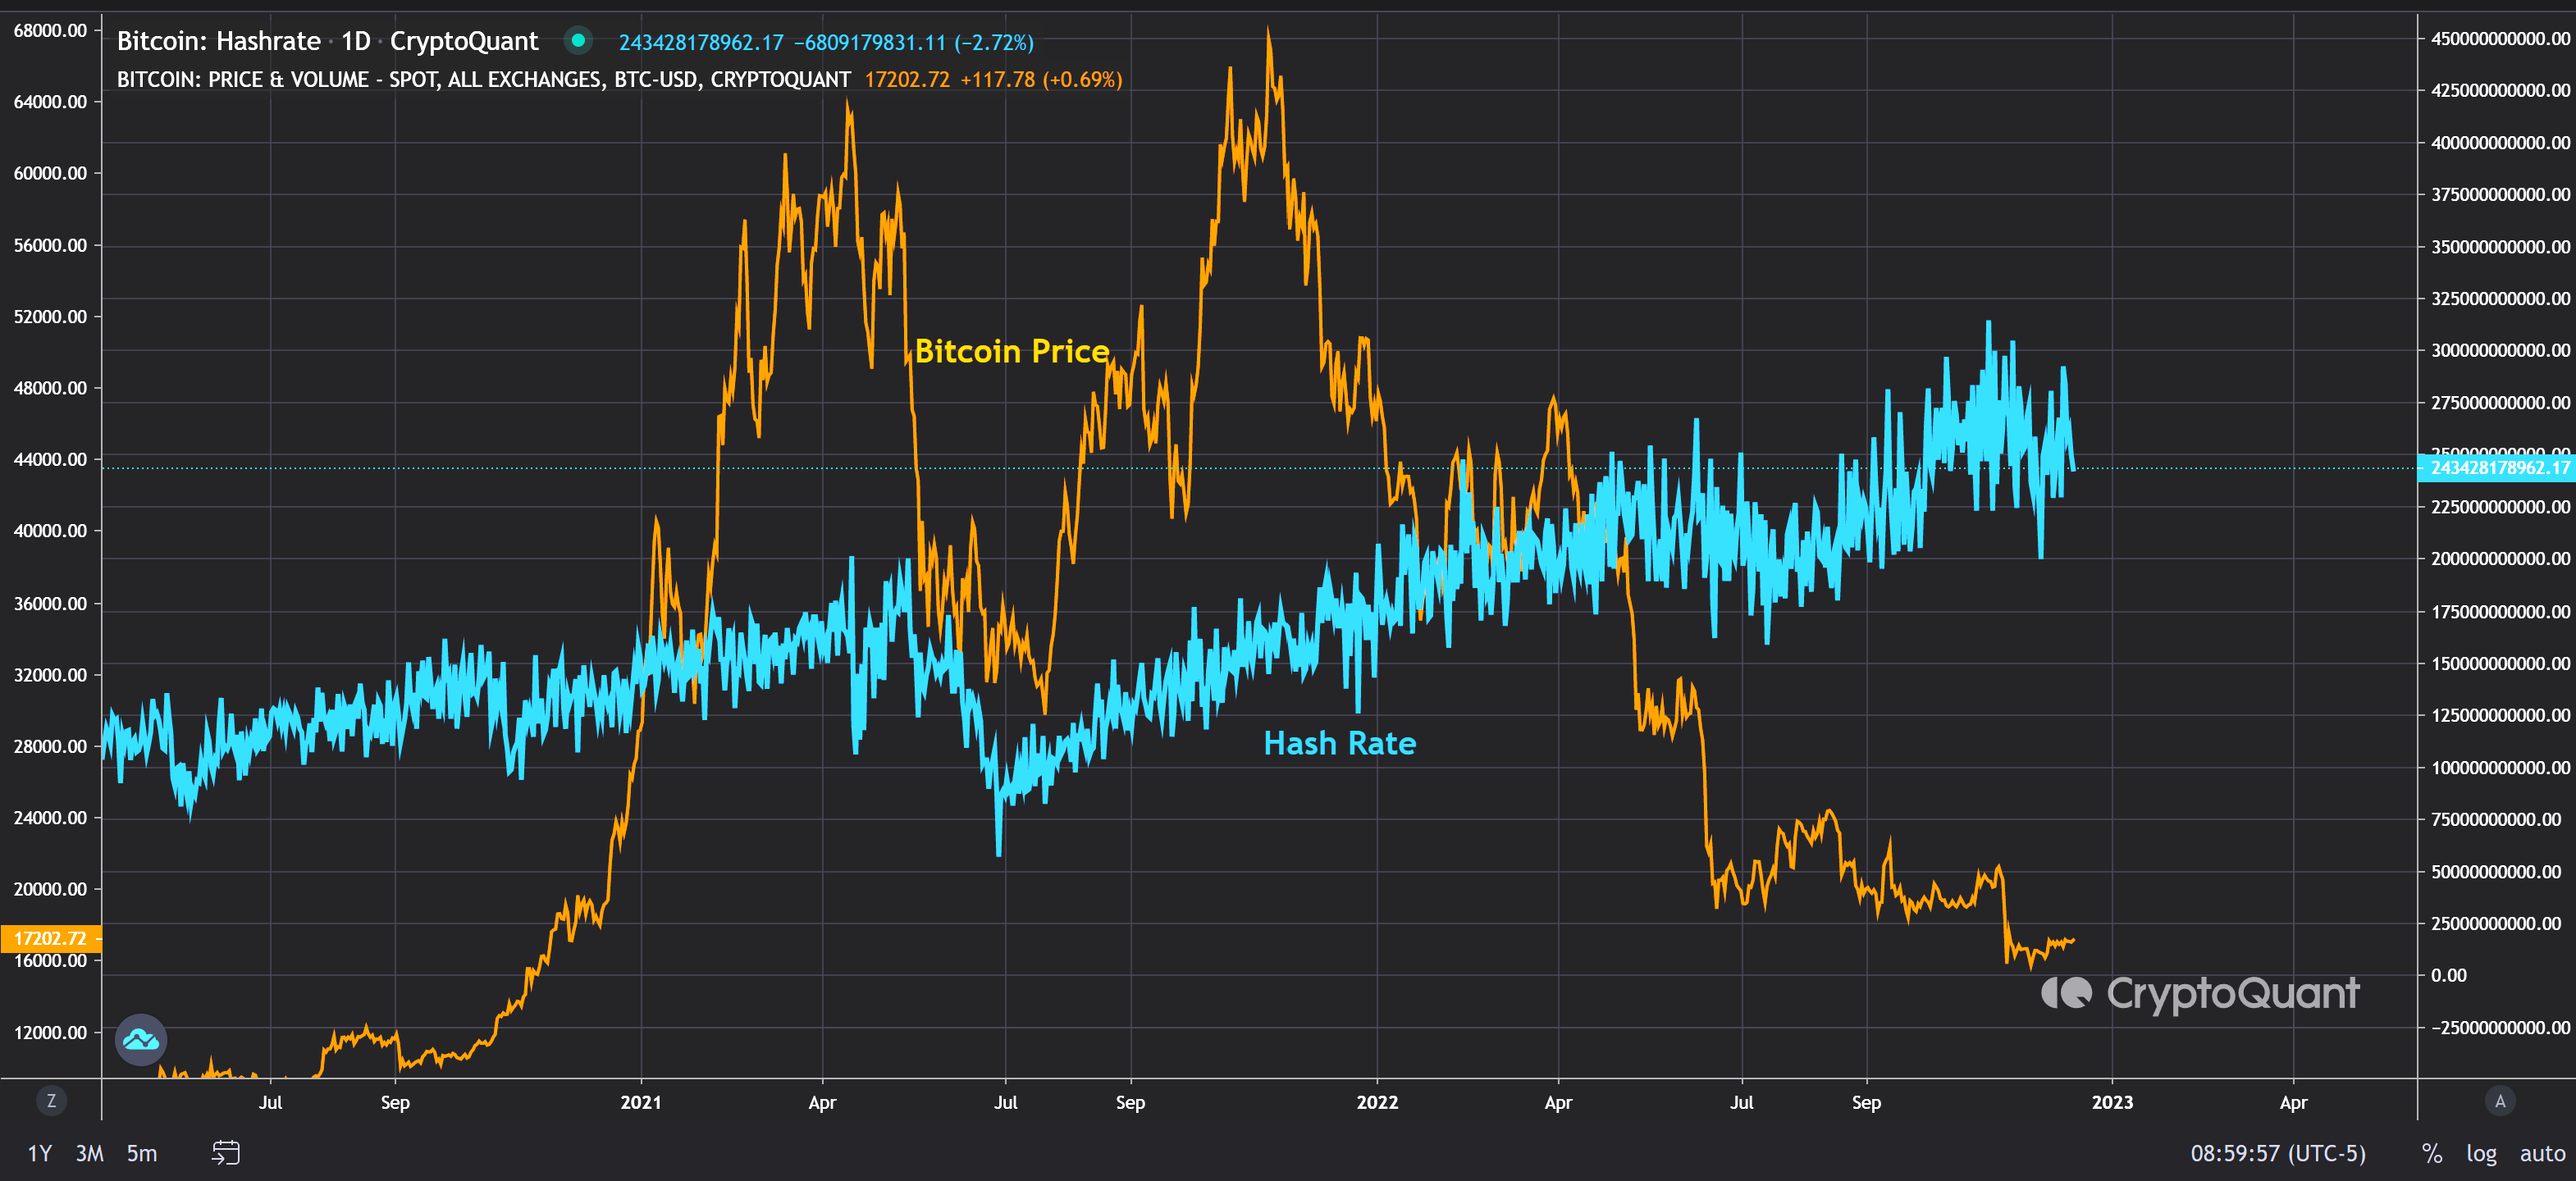
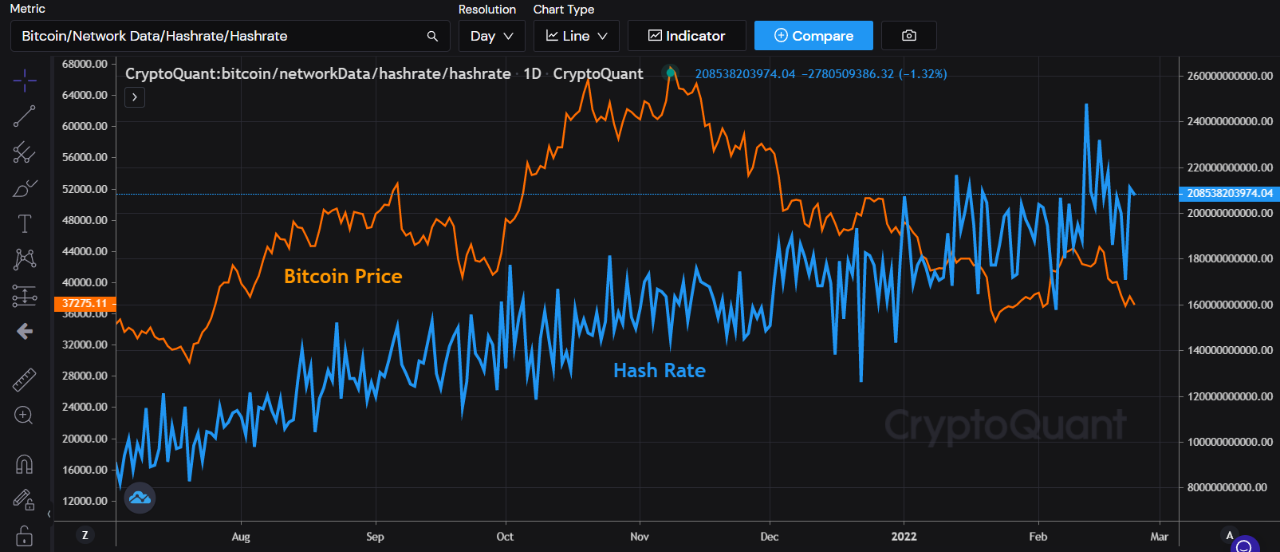
Throughout this ENTIRE bear market, Hash rate (ie. network investement) has been on the rise. Even with miners capitulating to cover costs.
FTX led to a massive rise in self custody. More BTC is moving OFF exchanges than we've ever seen, exasperating the supply shock. Demand = JUMP 📈 🆙
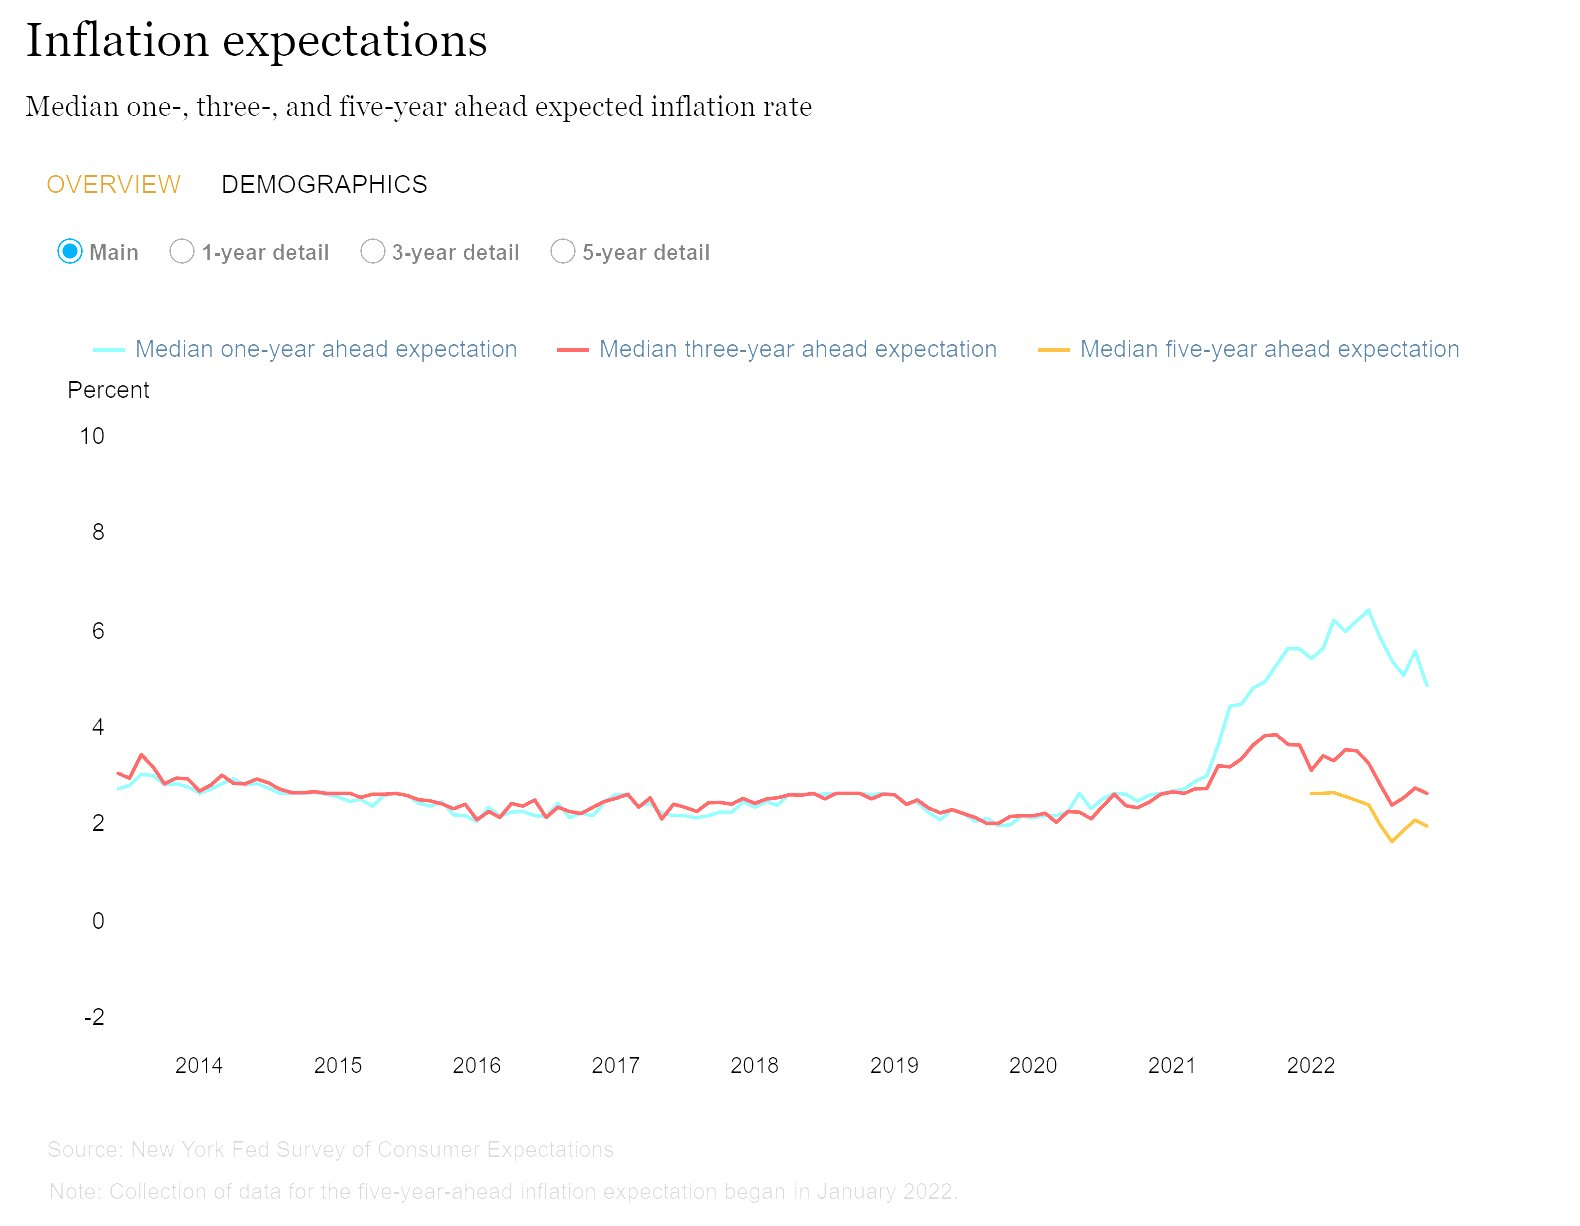
US inflation falls to 7.1%. This triggered the move and shows how correlated BTC is to the FEDs manipulation. 7.1% inflation is TERRIBLE, the fact that people think it's good is somewhat hilarious. 😅
With core CPI rising only 0.2% in Nov., and overall CPI lower the assumption is inflation has peaked and we're going into a deflationary cycle. Very bullish, and precisely why asset prices are all up.
Now, the daily. Short term support at 16-17.2K, and resistance at 19-19.6K. Larger resistance = 200 EMA at 22.3K.
Hard to imagine anything worse than FTX happening at this point. For me, the strategy remains the same. DCA and accumulation continues.
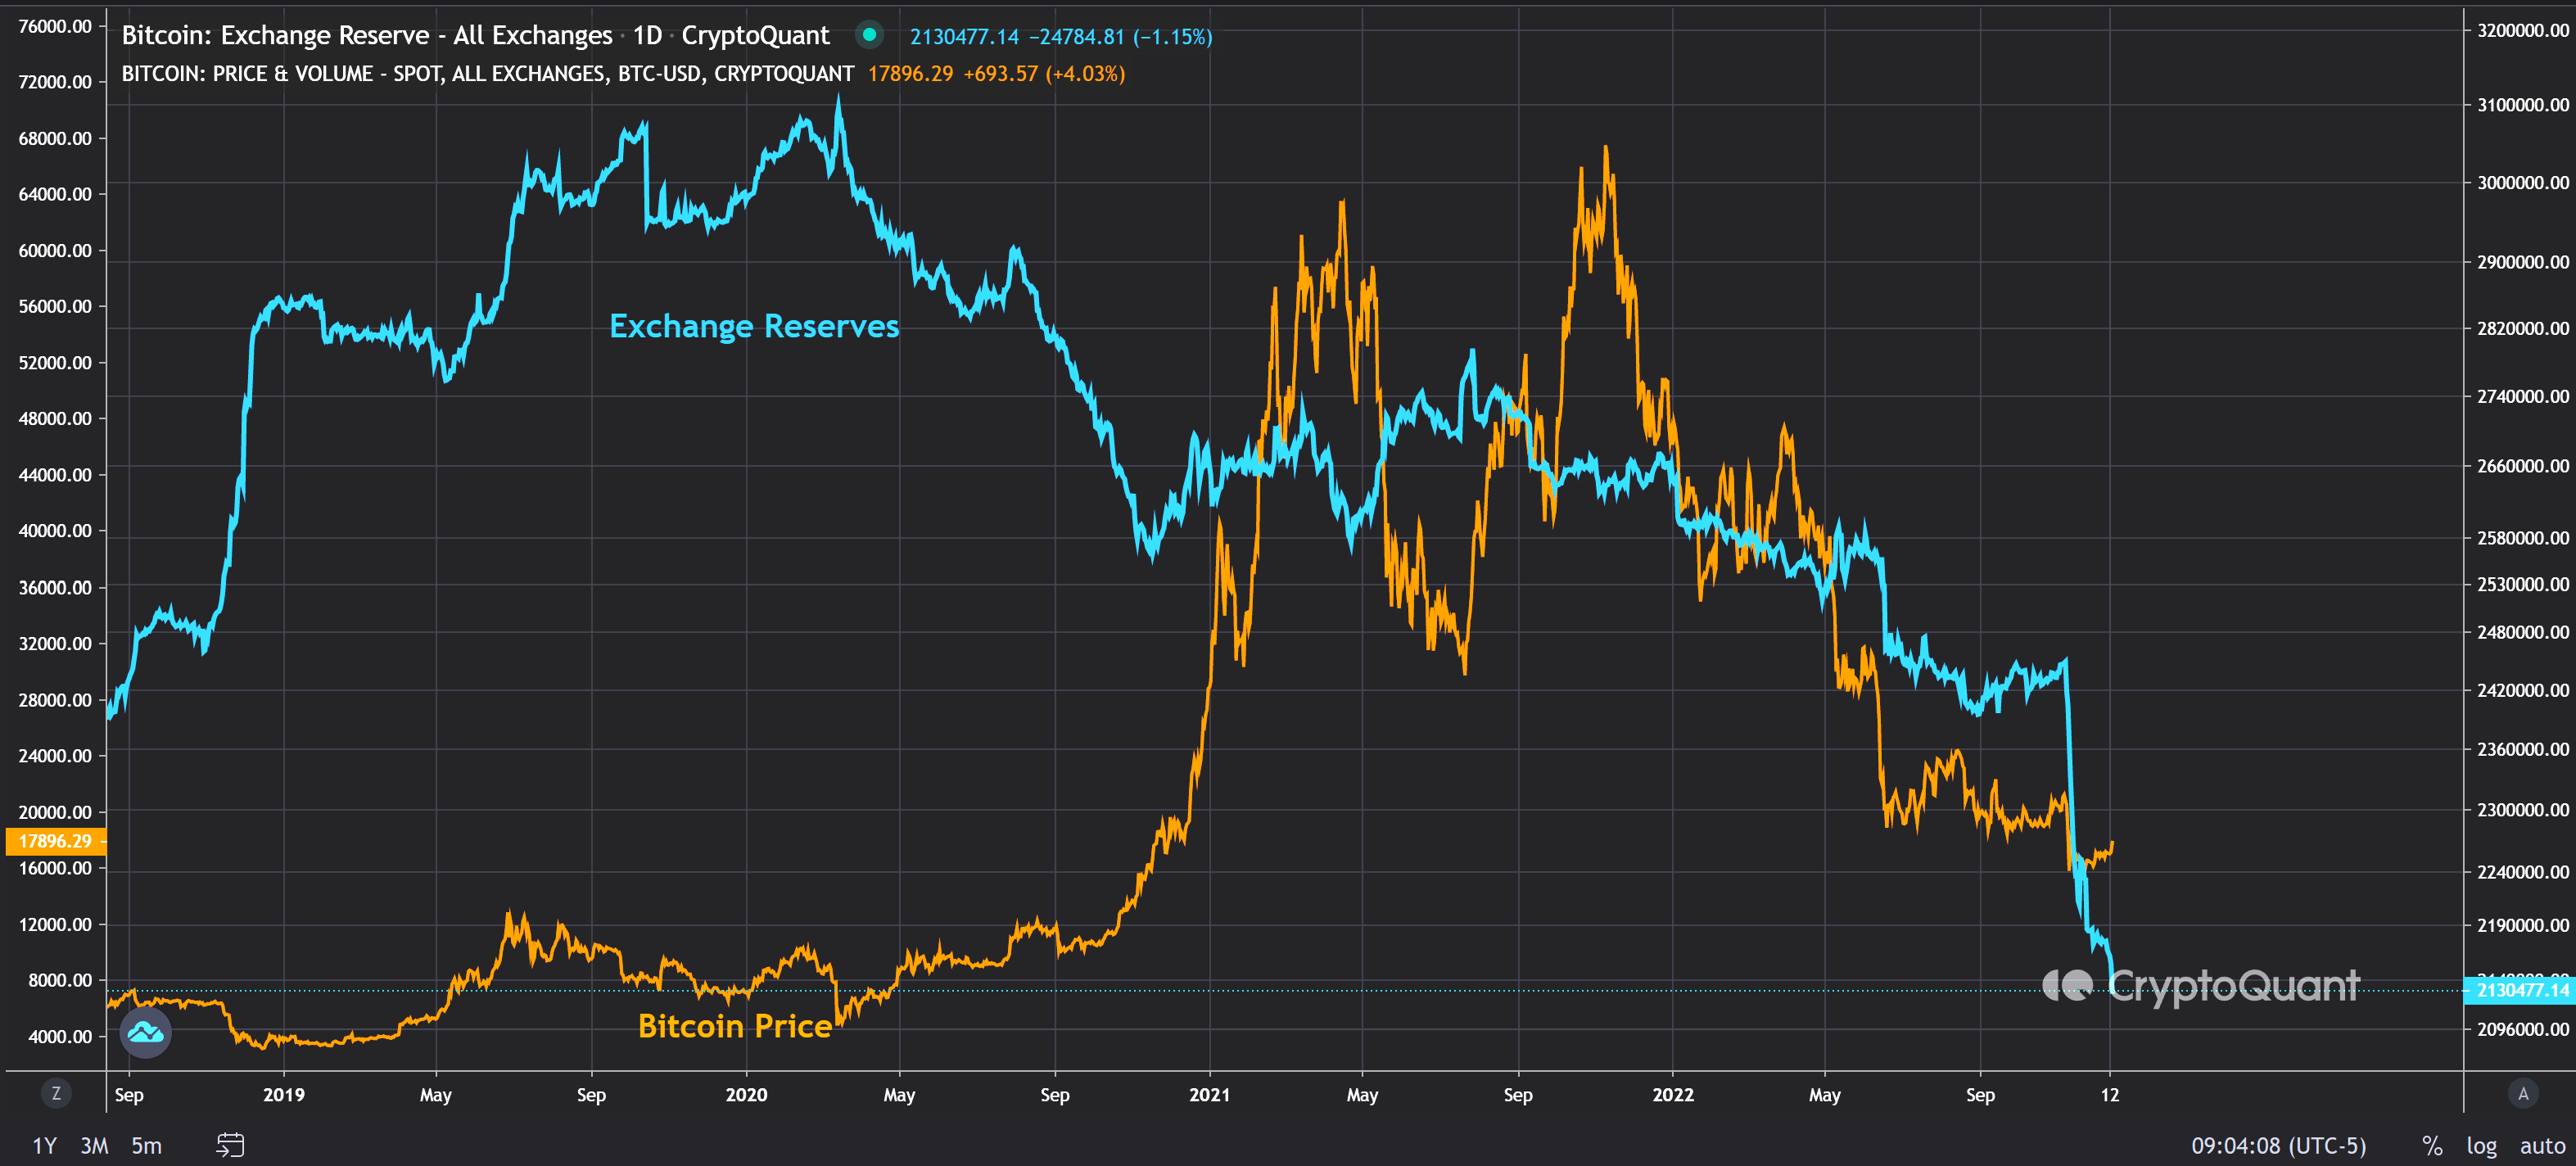

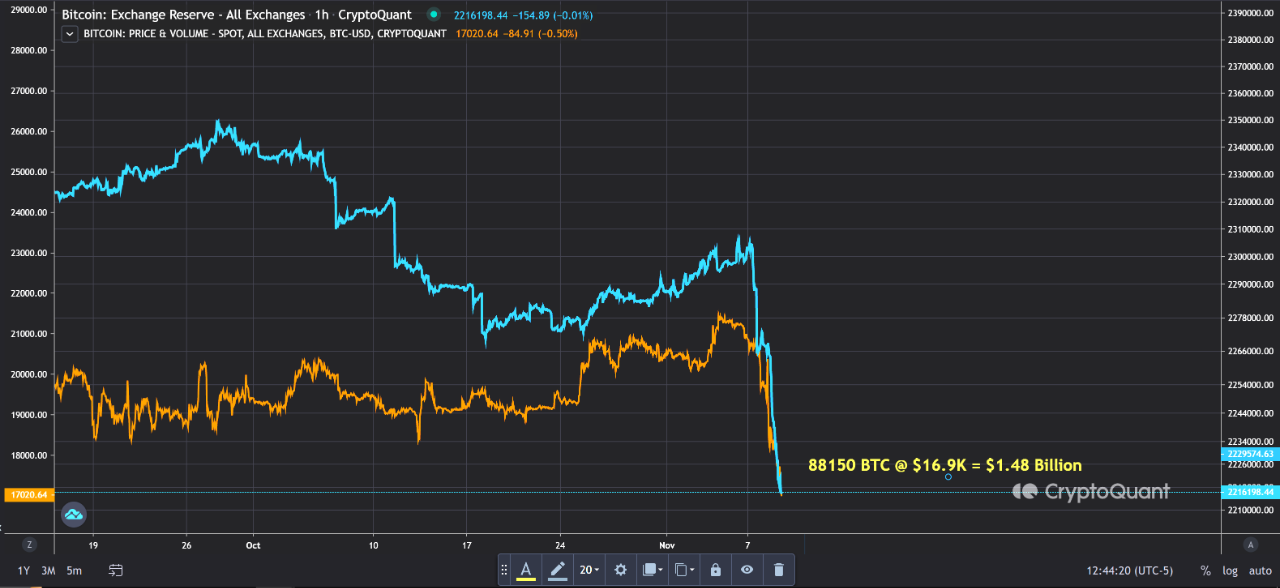
View original →Since the madness began 2 days ago. 88150 Bitcoin has been taken off exchanges. No matter what happens it seems BTC is getting more scarce. This is the backbone of crypto after all.
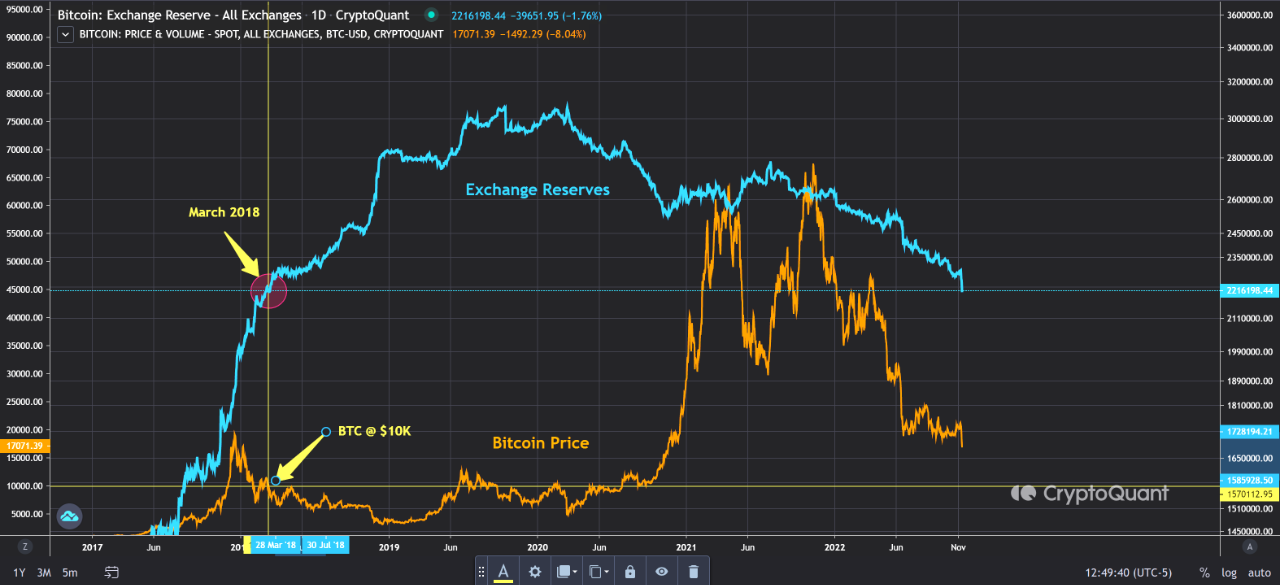
The last time reserves were this low was in March 2018, also during a bear market. However at the time, reserves on exchanges were RISING. Today, in a far more brutal global bear market. BTC Price is 70% higher, and reserves are falling.
Eventually the FED will loosen policy or risk collapsing their own markets. The printers will turn back on. The next halving will come. BTC demand will skyrocket. The writing is on the wall for 100K.. 200K.. and beyond.
The lesson from FTX, Celsius, Voyager, and Terra? Everything must be backed by Bitcoin and other audited liquid assets. No bailouts here.
“The Times 03/Jan/2009 Chancellor on brink of second bailout for banks.”
- BTC Genesis Block

View original →There are two things happening at the same time that indicate to me a major BTC breakout is imminent.
#1 - Bitcoin price action has been in a bear market in all of 2022 and consolidating since early May. Over the last 24 hours we've seemingly flipped the top of this trend into support at the critical apex. We've also seen support form at the 45 level of the RSI along with the RSI and it's MA converging. This adds credence to the fact that the price is becoming constricted enough for even small amounts of demand to cause a rapid price appreciation. TA tells us a bounce here is very likely.
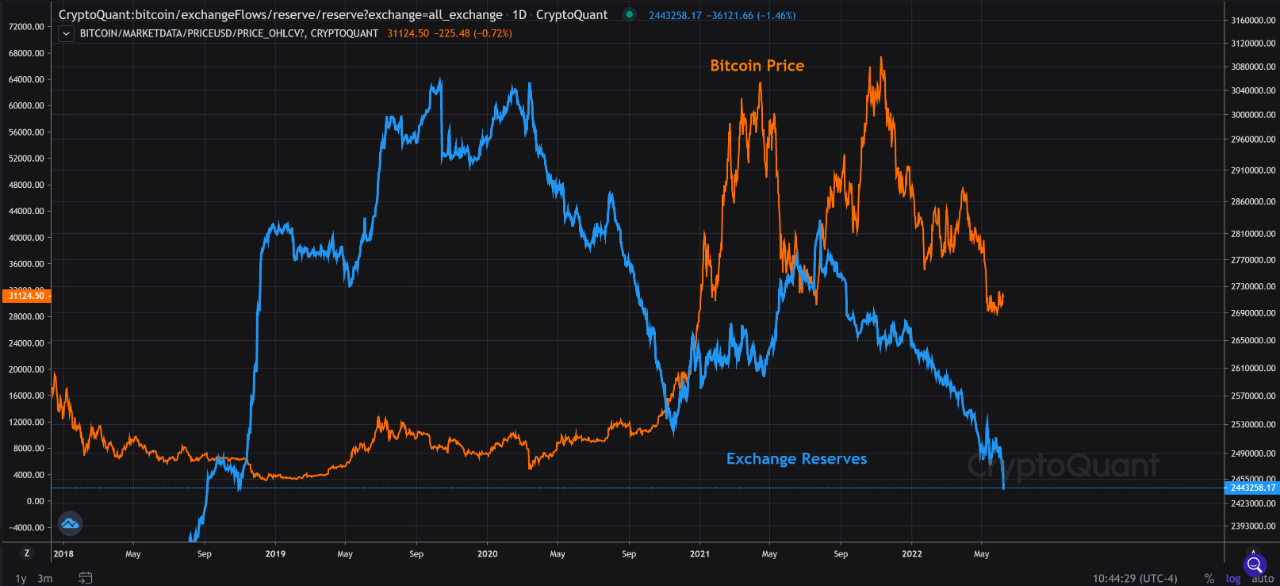
#2 - At the same time we are seeing BTC exchange reserves hit new 4 year lows. This tells us that market sentiment has not changed. Nobody is rushing to sell their Bitcoin, in fact as prices stay low more Bitcoin is being purchased and removed from exchanges. This means the supply shock is increasing rapidly.
Take this with a grain of salt is Bitcoin has been incredibly unpredictable lately.
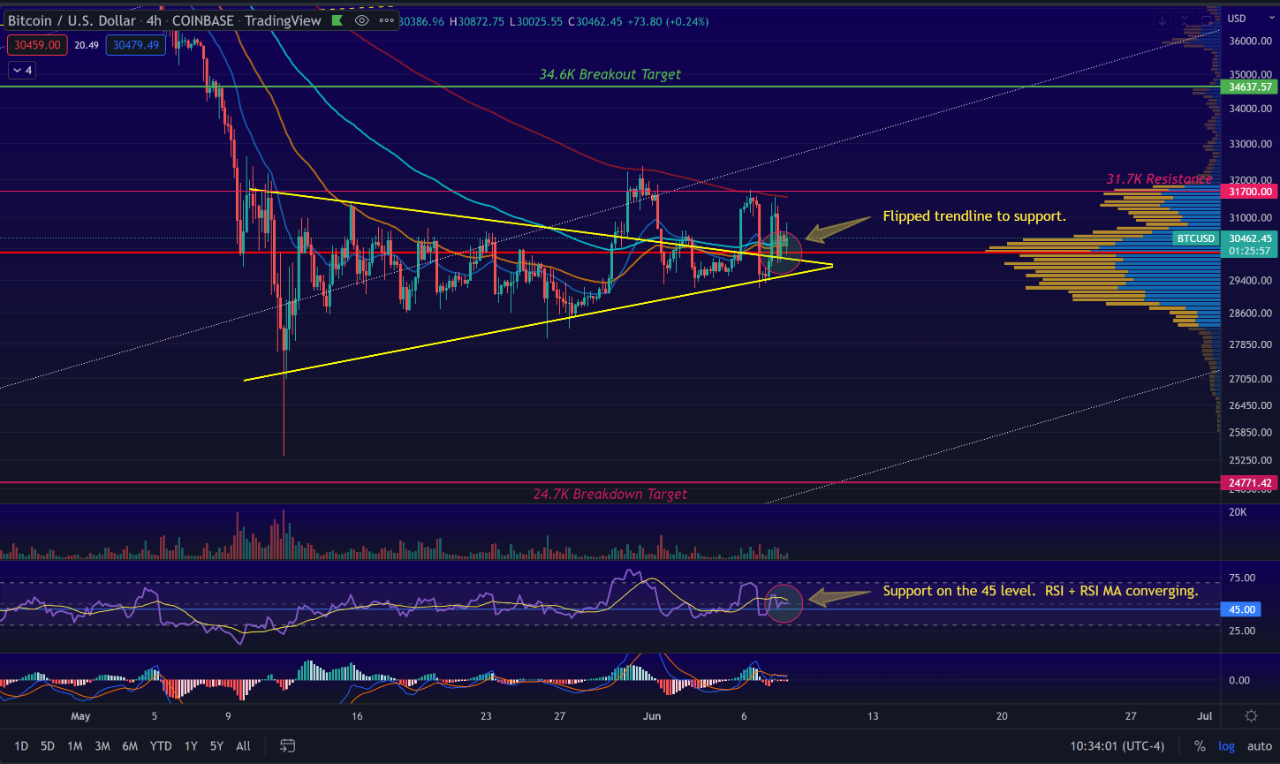

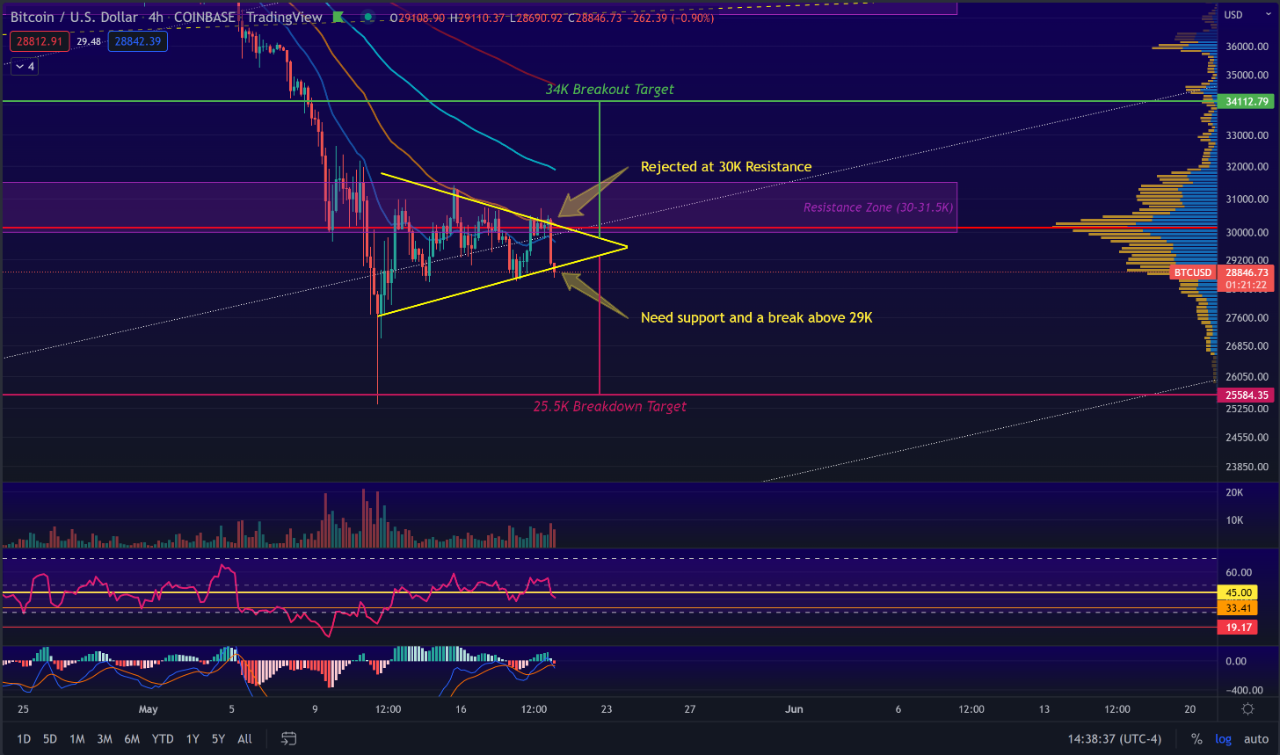
View original →Right now Bitcoin is creating a pattern indicating volatility is around the corner. We see a continuation pattern on the 4hr chart that's reaching it's apex!
This decision point will determine whether we see a continuation of the micro (2 week) trend to the upside, or the macro (6 month) trend to the downside. The upside target is 34K if we see a breakout from this pattern, while the downside target is 25.5K. Like I said, pretty important!
Note that the price could set a higher high or lower low then go right back into a continuation pattern - essentially extending the triangle. For now, that is the best case scenario to continue accumulation and avoid further downside. It's also the most likely scenario in my eyes.
Personally I'm still accumulating like a monster at these prices and have orders all the way down to 22K just in case we see a large liquidity sell off triggering immense long liquidations and a wick to the downside.
Let me know how you think this will play out!

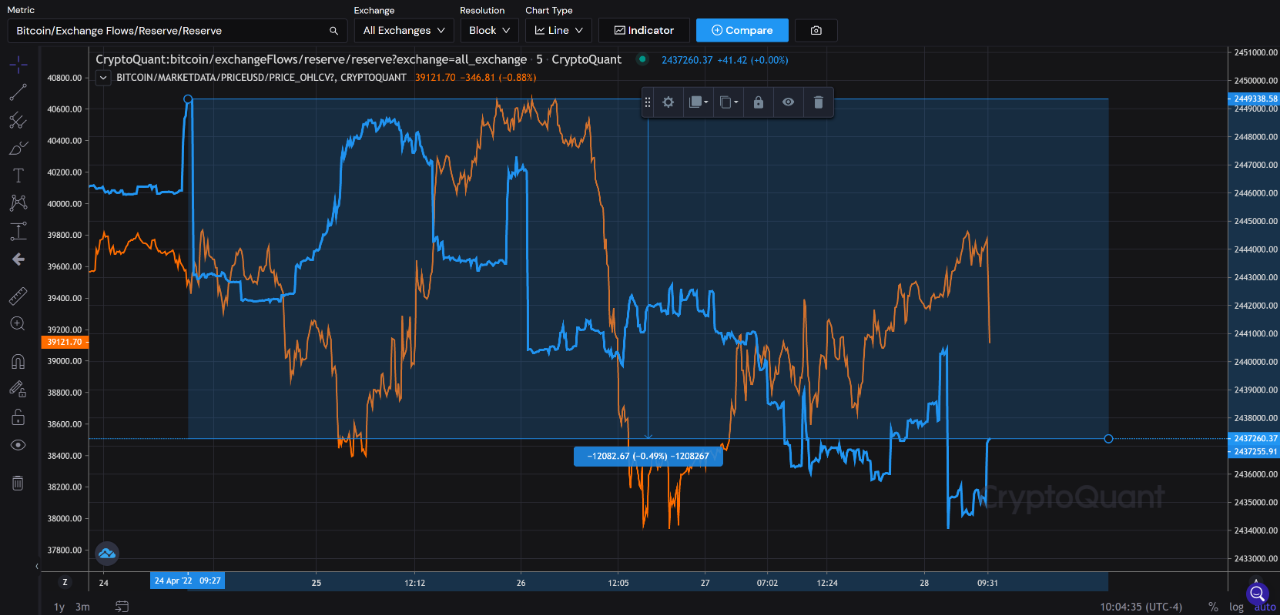
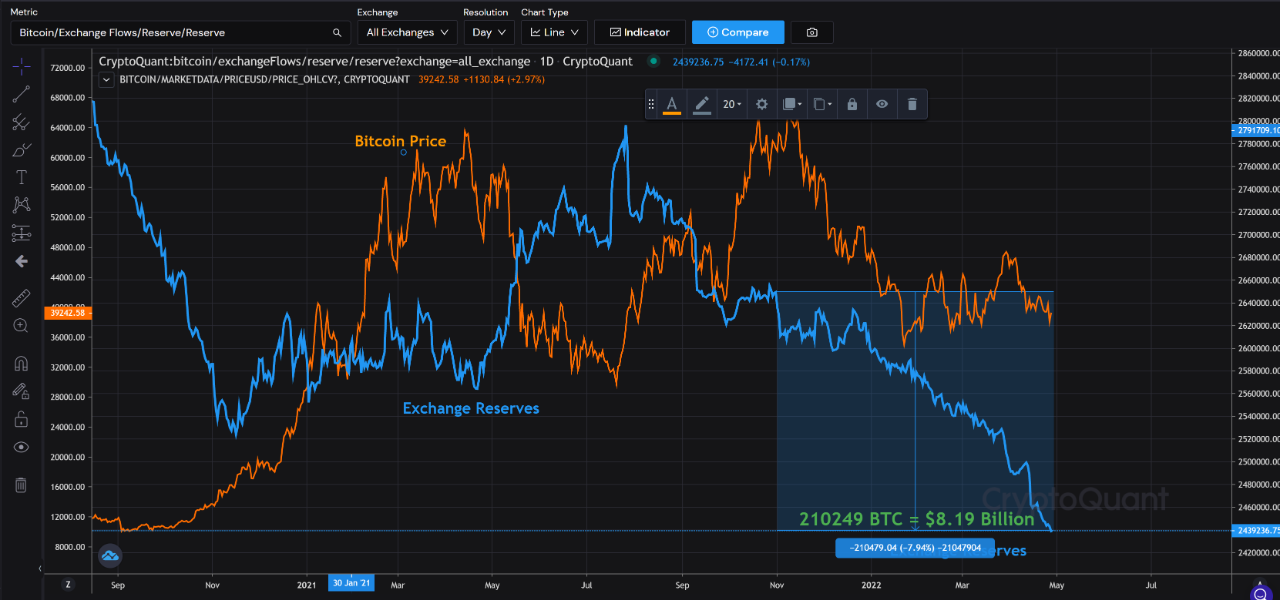
View original →As we are all aware since November 2021, Bitcoin has been in what many consider a bear cycle within the larger bull cycle. The key about this consolidation that makes it differ from prior 'bear markets' is quite simple. Previously during bear markets we saw exchanges get flooded with Bitcoin.
This time however.. things are very different.
Exhibit A - In the first screenshot you can see that this week alone we have seen 12,000 BTC ($468 Million at $39,000 per/btc) exit exchanges.
Exhibit B - In the second screenshot we have zoomed out and are looking from the Nov 2021 price top until today and we see that roughly 210,000 BTC have exited exchanges for a staggering value of $8.19 Billion (once again at $39,000 per/btc)
The correlation here is simple. Accumulation is ongoing and is heavy. Supply is diminishing. This is the opposite of what we've seen in actual bear markets. In my eyes, it's a signal that says when demand rises the price can only go up.

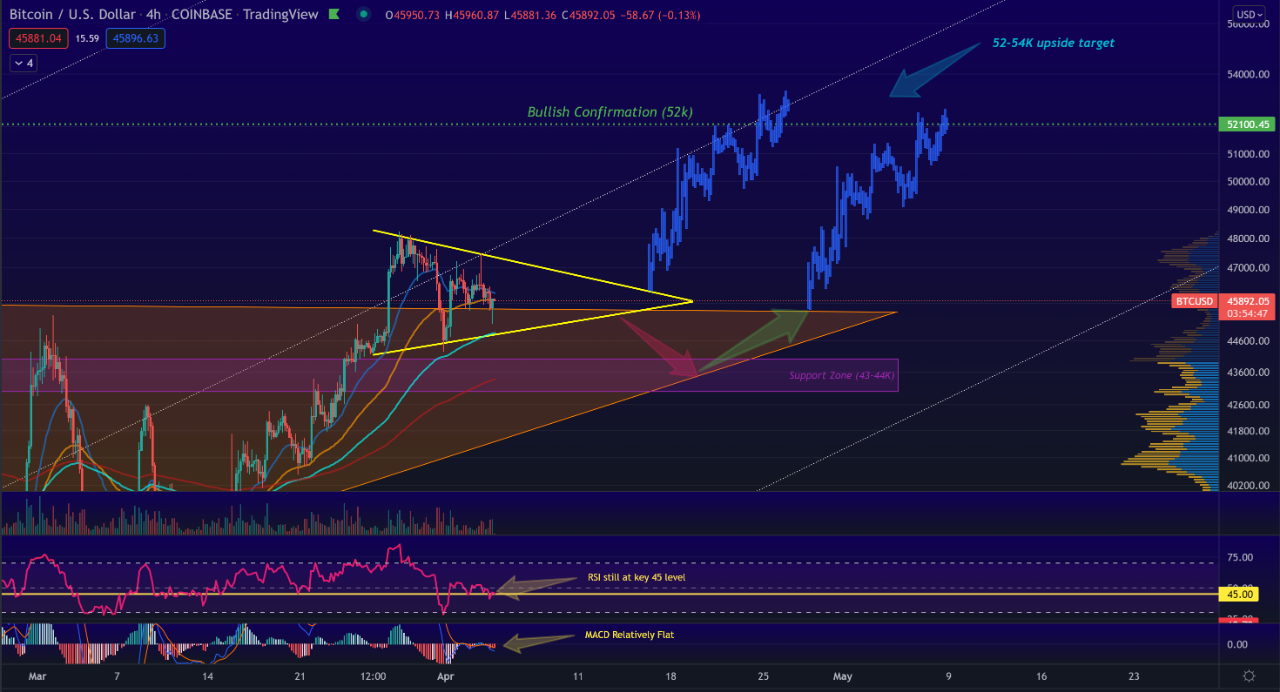
View original →Looking at the 4hr Bitcoin chart, in orange we have a large multi-month ascending triangle whose top we just bullishly flipped into support over the last week. This pattern has a breakout target of 63K, with 52K being the bullish confirmation (where we cement a trend reversal).
The smaller yellow triangle is a shorter term consolidation pattern, this has a breakout target anywhere from 52-54K and it's immediate support lies at 43-44K to maintain bullish momentum.
The interesting thing here is that both patterns support each other. The breakout target for the short term yellow symmetrical triangle is also the bullish confirmation of the long term orange ascending triangle; in addition it's support is also within the larger triangle.
Unless we have a major revelation that suddenly makes BTC bearish, I see this as being a very likely possibility taking us back to 50-55K by early May.
As we say in the world of TA. The trend is your friend! Until it ends.

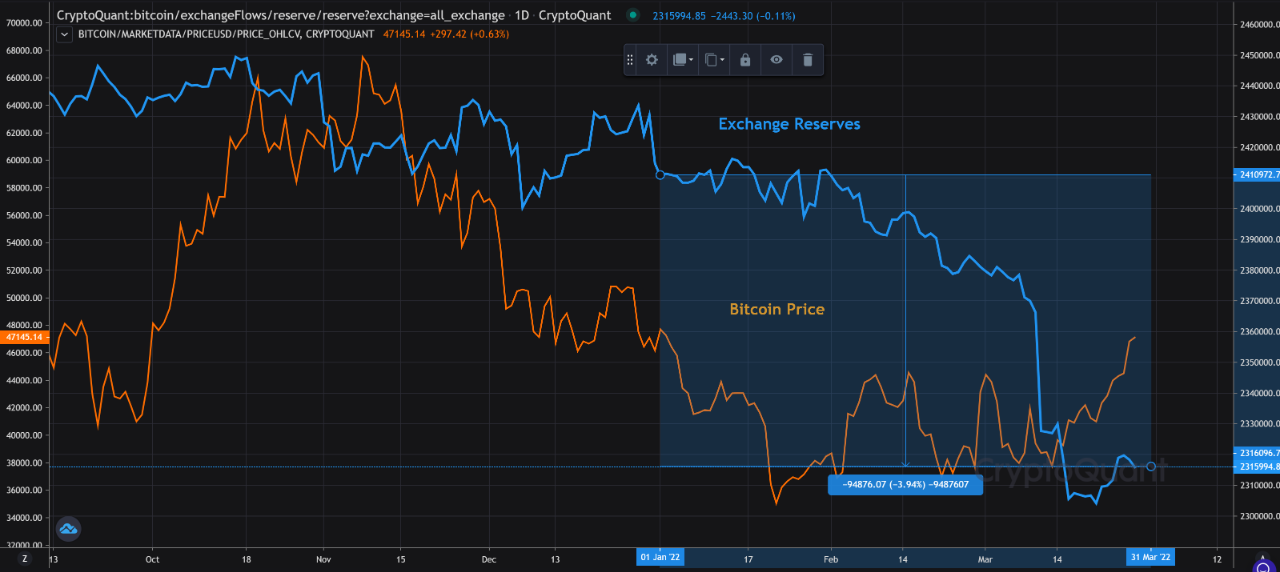
View original →Overall one trend we have seen since 2020 is the Bitcoin exchanges reserves continually dropping. In the simplest terms this means that the supply of bitcoin available on exchanges for withdrawal is depleting. This is a very interesting metric because it tells us something major about the market.
Since 2020, we have seen a net outflow of Bitcoin. The market has been through some times of fear in the last two years, yet nobody wants to sell a substantial amount of the supply so these numbers keep falling. So far this year, 94800 BTC has left exchanges (roughly $4.5 Billion).
I think we will see this continue to drop into the next halving as prices keep rising. We are now seeing nation states realize the value of Bitcoin as many no longer trust reserve currencies due to the possibility of sanction. Institutions keep watching their money burn to inflation and it is a highly feasible expectation to see many make their first Bitcoin investments in the near future.
In 2022,

View original →Take a look at the info. below and decide for yourself what happens next.
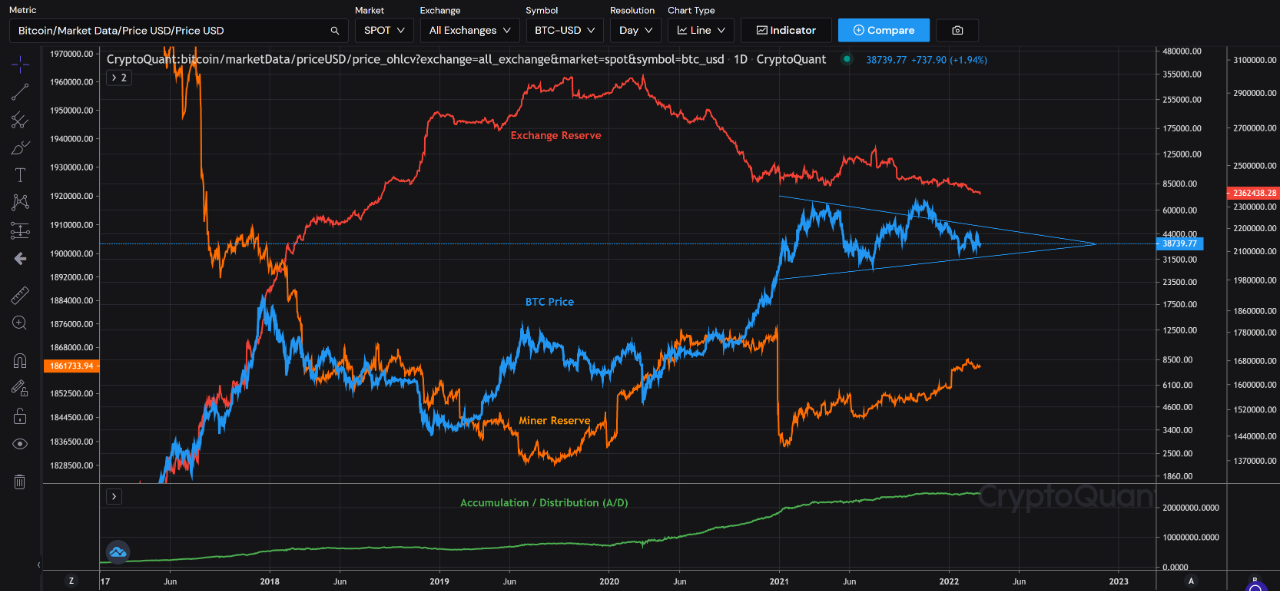
- Amount of BTC left on exchanges (exchange reserve), keeps dropping.
- Amount of BTC being held by miners (miner reserve), keeps rising.
- Bitcoin Price getting constricted in a 1+ year consolidation / continuation pattern.
Continuation patterns normally break in the direction the price was moving prior to the pattern forming. In the case of Bitcoin that would indicate a breakout target somewhere around 178K (the timeframe is a dynamic variable as we set more highs/lows within the pattern).
The US has announced to the world that we are building a framework to leverage and become leaders in digital assets and their innovation. This applies to CBDCs, Bitcoin, and DeFi. This means the battle for global leadership within the internet of money and finance has just been made official.
Now.. where do you see Bitcoin heading? Think about it, and act accordingly.

View original →Bullish(Nuanced)BTC
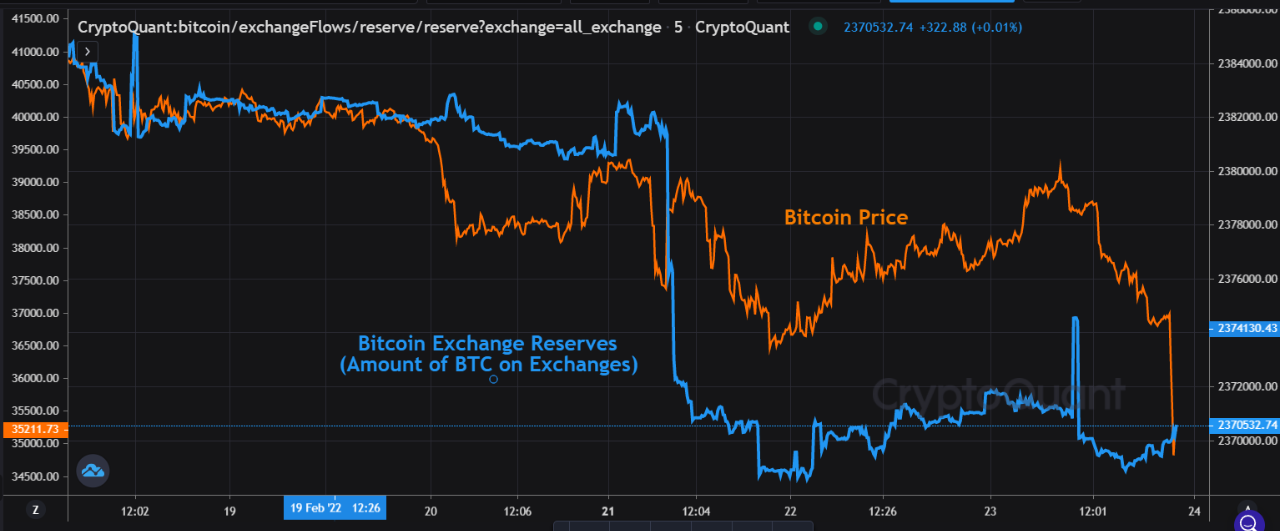
2/24/2022 Bitcoin dropped to 34.5K in the initial hours as news of Russia's invasion hit the wire. The majority of sell pressure came from BTC already on exchanges, ie. traders and those who prepared to sell in advance. We did not see any rapid spikes in exchange inflows and reserves are still hovering at multi-year lows. This will be a key metric to monitor in the coming hours.
This by no means dictates what happens next, but it's definitely a good sign that the news was not met with massive inflows of BTC hitting exchanges.
Hash rate also remains at near all time highs meaning BTC is poised to handle a lot more network load / throughput should it's need arise. I think the coming weeks will give us our first glance at where the next decade of political power will be heading. It will also be a defining moment for Bitcoin as I suspect adoption rates will skyrocket as vulnerabilities and inefficiencies in traditional financial system / legacy banking system become very clear, very soon.

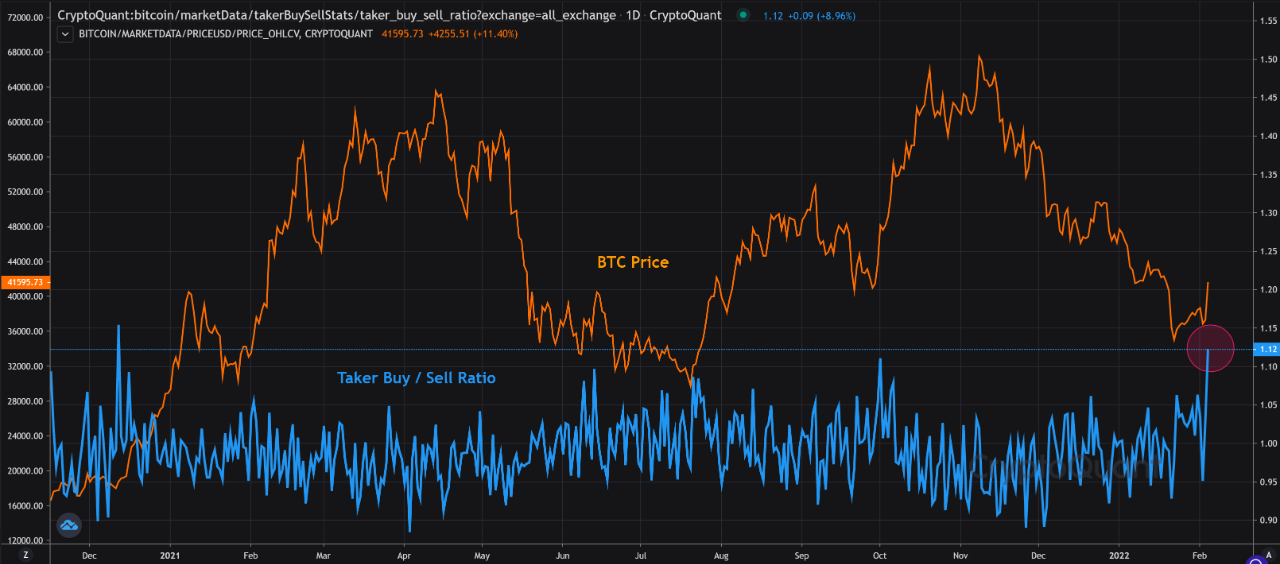
View original →The Taker Buy / Sell Ratio is a pretty straightforward metric.
Values above 1 indicate more buyers are willing to buy at higher prices (ie. increased buying pressure). This is a clear indicator of bullish momentum.
Values below 1 indicate more sellers are willing to sell at lower prices (ie. increased selling pressure). This is a clear indicator of bearish momentum.
Now take a look at the chart. Notice that the metric is spiking high above 1, similar to Dec. 2020 when we started the first move to the 60K all time highs. At the time we know MicroStrategy and Square announcing their Bitcoin purchases had a lot to do with it. We now see taker buy volume spiking to similar levels without any news, during a time of great uncertainty in global markets.
The question is why. It seems far too rapid to be from inflation and retail buying. Do some people have information we don't? Should we expect news of major adoption coming? Or is this an elaborate bull trap? What do you think?

View original →

