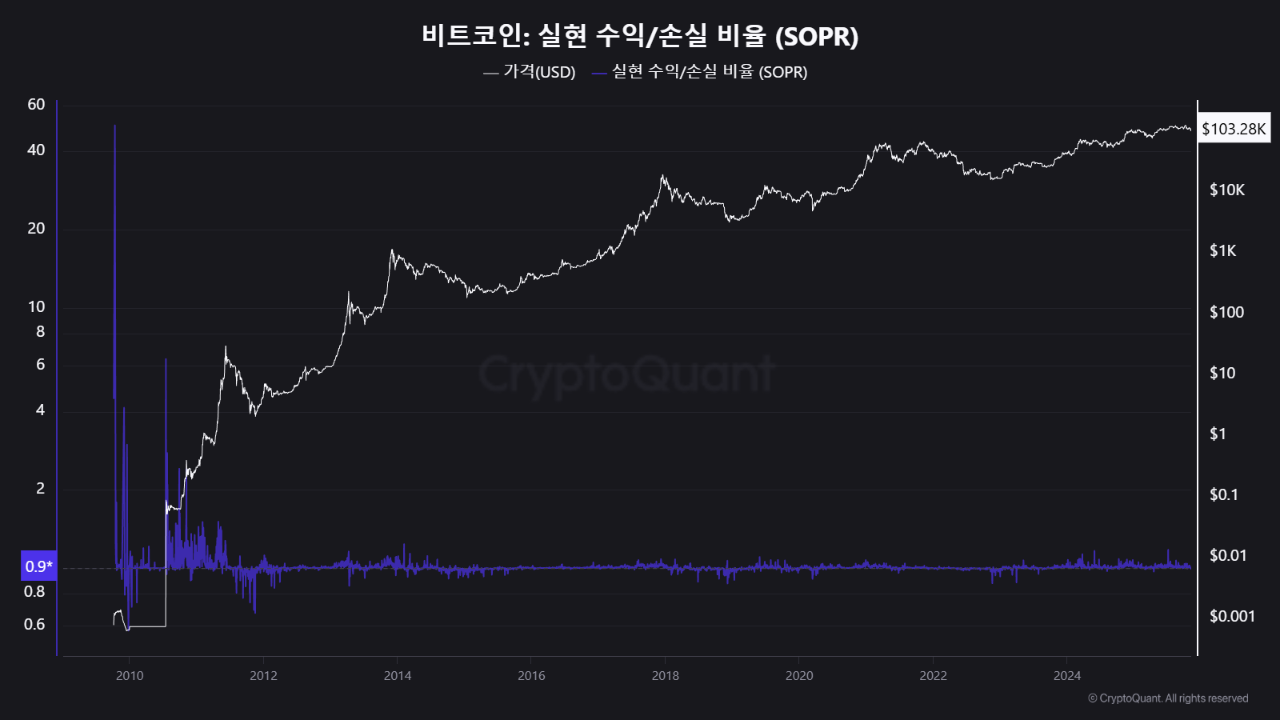
For anyone wondering if the recent crash below $105k was just a "correction," this chart provides the definitive answer: **No. It was a full-blown capitulation event.**
This is the **SOPR (Spent Output Profit/Loss Ratio)**.
* **Purple line > 1.0:** The market is selling in **profit**.
* **Purple line < 1.0:** The market is selling at a **loss**.
**Here's the analysis:**
Look at the far-right side of the chart. That sharp, vertical dip in the purple line **below the 1.0 level** is the single most important signal of the last 48 hours.
This is the statistical proof of **'distress-driven selling'**.
This is the sound of holders who bought at $105k, $108k, and $110k finally giving up and **panic-selling at a significant loss**.
**Why this matters (The Insight):**
Historically, these capitulation spikes—where 'Maximum Pain' is reached and weak hands are flushed out—are the very events that **carve out a hard, structural bottom.**
This SOPR data is the **'WHY'** behind our entire analysis.
It confirms **WHY** the $98k-$99k level held. It wasn't just a technical support line; it was the **fundamental point of 'maximum capitulation'** where the market finally absorbed all the forced sellers.
The panic is over. The leverage is flushed. The 'tourists' are gone.
Now, the battle shifts from finding a floor to breaking the new, consolidated resistance ($106k-$108k). The bottom is in.

View original →Summary:
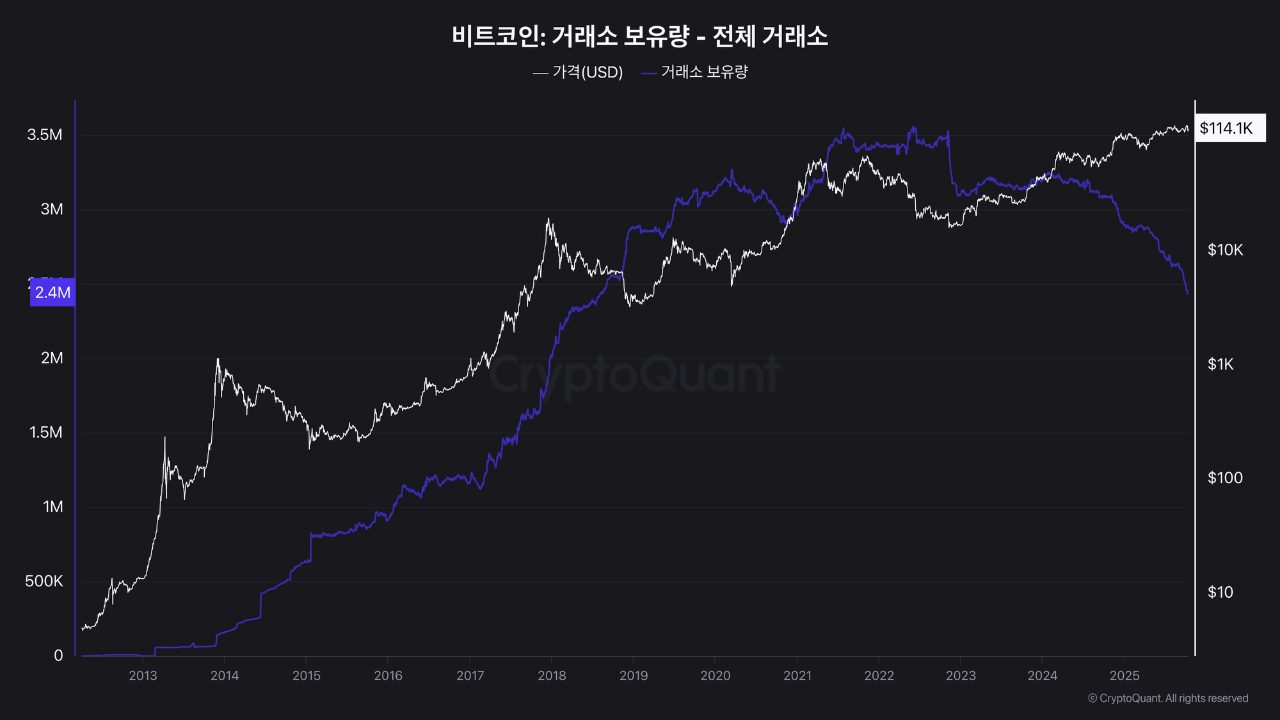
Bitcoin held on centralized exchanges has fallen to its lowest level in over 10 years, signaling a tightening supply environment and continued accumulation by long-term holders and institutions. Despite recent price consolidation near $114K, on-chain data suggests structural strength beneath the surface.
⸻
🔹 Key Observations
• Exchange Reserves: Now at ~2.4M BTC, down from over 3.5M BTC in 2020.
• This decline marks one of the longest and most consistent outflow trends in Bitcoin’s history.
• Fewer coins held on exchanges = reduced immediate sell pressure.
• On-chain movement shows consistent withdrawals to cold wallets and institutional custody.
⸻
🔹 Historical Context
• From 2013 to 2018, reserves rose sharply as centralized exchanges grew and new liquidity entered the market.
• Since 2020, reserves have steadily declined, coinciding with institutional adoption, ETF custody growth, and long-term holder accumulation.
• The same pattern preceded major bull runs in 2020 and 2021.
⸻
🔹 Interpretation
1. Supply Tightening:
The available BTC for trading is shrinking. Each outflow wave historically preceded large bullish impulses.
2. Smart Money Accumulation:
Long-term investors and funds continue to transfer holdings off exchanges — signaling conviction.
3. Institutional Storage:
Growth of custodial ETFs and regulated platforms amplifies the long-term holding trend.
⸻
🔹 Conclusion
Bitcoin’s exchange reserves dropping to multi-year lows indicate a supply-side shock in progress.
While short-term volatility may persist, the long-term structure shows accumulation rather than distribution.
This supply contraction could serve as a foundation for the next expansion phase, similar to the 2020 setup.
⸻
Chart Source: CryptoQuant – Bitcoin Exchange Reserves (All Exchanges)
Author: Chairman Lee (Professional Analyst)

View original →Bullish(Nuanced)BTC
10/14/2025 Summary:
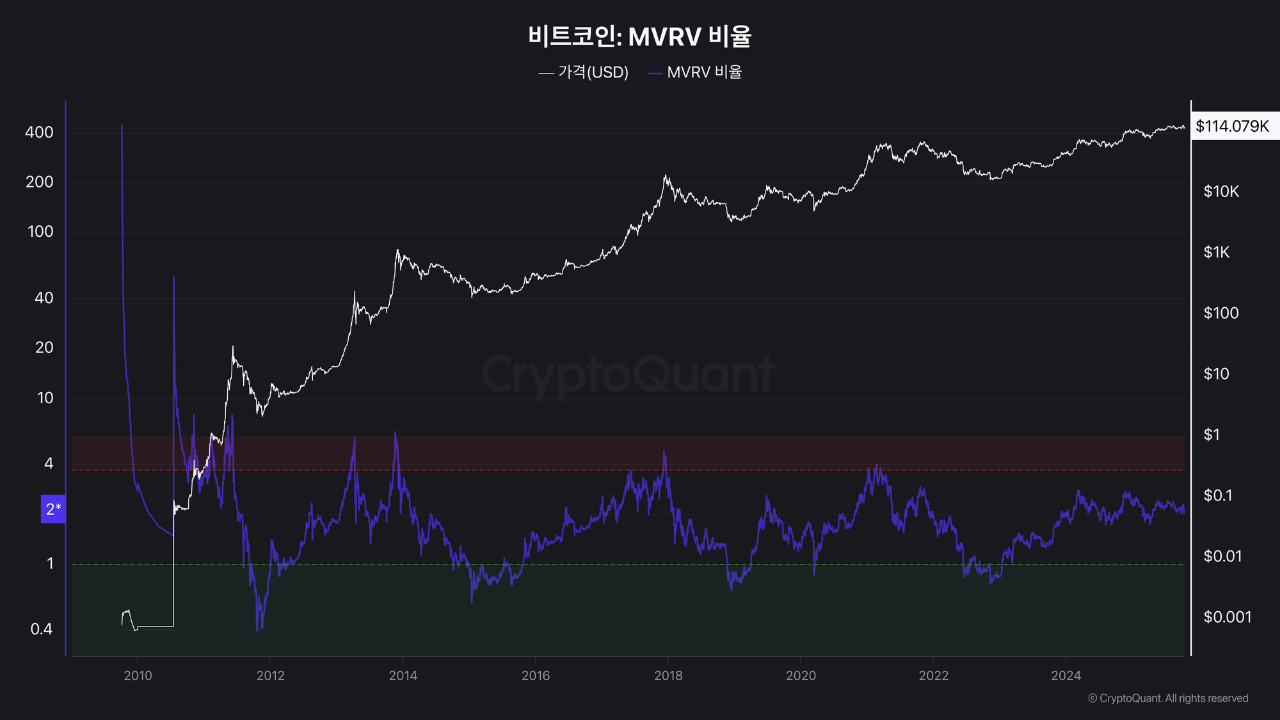
The latest MVRV ratio data suggests Bitcoin remains in a healthy mid-cycle expansion, not yet in the overheated distribution zone. The market continues to show characteristics of controlled accumulation, supported by institutional flows and long-term holder conviction.
⸻
🔹 Key Insight
• The MVRV ratio currently hovers near 2.0, well below the historical overvaluation threshold of 4.
• Historically, readings above 4.0 have coincided with cycle peaks (2013, 2017, 2021),
while levels below 1.0 marked major accumulation bottoms (2015, 2018, 2020).
• This mid-range zone implies that most participants are in profit, yet the market hasn’t entered euphoria.
⸻
🔹 On-Chain Implications
1. Long-Term Holders (LTHs) remain in conviction — low realized spending activity.
2. Exchange flows continue to reflect net outflows, suggesting accumulation rather than distribution.
3. Institutional ETF inflows and decreasing miner sell pressure align with mid-cycle behavior.
➡ These dynamics point to a structural consolidation before the next leg up,
not a macro top.
⸻
🔹 Historical Context
Each previous bull cycle showed three clear MVRV phases:
1️⃣ Recovery (<1 → 2) → 2️⃣ Expansion (2 → 4) → 3️⃣ Euphoria (>4).
Currently, Bitcoin sits around phase 2, echoing mid-2020’s structure before the final breakout.
⸻
🔹 Conclusion
Bitcoin’s MVRV ratio near 2.0 confirms that we are not yet in the late-stage euphoria phase.
The market remains fundamentally sound, supported by structural demand and on-chain strength.
Any pullback here should be interpreted as mid-cycle reaccumulation, not the beginning of a macro top.
⸻
Chart Source: CryptoQuant – MVRV Ratio Dashboard
Author: Chairman Lee (Professional Analyst)

View original →Bearish(Nuanced)BTC
7/25/2025
Summary:
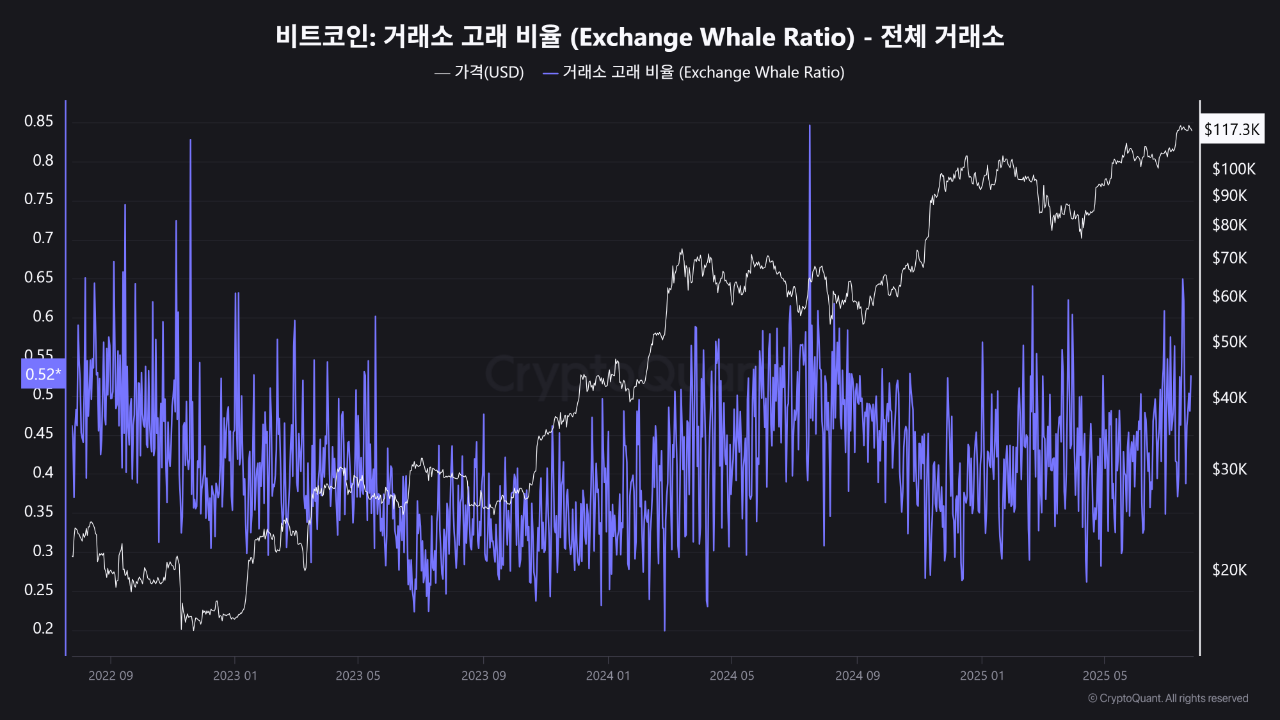
Bitcoin is trading near $117.3K, sitting just below a major volume node at $118K. On-chain whale activity is rising, with the Exchange Whale Ratio climbing toward 0.52 — a level that historically signals elevated selling pressure from large holders. Price stability above $116K–$118K will determine whether the market can avoid deeper profit-taking and resume its uptrend.
Body:
Two critical factors are shaping Bitcoin’s short-term outlook:
Volume Profile Concentration at $118K:
The visible range volume profile shows a heavy accumulation cluster between $117K and $118K.
Price is currently trading below this node, indicating this zone is acting as resistance after recent retracements from $120K+.
A sustained move above $118K could re-open the path toward $120.8K and $124K.
Exchange Whale Ratio at 0.52:
The ratio, measuring the share of top-10 whale inflows vs total inflows, has spiked to 0.52.
Historically, readings above 0.4–0.5 often precede short-term corrections as whales distribute or hedge positions.
This suggests that any failure to reclaim $118K quickly could trigger another wave of selling toward $114K–$112K.
Implications for Traders:
Bullish Case:
Holding $116K–$118K with declining Whale Ratio could confirm the zone as a springboard, setting up a move to $120K–$124K.
Bearish Risk:
Sustained Whale Ratio above 0.5 while price stays capped below $118K could lead to profit-taking waves, targeting $114K–$112K liquidity zones.
Conclusion:
The $118K node is the immediate battleground. With whale inflows rising, traders should closely monitor whether the ratio retreats below 0.4.
If it cools down, a bullish continuation toward $124K is plausible.
If it remains elevated, expect a shakeout phase before any new leg higher.

View original →Summary:
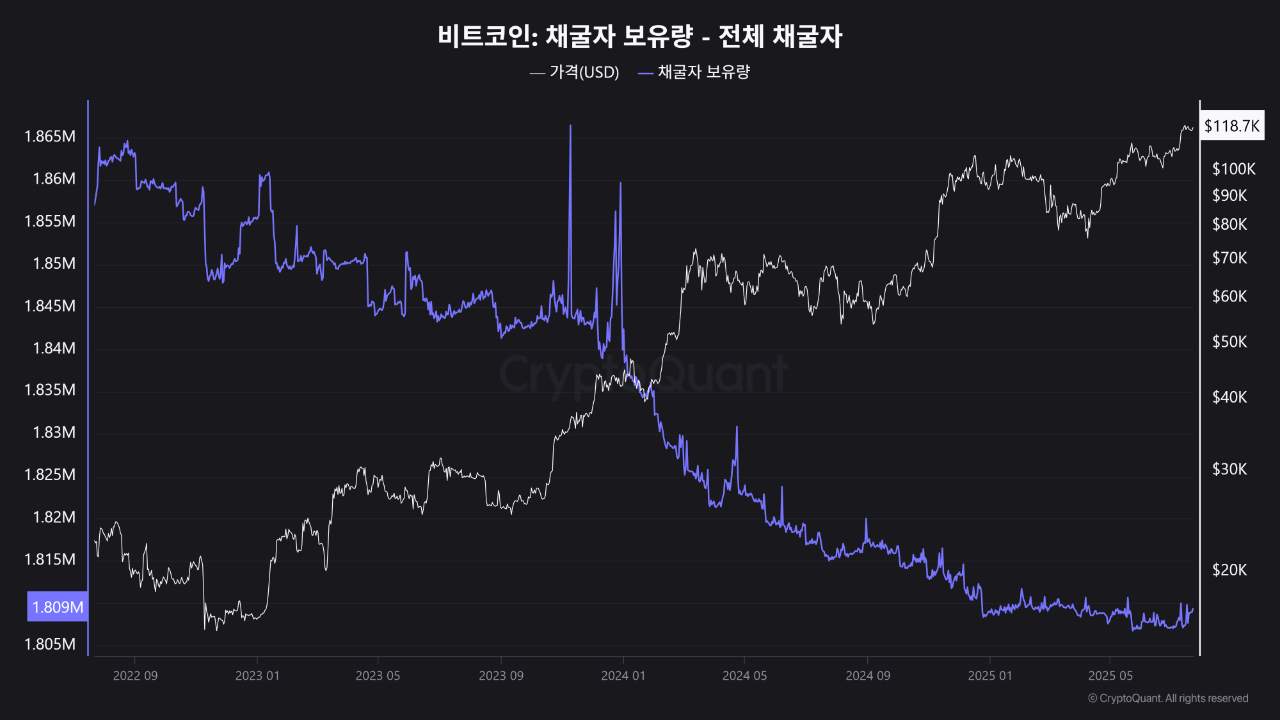
Bitcoin is trading near $118.7K while total miner holdings remain at historically low levels around 1.809M BTC. Despite the price rally, miners are not showing aggressive accumulation or distribution. This balance suggests muted sell pressure from miners, keeping the broader bullish structure intact.
Body:
The latest data shows total miner reserves hovering at ~1.809M BTC, the lowest band seen since early 2022. Historically, sharp increases in miner outflows have preceded local tops, while deep reductions in reserves tend to coincide with long-term accumulation phases.
Key observations:
No Significant Distribution: Miner holdings remain flat despite BTC approaching a new local high near $119K.
Supply Pressure Stable: Unlike past rallies where miners offloaded heavily, current outflows are modest.
Price-Reserve Divergence: Since mid-2024, BTC price has surged from ~$60K to nearly $119K, while miner reserves stayed subdued – indicating that supply pressure is not driving this rally.
Implications:
Bullish Medium-Term Structure: Stable reserves imply miners are not aggressively selling, allowing institutional flows and spot ETF demand to dominate price action.
Short-Term Watchpoint: If miner reserves spike upward toward 1.82M–1.83M BTC, it could signal upcoming profit-taking and weigh on BTC’s ability to hold $116K–$118K support.
Conclusion:
As long as miner reserves remain near current lows and do not trend upward, BTC’s medium-term uptrend remains supported. The key level to monitor is $116K support – holding this zone while miners stay inactive could trigger another leg toward $124K–$130K.

View original →Bullish(Nuanced)BTC
7/22/2025 Summary:
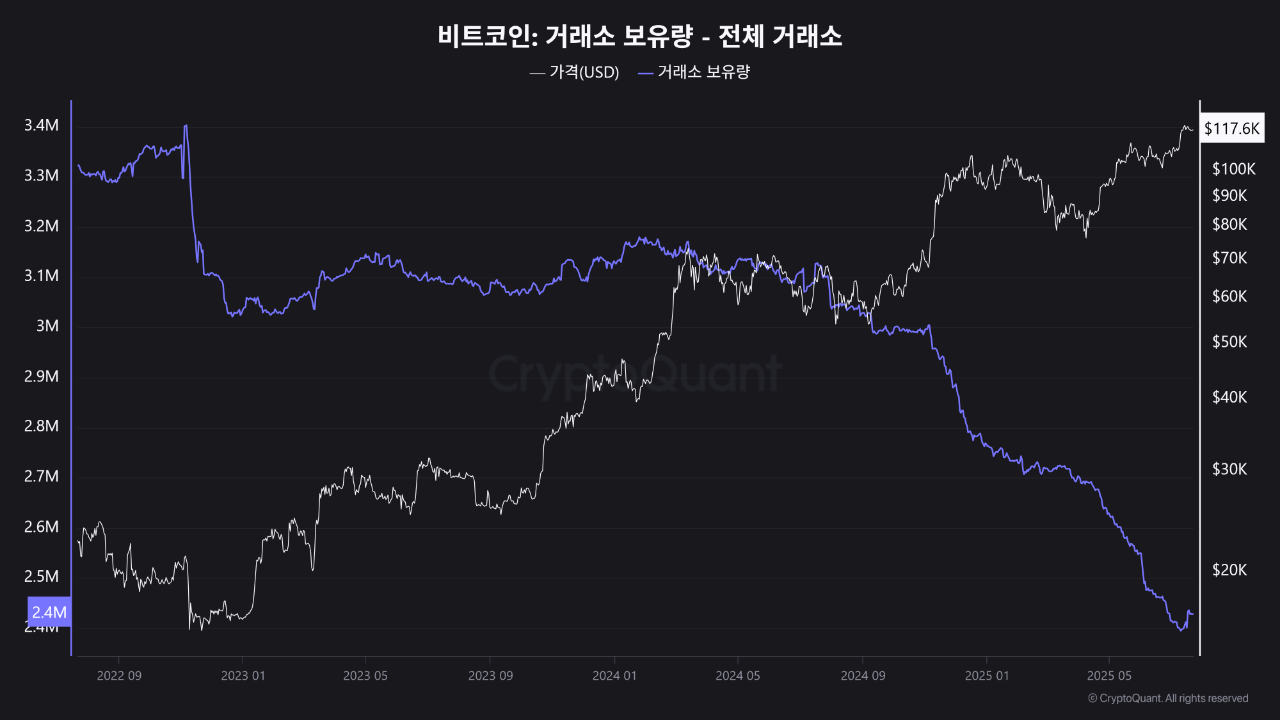
Bitcoin is consolidating near $119K after setting a new ATH above $123K last week. Exchange reserves have climbed to their highest level since late June, signaling short-term selling pressure, but whale and institutional flows still lean bullish. Price action around $116K–$116.4K will determine whether this is a healthy pullback or a deeper correction.
Body:
Bitcoin (BTC) has pulled back to the $119K zone, following a record high of $123K. On-chain data shows a mixed short-term outlook:
Exchange Reserves surged to the highest level since June 25, suggesting potential profit-taking by traders.
Whale & Miner Activity: Large holders and miners have been increasing deposits since July 18, but total inflows remain historically low compared to major tops earlier this year.
UTXO Count continues to drop, indicating that long-term players are accumulating and preparing for a potential next leg up.
ETF & Institutional Flows remain steady, with year-to-date inflows near $50B despite recent profit-taking pauses.
From a technical perspective, the $116.4K area is the immediate support zone. A breakdown below this level could extend the correction toward $112K–$110K. On the upside, holding above $116K keeps the structure intact for another push toward $124K–$130K.
Conclusion:
While exchange reserve growth signals short-term caution, institutional demand and declining UTXO counts point to a broader bullish structure. Traders should monitor $116K closely:
Holding above = potential rally to $124K–$130K
Breaking below = risk of deeper retracement to $110K
The broader trend remains intact as long as $110K holds, with $180K+ still a valid year-end target if ETF and institutional flows accelerate.

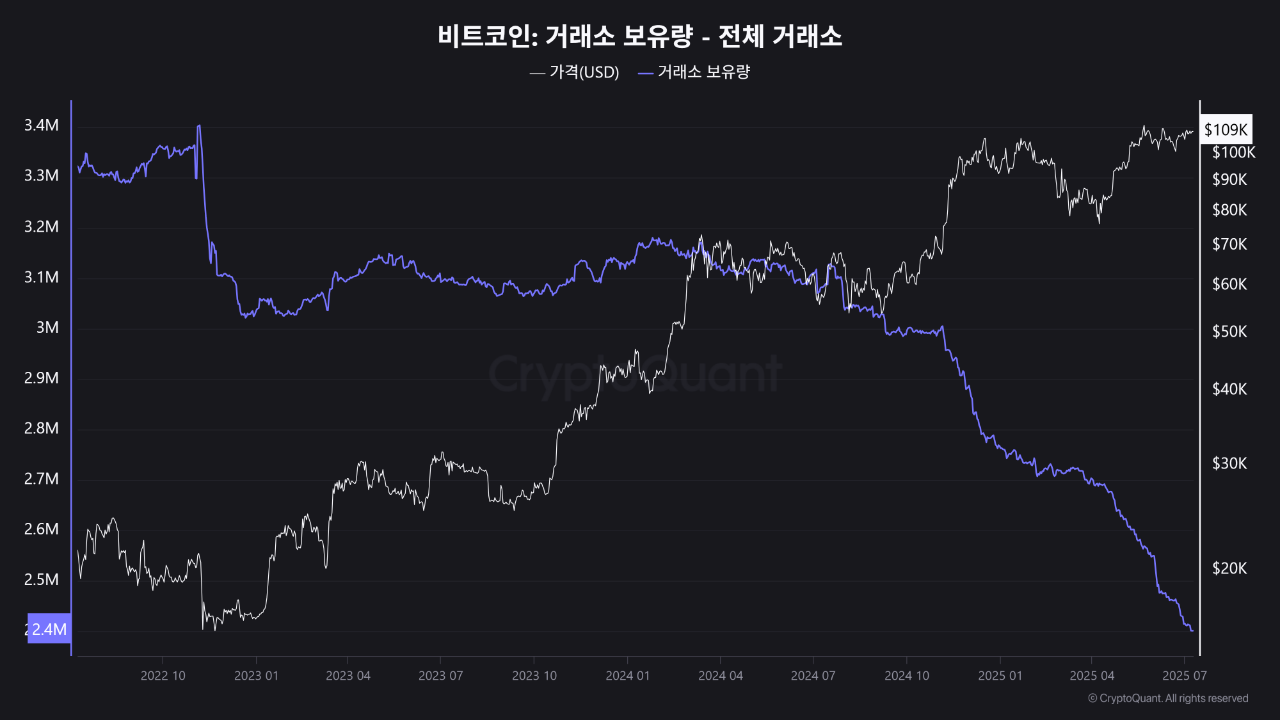
View original →Bitcoin exchange reserves have dropped to a new multi-year low of 2.4M BTC, down from over 3.1M in mid-2023.
This persistent decline in reserve levels suggests that sell-side liquidity is drying up. Historically, such conditions — where BTC held on exchanges is low — precede major bullish expansions as demand exceeds supply.
As BTC trades near $109K, this supply-side squeeze could act as a fundamental tailwind for continuation, especially if demand from ETFs and institutions persists.
The trend mirrors the 2020–2021 bull cycle, when declining reserves foreshadowed explosive price movements.

View original →

