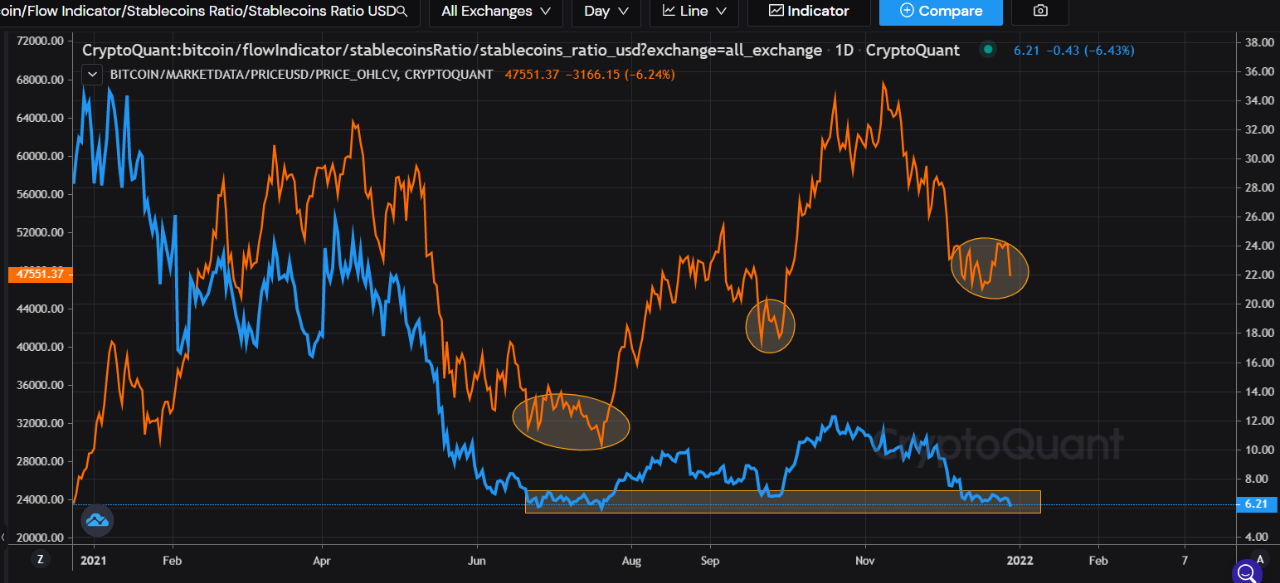
On this chart you see the Stablecoin Supply Ratio (SSR) in blue, with the Bitcoin price in orange.
The SSR is measured by dividing BTC's Market Cap by all Stablecoins Market Cap.
The SSR is very low right now, and right at the zone where it bottomed out before, correlated to a downfalling and outbottoming BTC price, for the 3d time within a year.
When the SSR is low, it suggests chances of high buying pressure is high.
Because imagine, there is a lot of sidelined stablecoined money, with a BTC price which is down ~35% from the top.
Bitcoin reversed from this zone the last 2 times. Will it do the same this time?


View original →Stablecoins have grown very popular during the last years.
Back in 2017, there was in fact only Tether.
Now there is a variety of Stablecoins to choose from. In the Top 15 biggest cryptocurrencies there are 3 stables right now: USDT, USDC and BUSD.
Owning stablecoins next to your volatile Bitcoin or Alts has become normal.
When the Stable Coin Supply Ratio is low, it suggests a high potential buying pressure on exchanges.
It means that the amount of Stablecoins, compared to the market cap of BTC is high, which explains the possible buying pressure.
Question is, is this time different?

View original →Bullish(Nuanced)BTC
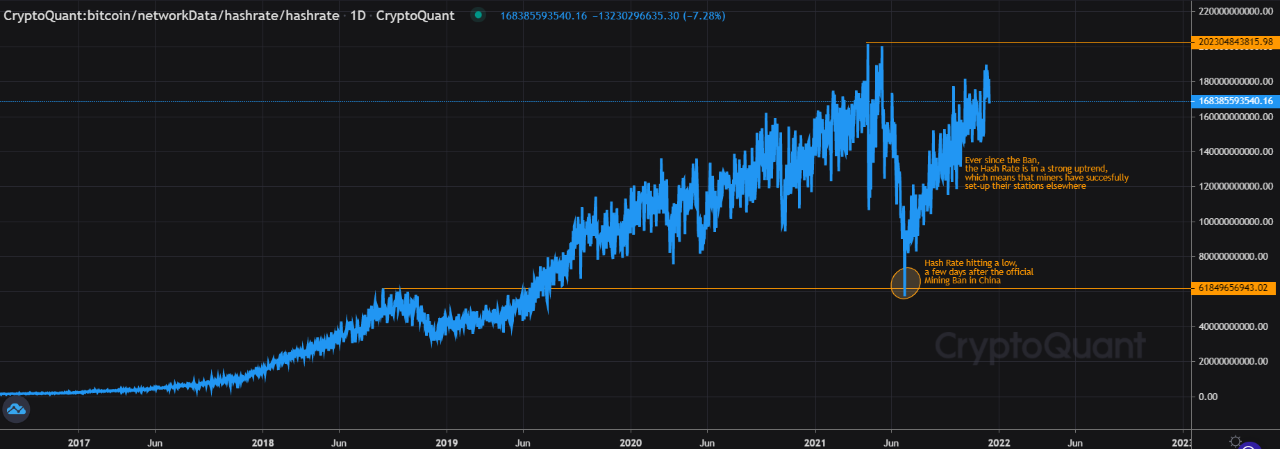
12/13/2021 Bitcoin Mining has almost fully recovered, after the Mining Ban in China, half a year ago.
A V-shape recovery has been made, and the Hash Rate is close to new All Time Highs, which is a very strong sign for the Bitcoin Network

View original →

