


Bullish(Nuanced)
BTC
5/18/2026Mega-whales holding 10K+ BTC hit highest levels since last year. The 10-100 BTC tier quietly stacking despite CPI/PPI anxiety. Whales betting market bottomed—but no frenzy yet.
View original →Sentiment timeline shows relative sentiment within this analyst's history. A perma-bull showing 8 bullish : 2 bearish in a bear market sets that as their baseline. If you notice any errors, claim @joohyun_ryu to submit corrections.
Mega-whales holding 10K+ BTC hit highest levels since last year. The 10-100 BTC tier quietly stacking despite CPI/PPI anxiety. Whales betting market bottomed—but no frenzy yet.
View original →Bitcoin smashes through 100-day MA as STH-MVRV reclaims 1.0—short-term holder psychology flipping bullish. ETF outflows blamed on AI/chip FOMO, but analyst expects liquidity rotation back to BTC...
View original →MVRV, Puell Multiple Z-Score, and Supply in Profit all bouncing off local bottoms—classic trend reversal signal. On-chain data screaming the shakeout is over; fifth bull cycle's final pit stop...
View original →The influence of Short-Term Holders (STH) in #Bitcoin is growing! 📈 Their dominance in the #RealizedCap is steadily on the rise. But here's the key insight: it's still significantly lower than the peaks of previous bull markets. 🤔 This could mean the main event hasn't even started yet. Still early days? 🚀 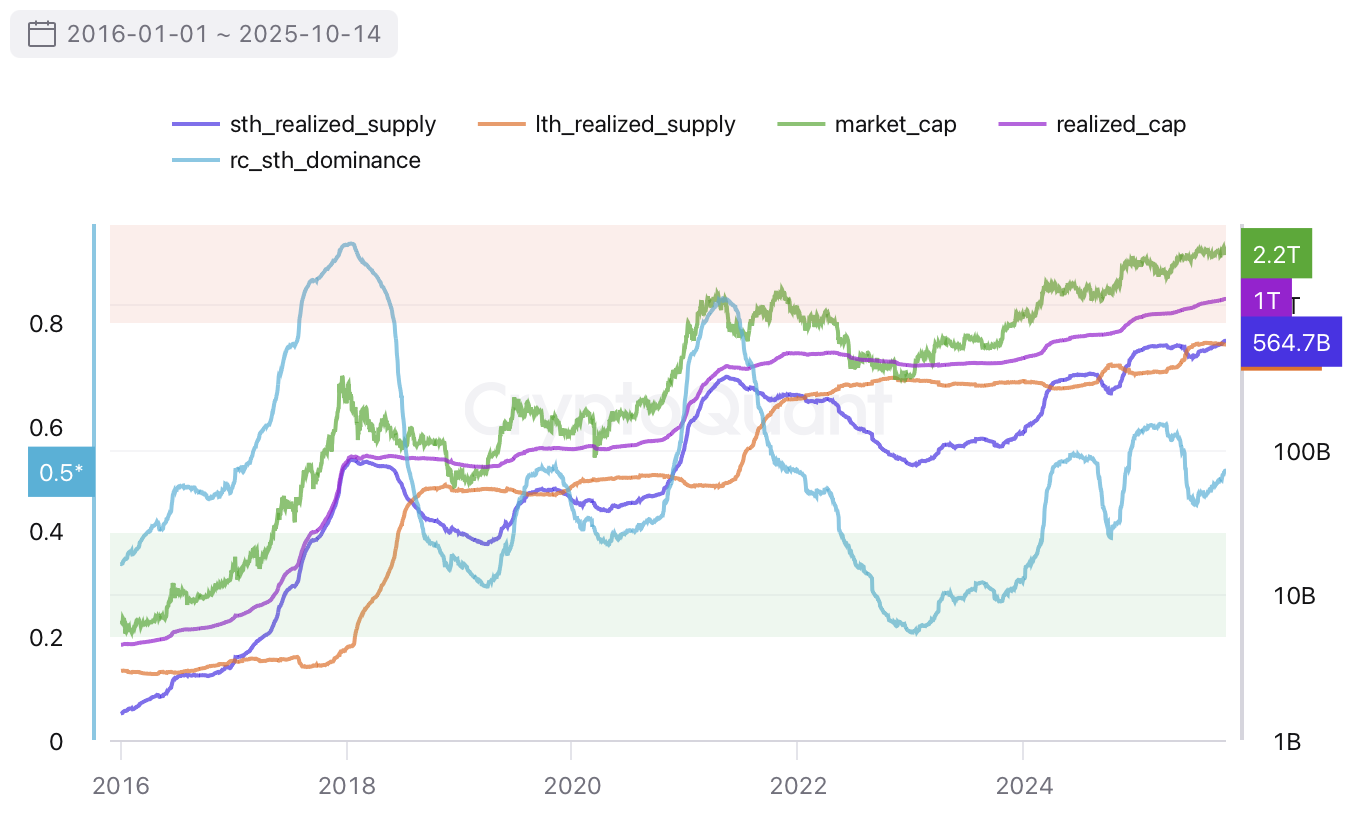 
View original →The Greed Index suggests the market is warming up, but it feels more like a slow simmer than a rolling boil, especially considering we're updating an all-time high. To put it in perspective, the index peaked at 16 during the last major bull run, but right now, it's sitting at a modest 11. What's interesting is the recent uptick in activity from Short-Term Holders (STHs), which seems to be fueling this gradual upward momentum. So, while the market is heating up, it's doing so at a very measured pace. It feels like it's taking the stairs, not the elevator, this time around. 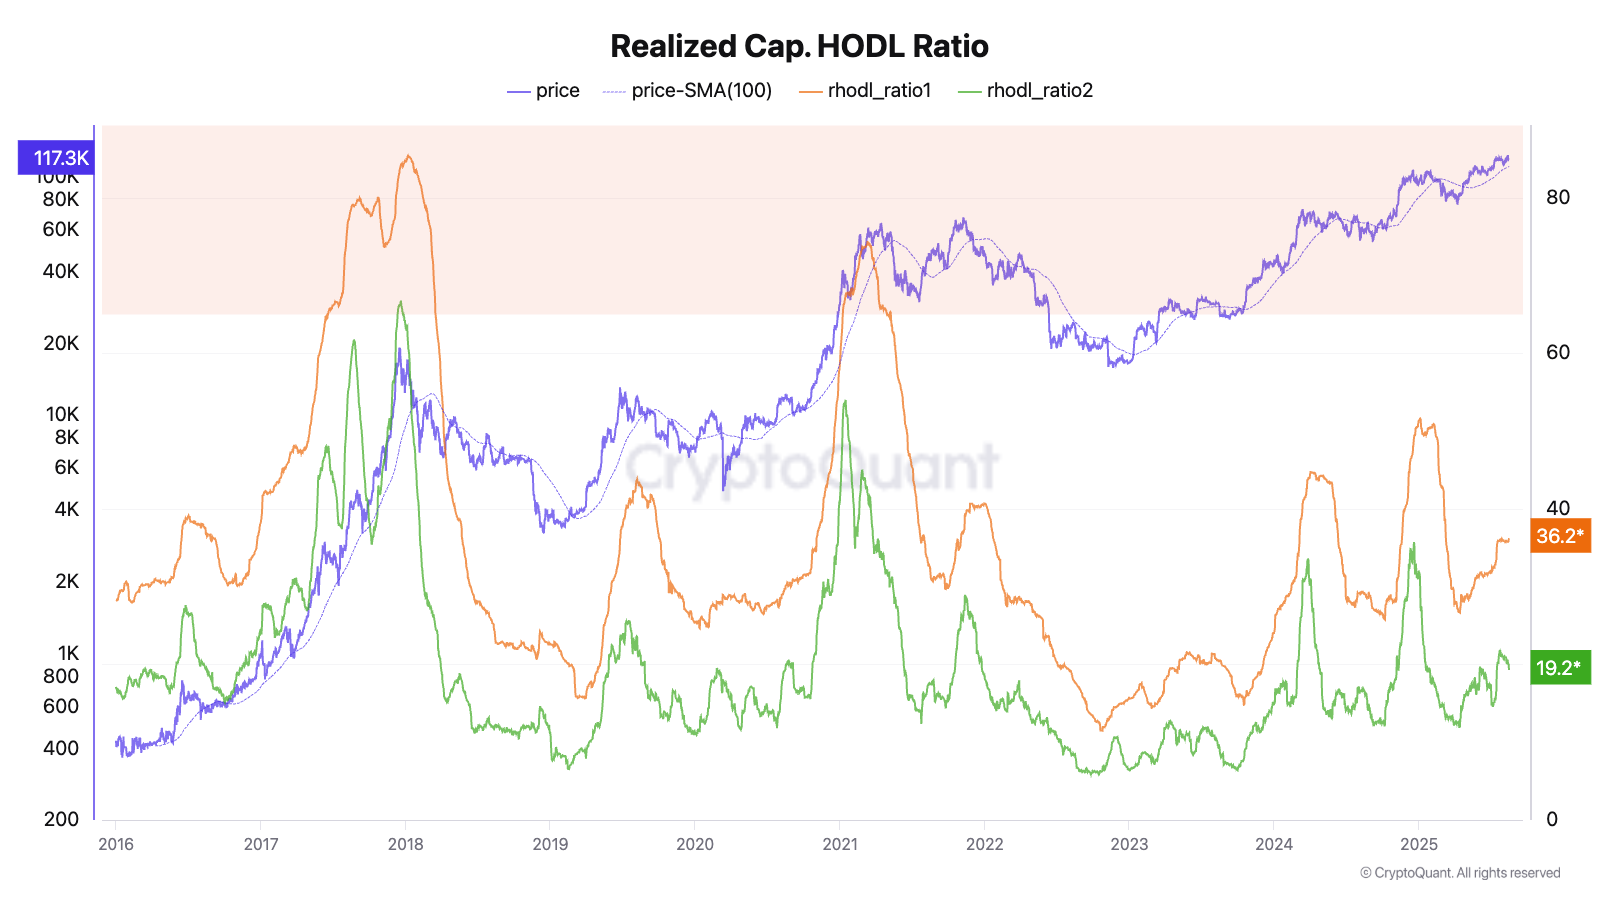 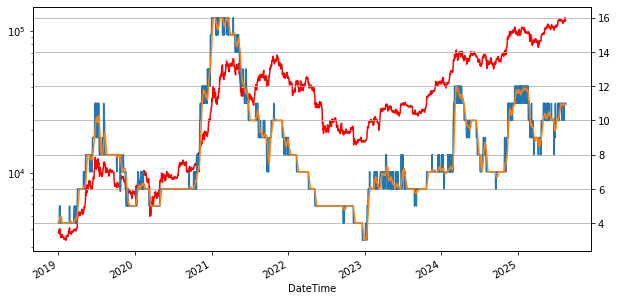 
View original →Recent market activity has presented compelling signals, including a breach of All-Time Highs (ATH) during the past week and a notable inflow of capital into spot Exchange-Traded Funds (ETFs). These developments could be interpreted as preliminary indicators of an impending market euphoria phase. However, a closer examination of underlying market sentiment, particularly through on-chain indicators, suggests a more nuanced picture. Despite the recent price surge, our proprietary "Greed Indicator" remains at a mid-level. This observation implies that numerous on-chain metrics, which typically reflect broader market participation and speculative fervor, have yet to demonstrate significant upward movement. A representative example is the rHODL ratio, currently positioned at a modest 32%. This metric, traditionally indicative of long-term holder behavior and the distribution of wealth across different investor cohorts, suggests a continued reluctance among retail participants (often referred to as "prawns" in market vernacular) to fully engage with the market. Historically, periods of true market euphoria have been characterized by substantial inflows from retail investors, a dynamic not yet prominently observed. Therefore, from this perspective, the onset of a full-fledged euphoria phase may not have commenced. The recent price appreciation appears predominantly driven by the concentrated influence of institutional investors, rather than broad-based retail participation. It is noteworthy that preceding market euphorias have consistently followed a period of mass retail ingress. Nevertheless, a recent and highly noticeable surge in rHODL ratio is beginning to emerge, potentially signaling the commencement of what is colloquially termed 'the last dance.' 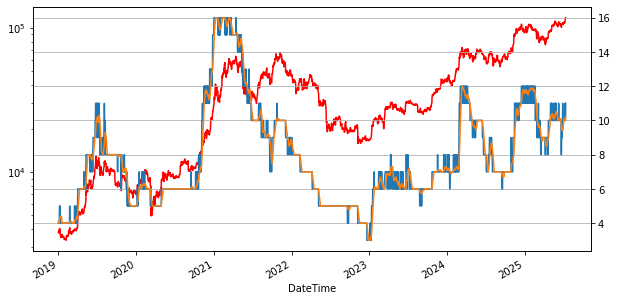 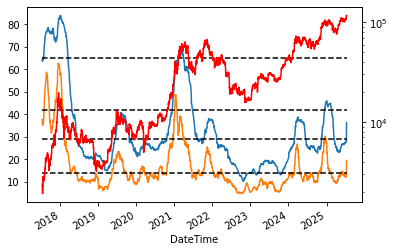 
View original →Recent market activity has presented compelling signals, including a breach of All-Time Highs (ATH) during the past week and a notable inflow of capital into spot Exchange-Traded Funds (ETFs). These developments could be interpreted as preliminary indicators of an impending market euphoria phase. However, a closer examination of underlying market sentiment, particularly through on-chain indicators, suggests a more nuanced picture. Despite the recent price surge, our proprietary "Greed Indicator" remains at a mid-level. This observation implies that numerous on-chain metrics, which typically reflect broader market participation and speculative fervor, have yet to demonstrate significant upward movement. A representative example is the rHODL ratio, currently positioned at a modest 32%. This metric, traditionally indicative of long-term holder behavior and the distribution of wealth across different investor cohorts, suggests a continued reluctance among retail participants (often referred to as "prawns" in market vernacular) to fully engage with the market. Historically, periods of true market euphoria have been characterized by substantial inflows from retail investors, a dynamic not yet prominently observed. Therefore, from this perspective, the onset of a full-fledged euphoria phase may not have commenced. The recent price appreciation appears predominantly driven by the concentrated influence of institutional investors, rather than broad-based retail participation. It is noteworthy that preceding market euphorias have consistently followed a period of mass retail ingress. Nevertheless, a recent and highly noticeable surge in rHODL ratio is beginning to emerge, potentially signaling the commencement of what is colloquially termed 'the last dance.'   
View original →My indexes are indicating this correction is not lower than the last one. Even though it is likely to get lower below current price, I think it stands at this level. The whales keep buying recently. And the global liquidity starts recovering. 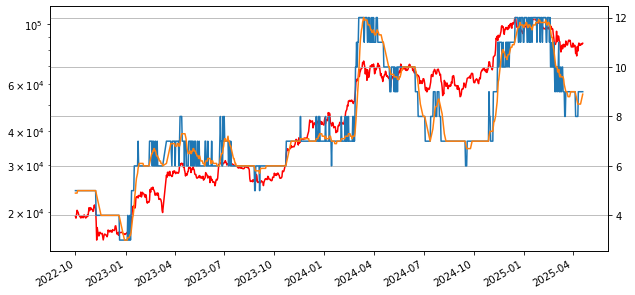 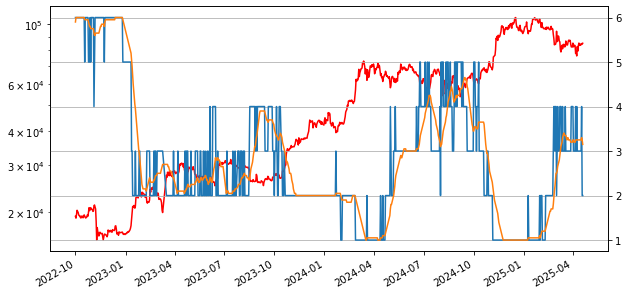 
View original →My indexes are indicating this correction is not lower than the last one. Even though it is likely to get lower below current price, I think it stands at this level. The whales keep buying recently. And the global liquidity starts recovering.   
View original →My Greedy Index indicates that we've been still staying in the bull market, even during the recent correction. At the top of the bull, It used to reach at the maximum, 16. But, It remains at just 12. So, the market has still significant upside potential. It is also supported by many on-chain indexes remaining at a similar level without a large volatility. And we may have a strong support line around $93,000~95,000. So, I guess the correction would end until this weekend. 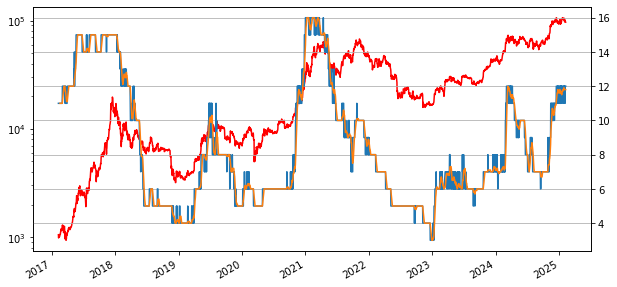 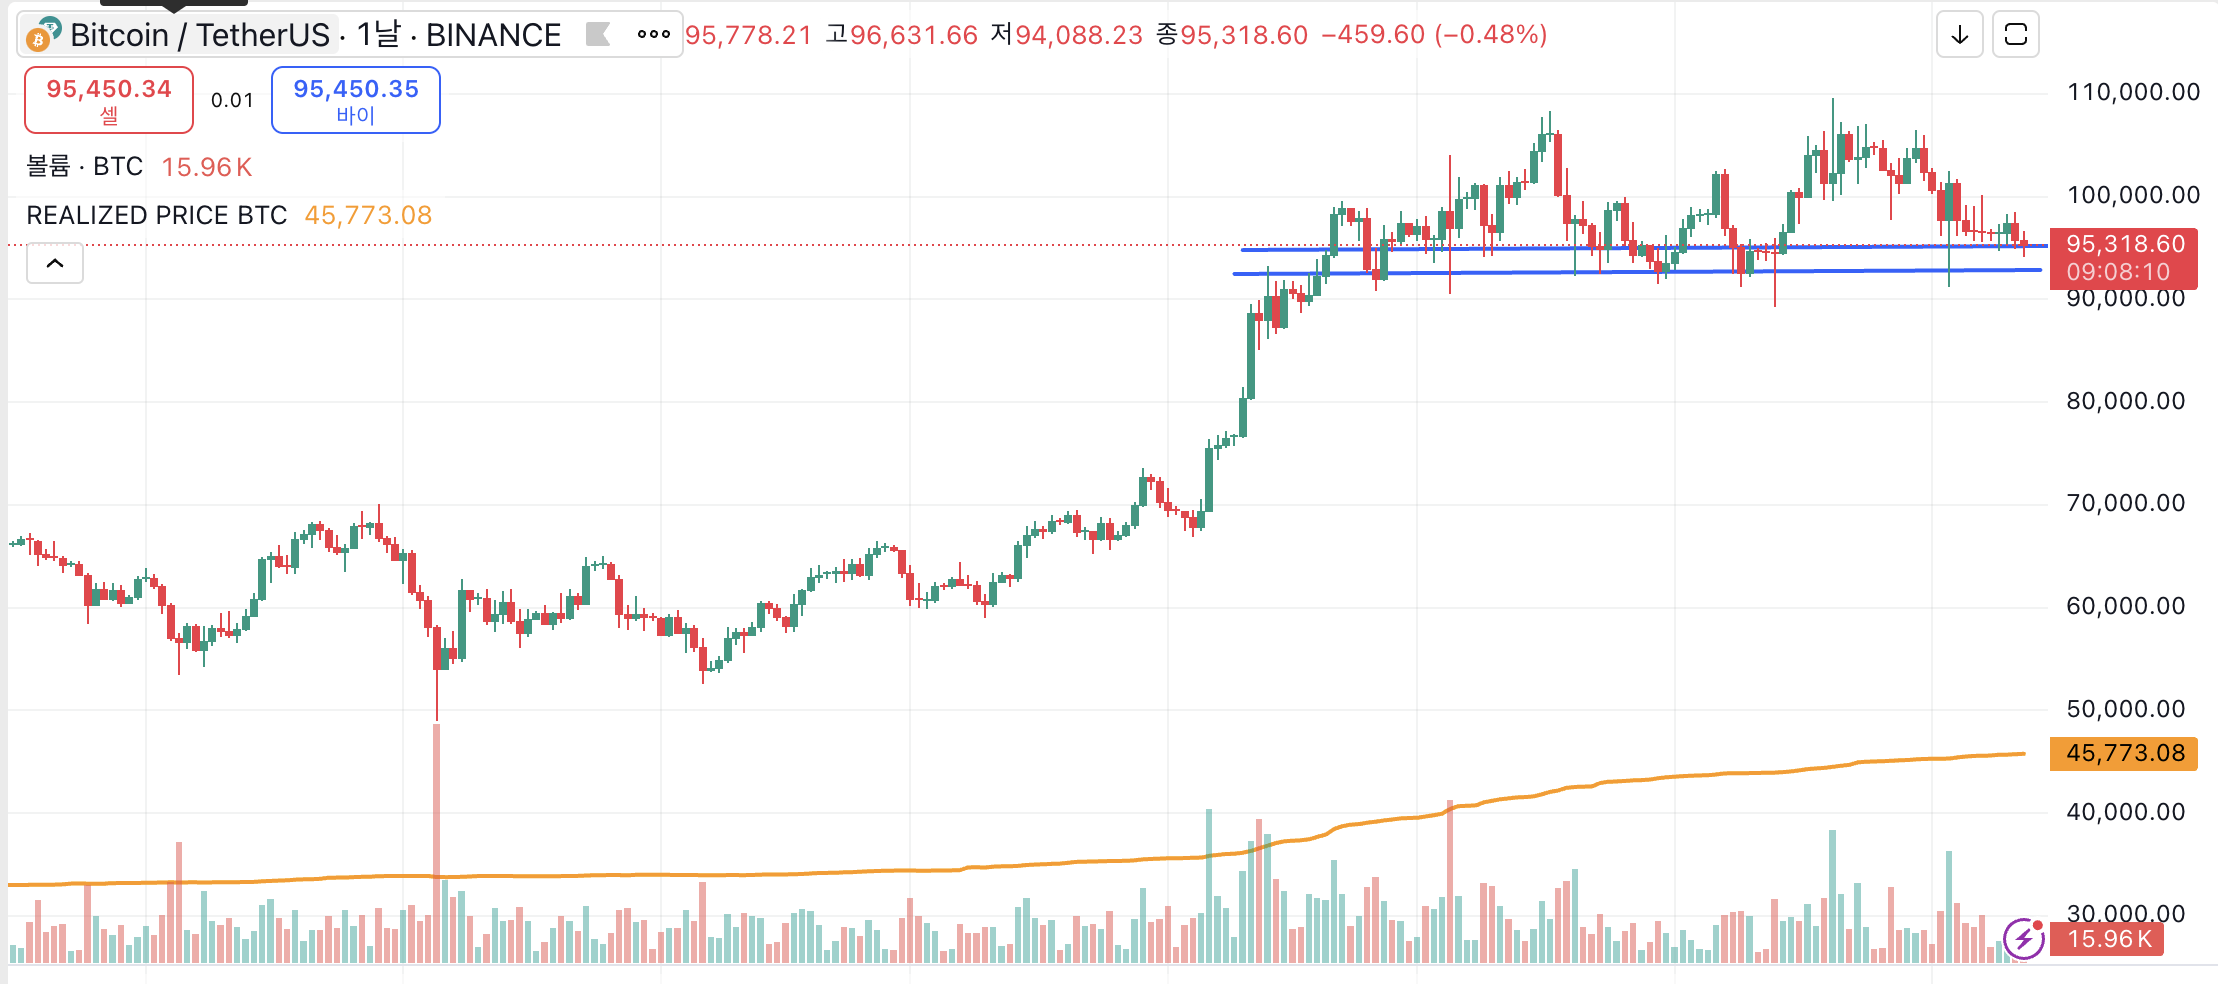 
View original →