


Cite asCryptoQuant has tracked 134 directional calls by @BaroVirtual on CryptoQuant since Jun 2021: tracked, not yet ranked (below the accuracy-scoring baseline) (as of Nov 11, 2026).
The NUPL indicates that Bitcoin is in its final run stages, with a target range of $130K-$160K.
As you can see from the chart, the net unrealized profit/loss index is forming a cup-and-handle technical pattern, which is expected to push Bitcoin into the target range of 130,000-160,000. In addition, in November 2024, Bitcoin successfully broke through the NUPL index's 365-day MA, which is also an optimistic signal in the medium and long term. 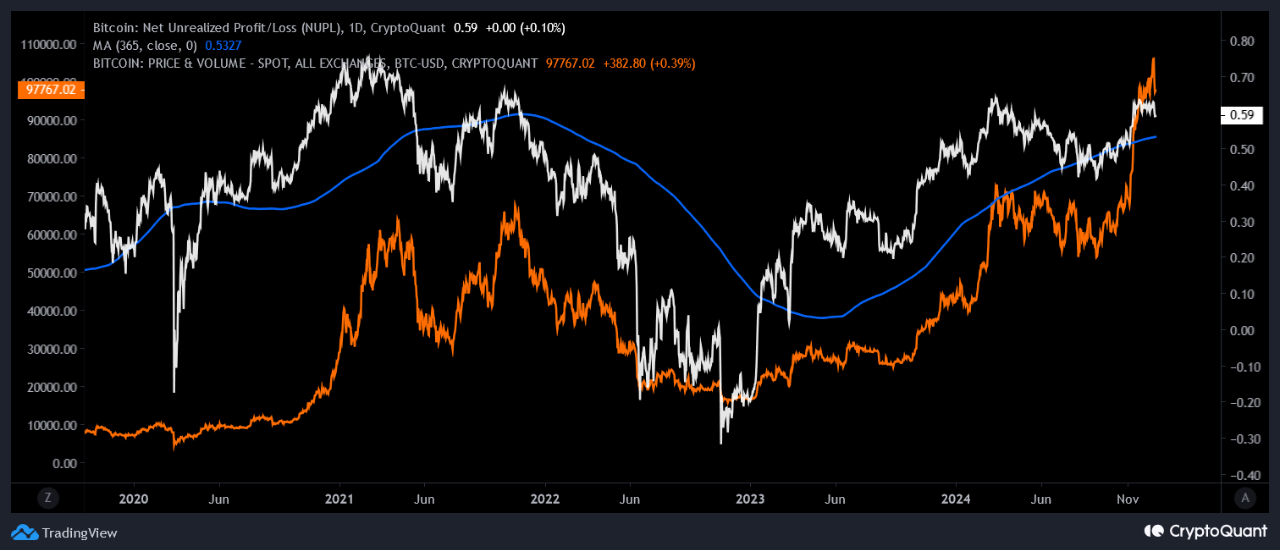 
View original →There is a clear correlation between Bitcoin price action and stablecoin market cap.
Once again, there is no denying the strong correlation between Bitcoin price action and the stablecoin market cap. As you can see from the chart, every time the 60d market cap change values peak, Bitcoin also peaks locally or globally. In this case, the encouraging factor is that the 60d market cap change has not fallen below its 60-d change-SMA, which indicates that the current correction is a knockout of weak hands from the market and a logical cooling before the further run.  
View original →Is sell-side liquidity a threat to Bitcoin?
At first glance, the sell-side liquidity, in real terms, suggests that Bitcoin has reached its peak. Is this really so? I believe Bitcoin will get its first peak in March-April 2025 in the target range of 130,000-160,000, and the total capitalization of the crypto market will be about 5-5.5 trillion $. Sell-side liquidity inventory in real terms indicates that we are already close to the top, but its 30-day change supports the thesis that we still have room for growth by the spring of 2025.  
View original →Bitcoin is probably in the middle of a bull run.
The steady decline in Bitcoin reserves across all crypto exchanges indicates that we are likely in the middle of a sustained bull run. Some market participants who have not properly accumulated Bitcoin earlier are likely doing so now, realizing that this is likely the last downward correction before another upward price surge. The current situation is roughly reminiscent of the period from March to November 2020, when exchange reserves declined. Then, in December 2020, when inflows to exchanges began to increase, Bitcoin experienced upward buying pressure, leading to a new price high in a short time.  
View original →Price chasers indicate the uptrend is powerful, but there may be short-term issues.
The position of the price chasers (7d and 30d MAs) indicates that we are seeing intense, healthy buying pressure on Bitcoin, which is a very positive signal. The issue is that the gap between the fast and slow chasers is 19%, and this, in turn, leads to 2 possible scenarios: 1) Bitcoin takes a sideways position in the $87,000-$93,000 range for some time and then continues its upward movement to the $104,000-$120,000 range. We observed something similar from February to March 2024. 2) Bitcoin corrects downwards to the $71,000-$77,000 range, and there is an intermediate healthy cooling of the market, and then the local upward trend resumes. We observed something similar in this case: - February 21, 2021 - January 8, 2021 - August 1, 2020 - May 7, 2020 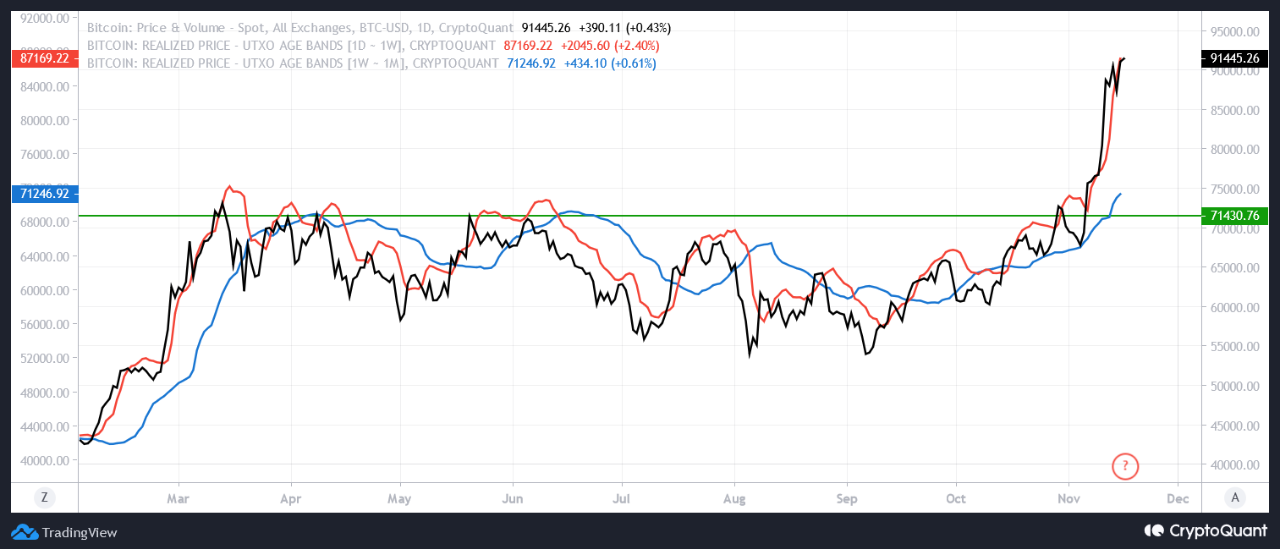 
View original →