


Neutral
BTC
5/28/2026Nearly every Bitcoin cohort from the past 18 months is underwater. $73K marks the line between compression and capitulation. Reclaiming $79K flips the script bullish.
View original →Sentiment timeline shows relative sentiment within this analyst's history. A perma-bull showing 8 bullish : 2 bearish in a bear market sets that as their baseline. If you notice any errors, claim @tugbachain to submit corrections.
Nearly every Bitcoin cohort from the past 18 months is underwater. $73K marks the line between compression and capitulation. Reclaiming $79K flips the script bullish.
View original →NUPL hits Hope zone at 0.28 for first time this cycle, down 40% from $109K peak. STH-SOPR recovering from 0.92 capitulation level back toward breakeven. Classic accumulation setup forming—but true...
View original →Miner outflows crashed 76% from 28K to 6.8K BTC—sellers have gone silent. MVRV at 1.3 signals zero speculative premium, market trading at cost basis. ETF flows and nation-state adoption may have...
View original →Short-term Bitcoin holders now underwater as price drops below their cost basis. Relief rallies getting capped at break-even levels where panic sellers cluster. Long-term holder support intact—this...
View original →NVT Golden Cross hits -1.9, deep in the 'cold zone' below -1.6 threshold. Bitcoin price is suppressed vs on-chain activity—local bottom zone forming. But historical crashes reached -3 before...
View original →ETH holders refuse to sell the dip, with persistent exchange outflows during pullbacks signaling quiet accumulation. Sell-side liquidity is drying up as profit-taking stays muted even on...
View original →Bitcoin's profit ratio sits at 83-84%, signaling fragile momentum rather than full capitulation. $95K marks the critical threshold where short-term holders break even. Break above restores 90%...
View original →The reaction from the ~87K Realized Price Growth ×2 level is highly significant. If the upward move from this zone can break through both the prior high-volume region and the critical on-chain resistance represented by the 6m–12m Realized Price UTXO band around 95K, the probability of transitioning into a mini sideways accumulation phase increases meaningfully. The 111DMA (~111,500) stands out as a strong structural pivot, while 95K serves as a volume-backed lower boundary for this potential accumulation structure. If price compresses within the 95K–111.5K range, expecting a strong breakout afterward would be reasonable. However, given broader macro conditions and fundamental factors, the possibility of a dead cat bounce should not be discounted. If Bitcoin fails to sustain acceptance above these critical levels, the dead cat bounce scenario remains firmly on the table. 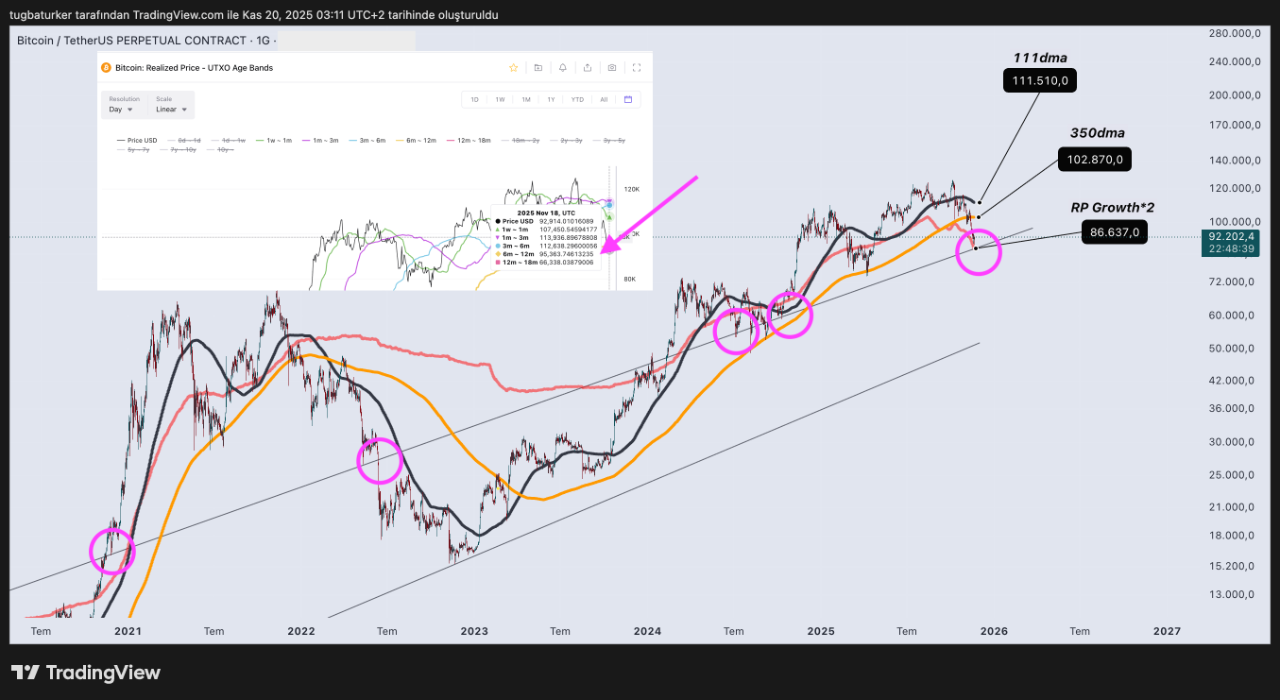 
View original →Estimated Leverage Ratio (ELR) measures the ratio of open interest to exchange reserves. In simple terms, it shows how much leverage traders are using in the market. The higher the ratio climbs, the greater the risk that even small price moves can trigger large-scale liquidations. Looking at the chart, ELR has been trending steadily higher since the summer. Back in May it was around 0.21, and now it has climbed above 0.26. Compared to previous months, this clearly shows much heavier use of leverage and a stronger risk appetite across the market. When read alongside price action, periods of rising ELR have coincided with sharper volatility and stronger swings in BTC. The current setup suggests that the market is heading into October with elevated leverage. That could accelerate upside breakouts, but it also raises the risk of sudden and painful liquidation cascades if the market turns lower. 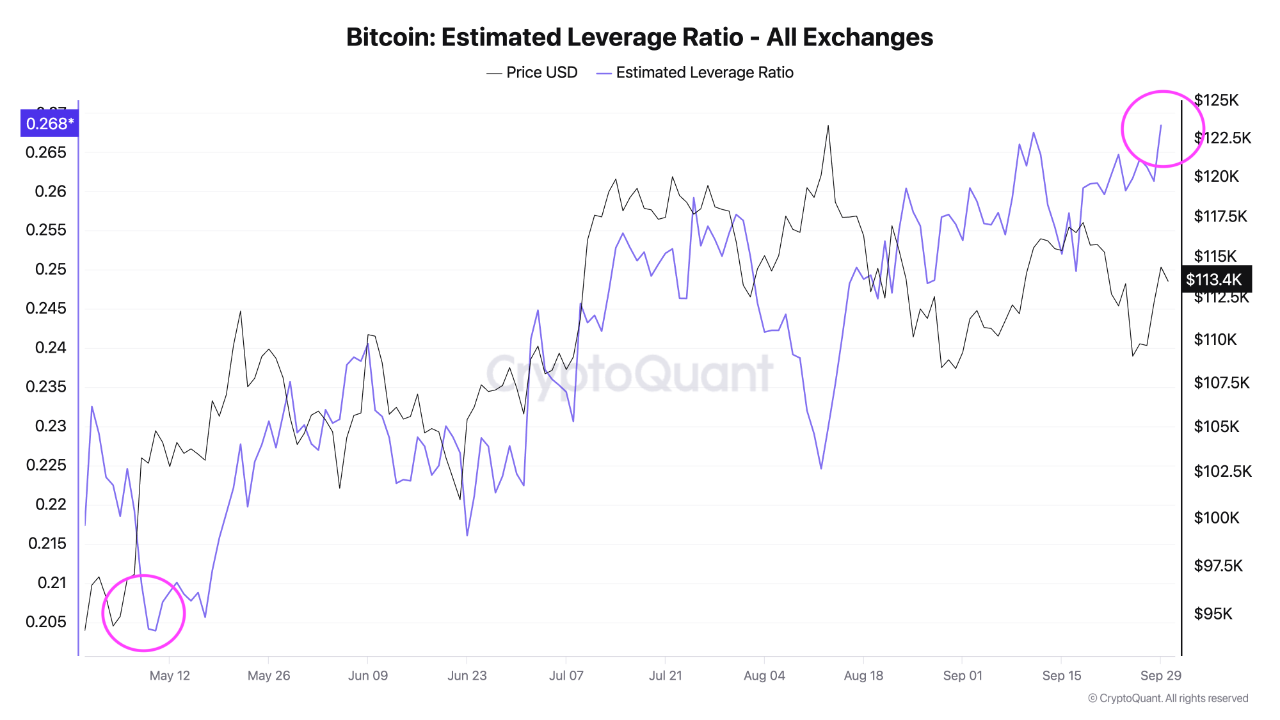 
View original →This chart shows the total BTC reserves across both spot and derivatives exchanges. The continuous decline signals that the amount of sell-side liquidity on exchanges is shrinking. Back in the 2020–2021 cycle reserves were high, but now they’ve dropped to around 2.5M BTC, marking one of the lowest levels in recent years. On-chain this tells us a clear story: coins are being pulled off exchanges into cold wallets, strengthening the illiquid supply side. Historically, declining reserves have had a negative correlation with price — meaning as reserves fall, the probability of upward price moves increases. Heading into October, the picture is straightforward: supply-side selling pressure is weak, the reserve contraction is bullish. The only caveat is that the Estimated Leverage Ratio remains elevated, which could fuel short-term volatility. Structurally, we’re facing a bullish supply shock scenario, but with the risk that excessive leverage may trigger sharp corrections along the way. 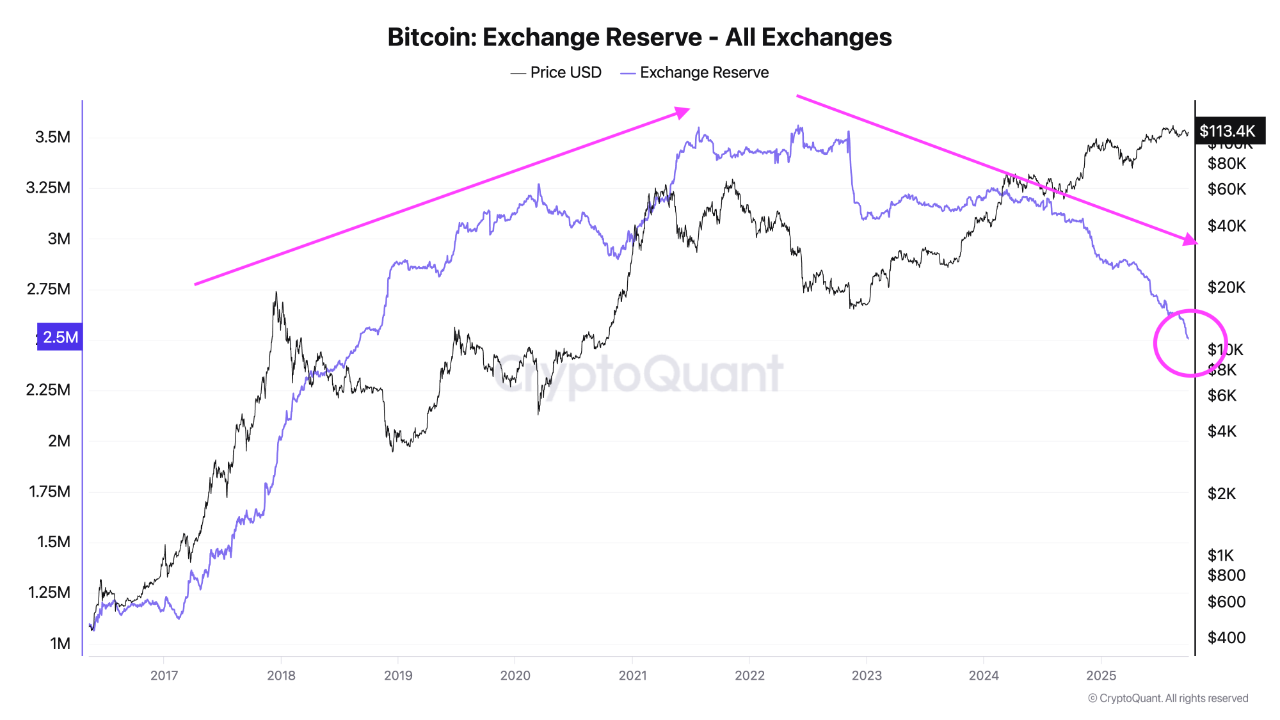 
View original →