


Cite asCryptoQuant has tracked 77 directional calls by @signalquant on CryptoQuant since Jul 2021: tracked, not yet ranked (below the accuracy-scoring baseline) (as of Nov 11, 2026).
Long positions are accumulating behind the market
The thick purple line represents the price of Bitcoin, while the thin blue line represents the taker buy and sell CVD. The “taker buy and sell CVD” shows the trend in the difference in trading volume between long and short positions. The green area is when longs exceeds shorts and the red area is when shorts exceeds longs. Although the current price is showing a downward and sideways trend, traders are seemed to prefer long positions over short positions. This is because every time this indicator hit bottom and rose in the past, the price showed a pattern of rising, whether large or small. Let's see if the Bitcoin price can overcome the US employment shock and rebound! 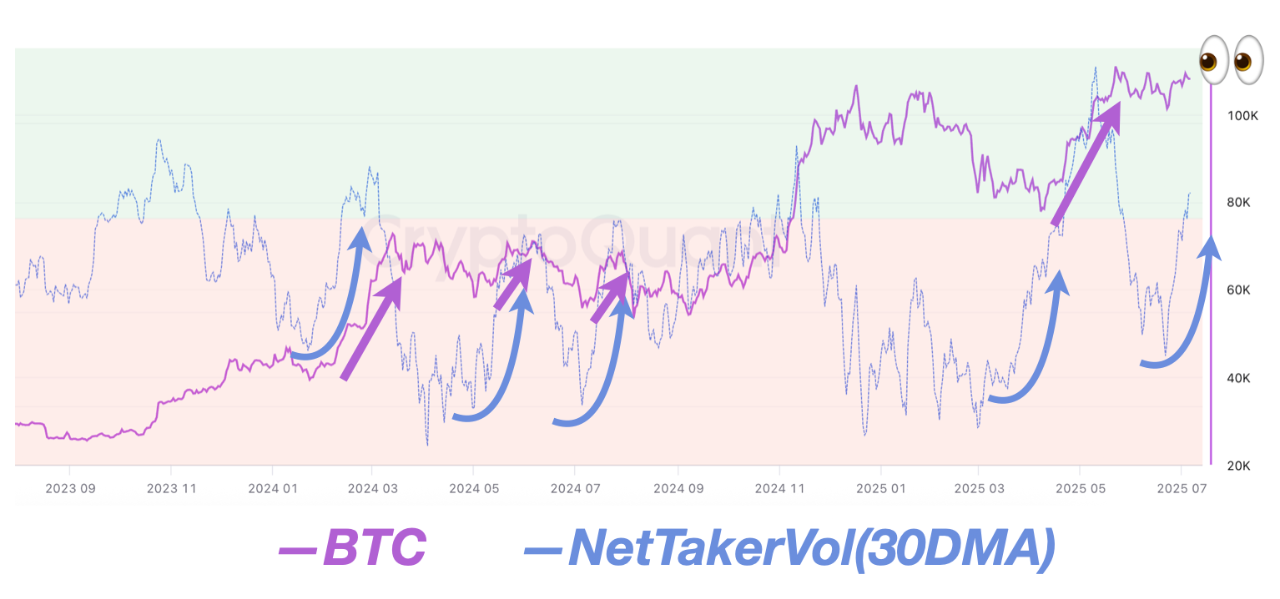 
View original →Stablecoins Inflow is growing!
The trend of stablecoin netflow on exchanges shows a strong correlation with BTC price. Over the past week, there has been a tendency for stablecoins to flow into exchanges. This may be due to the expectations surrounding Trump's inauguration, and if this trend continues, there is a high possibility that BTC prices will surpass their previous all-time highs. 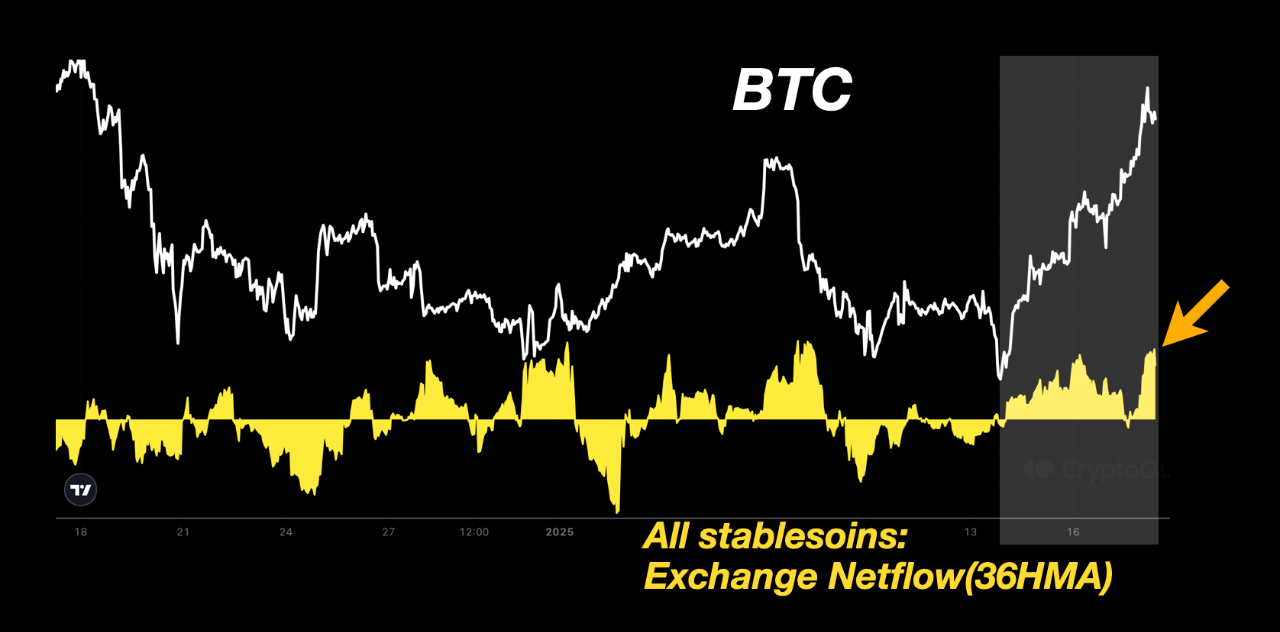 
View original →Stablecoins are steadily flowing into exchanges
Over the past week, we've had a crisis of net outflows in the middle. But then again, we've had a steady net inflow as dollars have come into the crypto market in the end. This has allowed the price to continue to make higher lows. Its price will break the $100,000 mark at any moment without a significant correction based on the net inflows trend. My view on the trend of stablecoin's netflow from exchanges is that as long as the trend of net inflows continues, there will be no meaningful correction in price. And we will have to buy the dip even if the price corrects. 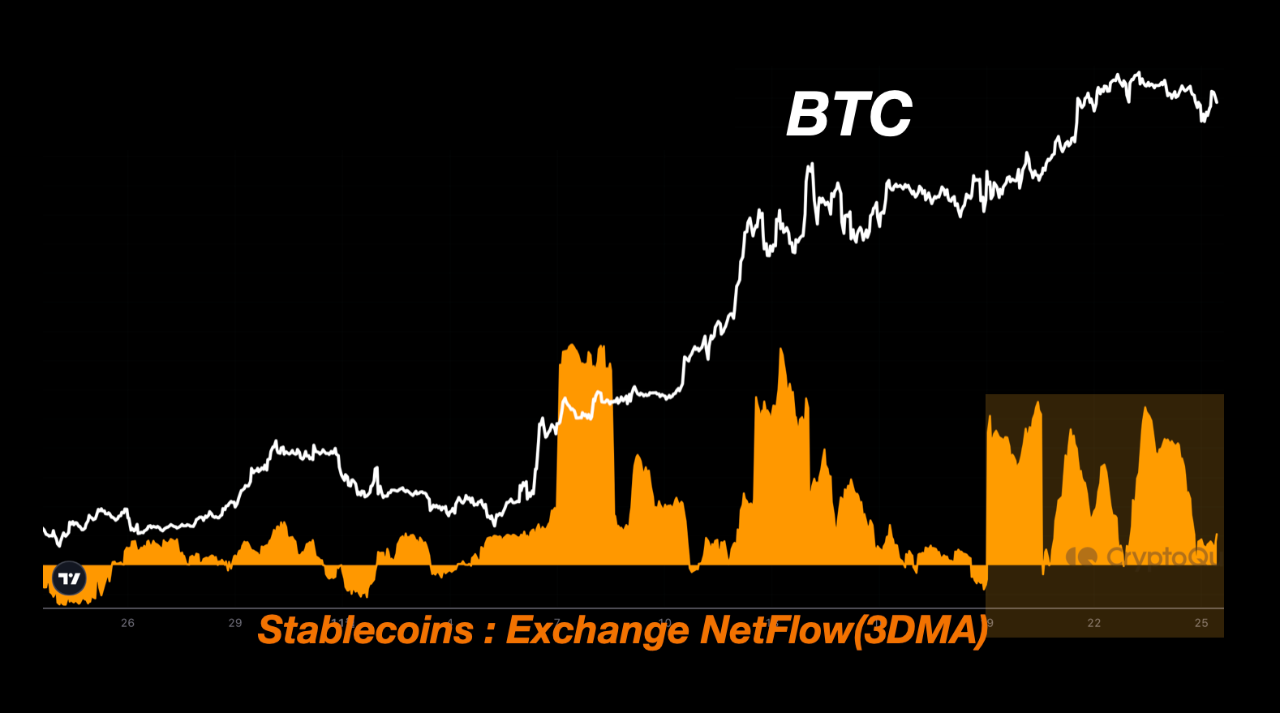 
View original →BTC supply in profit remains high
The steady maintenance of a high level of BTC supply in profit is a big clue to whether a bull cycle is underway or not. Looking back at past cycles, BTC supply in profit has mostly remained above 80%. Of course, there have been moments when it fell below 80%(= red circles), but these were opportunities to buy the lows. In the current bull cycle, it has remained above 80% for the most part. Recent summer pushed it below 80% shortly several times, but so far, those pushes were buying opportunities.  
View original →BTC price and stablecoin's exchange net flows are highly correlated this month
Stablecoins are like the blood of the coin market, especially during upward market cycles, as their increasing marketcap fuels rallies indeed. However, an increase in stablecoin marketcap alone will not cause the coin market to rise. Rather, there must be net flows of stablecoins into exchanges for the market to rise. Interestingly, in Sept, there was a high correlation between BTC price and stablecoin's exchange net flows, especially around the 10th and end of September, when its net inflows of stablecoins were positive for several days, contributing to the price rise. Therefore, I believe that the net inflows of stablecoins can be a good predictor of the future price of BTC for now.  
View original →