This time, I focused on the correlation between the BTC price chart and the FR 72H MA and analyzed the starting point of this rise.
It is a well-known fact that funding rates soar when derivatives take the lead in pushing up prices, but you can see that the price started to rise again when the FR 72H MA was in the zero region from the negative region.
Currently, the price is still in positive territory, but you should pay attention to the price trend when it is in negative to zero territory.


View original →Bullish(Nuanced)BTC
1/23/2022 Bitfinex whales tend to take long US Tethered positions as a means of hedging. There is an inverse relationship between $BTC Price and these long positions. If all of these long positions are eliminated, $BTC could be a sign of a local bottom.
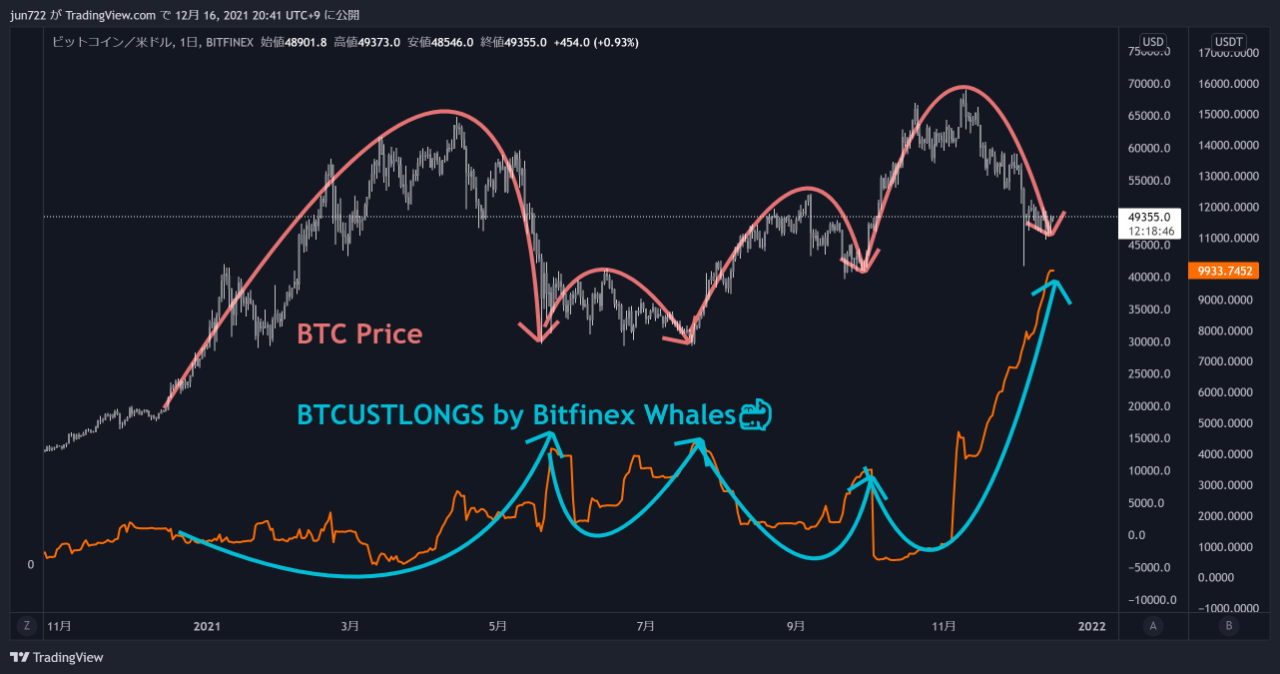
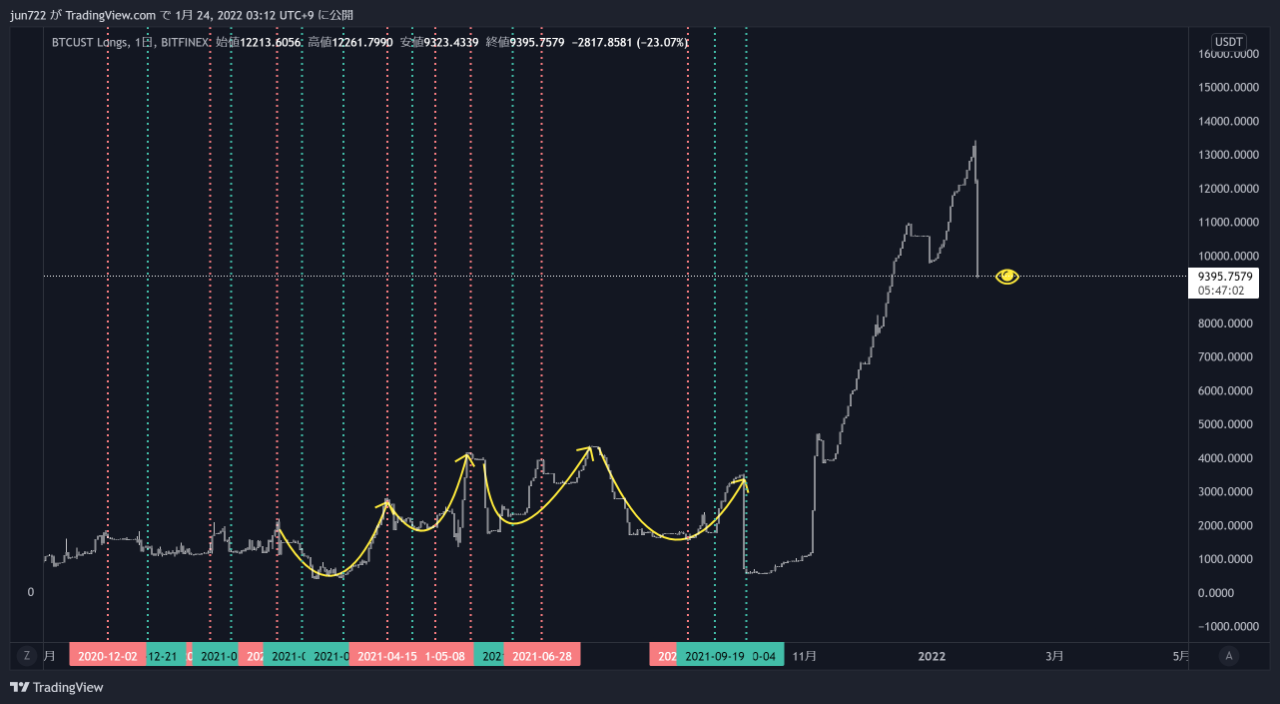

View original →Neutral1/16/2022
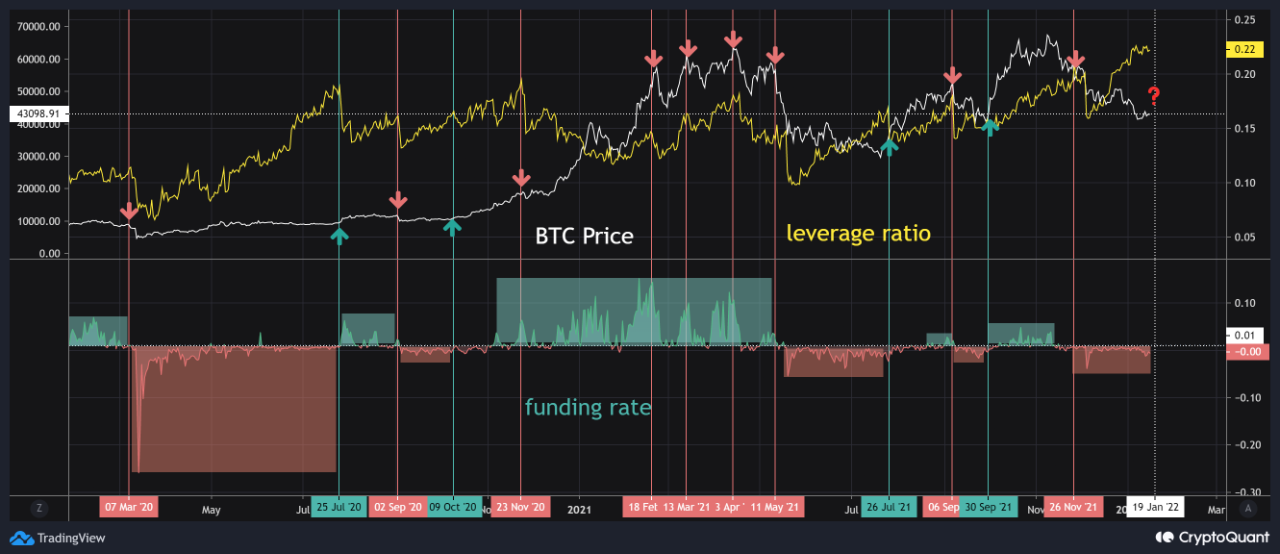
We analyzed the correlation between the leverage ratio and the funding rate. The results show that when the leverage ratio reaches a local top, the bias of the FR up to that point influences the next major price movement. If the FR continues to deviate from the norm to the negative (short receiving, short position bias) by the local top, the market tends to rise significantly afterwards. On the other hand, if FR continues to deviate from the norm to the positive (long receiving, bias toward long positions), the market price tends to fall sharply thereafter. From these regularities, we can use PA and TA to predict the next big price move. This indicator was suggested to me by a member of my community. Thanks to them.

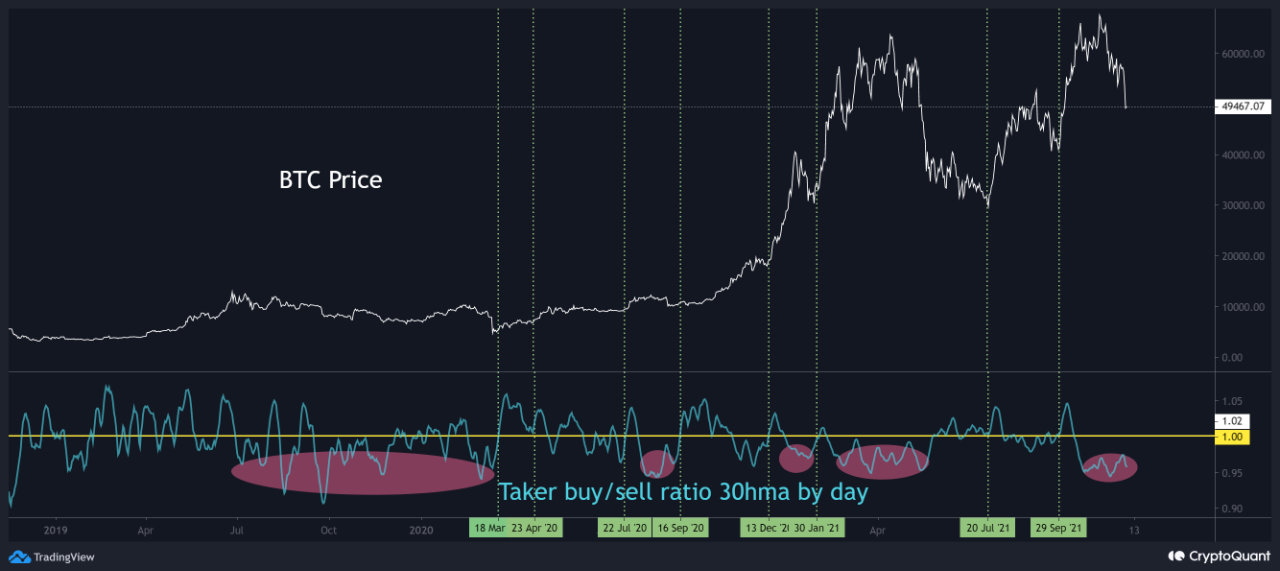
View original →I have analyzed the current market trend using the taker buy/sell ratio 30hma by day and price pairs. This clearly shows that selling pressure is overwhelmingly higher than buying pressure. We can see that in the past when the taker buy/sell ratio entered the positive territory of the 1.0 threshold, the price has risen significantly since then. Although some other on-chain indicators are suggesting an upturn, we believe that this is not yet the BTFD timing. Until this returns to positive territory, even if there is a temporary rebound, there is a possibility of a range due to further declines and price adjustments.

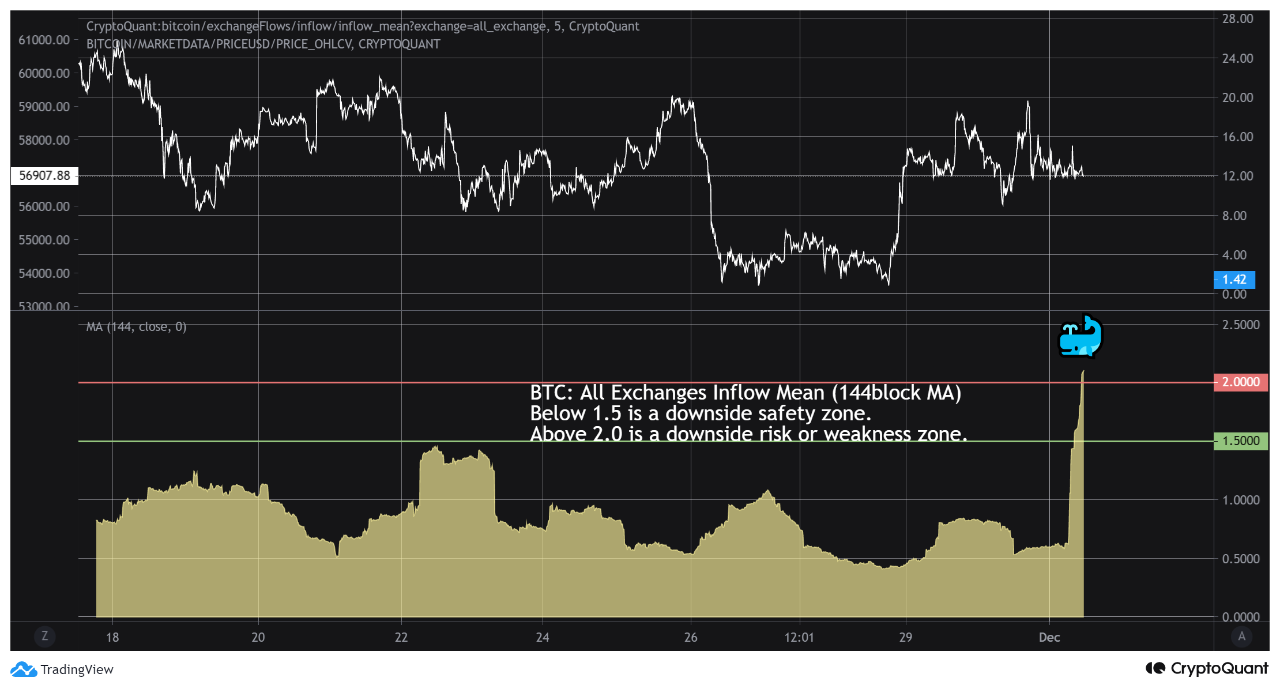
View original →The inflow mean, which is the average BTC inflow to all exchanges, has skyrocketed since around 11:00 UTC.
Above 2.0 is a downside risk or weakness zone. The possibility of dumping in the future has emerged. I think we need to continue to be careful.

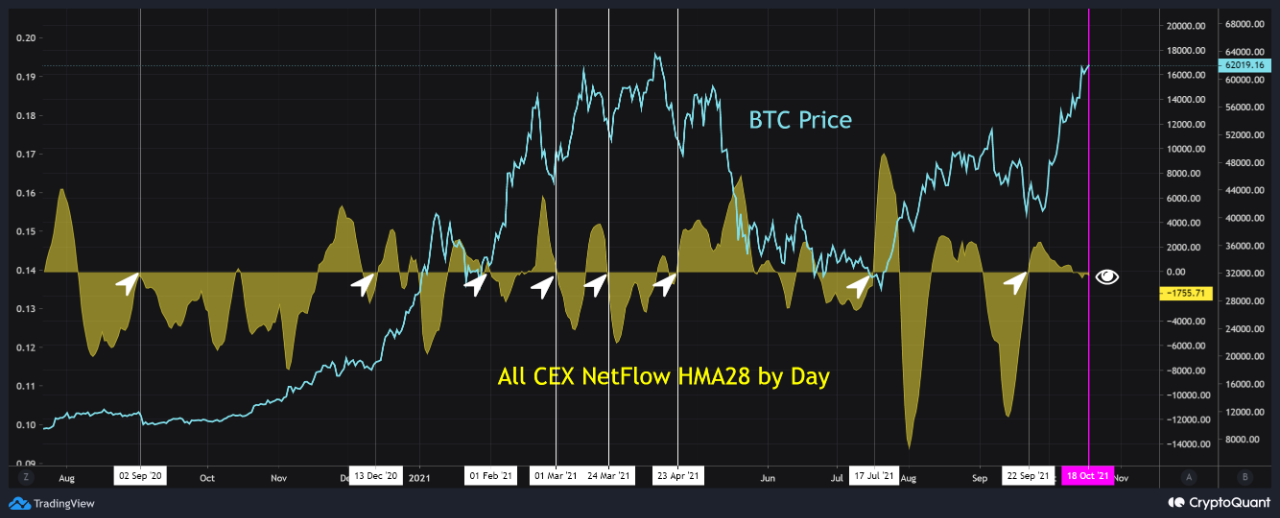
View original →We checked the status of NetFlow during the past major upswings, and found that NetFlow has converged around the zero starting point each time.
The NetFlow is converging around the zero starting point every time, which is exactly the same as in the past, indicating that the market is in very good shape. I think we can expect the bull to resume in the future.

View original →Bullish(Nuanced)BTC
9/14/2021 i analyzed the correlation between Gemini NetFlow increase/decrease and BTC Price highs in an upward trend. This analysis revealed that when the Gemini NetFlow 30MA by Day reached a local top and then started to decline, the price ATH five days later in 2017, 23 days later in 2021, and the price ATH within 20 days on average in other areas. We may also be able to use this compair indicator as a reference to determine future price changes in the ceiling area. Please refer to it for reference.


View original →Bearish8/19/2021
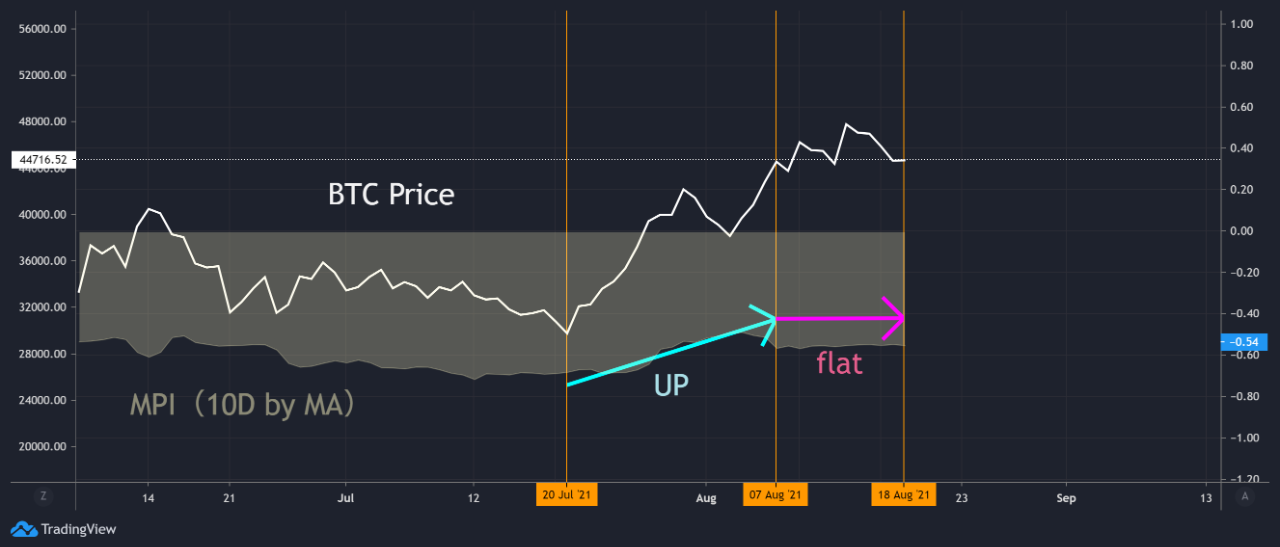
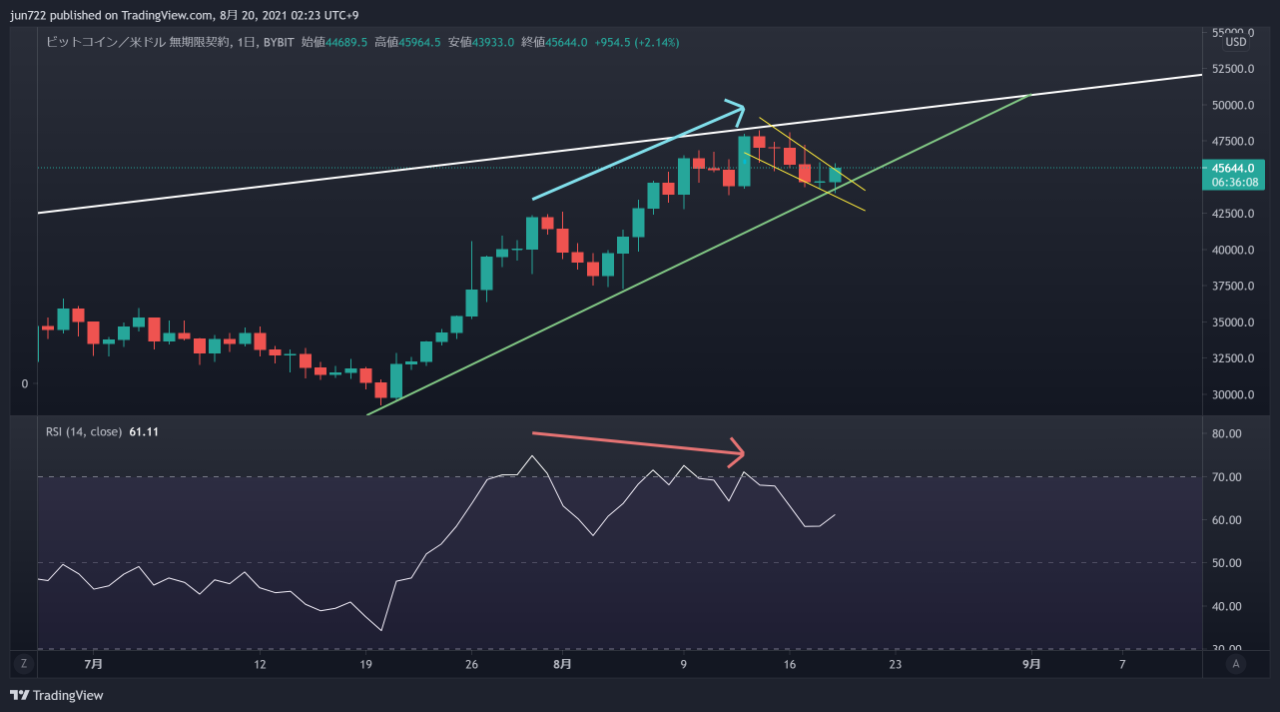
MPI (10day-MA) has been moving sideways since August 7, which means that profit-taking by miners is clearly slowing down along with the stagnation of the price increase. From a technical standpoint, the daily RSI has already formed a bearish divergence, and we expect that a price adjustment may occur before the price exceeds 50K in the short term.
※To analyze the movement of the miner in more detail MPI used the 10day-MA.

View original →Bearish(Nuanced)BTC
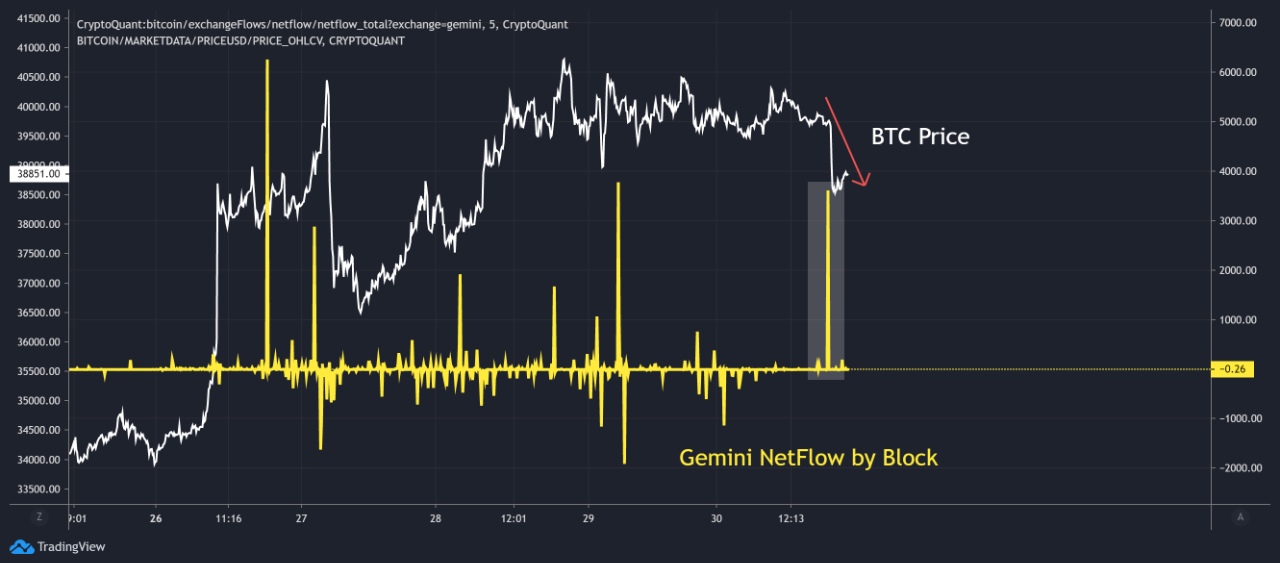
7/30/2021 Just before today's plunge, inflow to Gemini spiked, and as a result, Gemini's NetFlow quickly turned into a positive divergence. Needless to say, there have been many cases in the past where a sharp rise in Gemini's inflow was followed by a sharp fall. We will have to keep a close eye on the price movements after the sharp rise in Gemini's inflow.

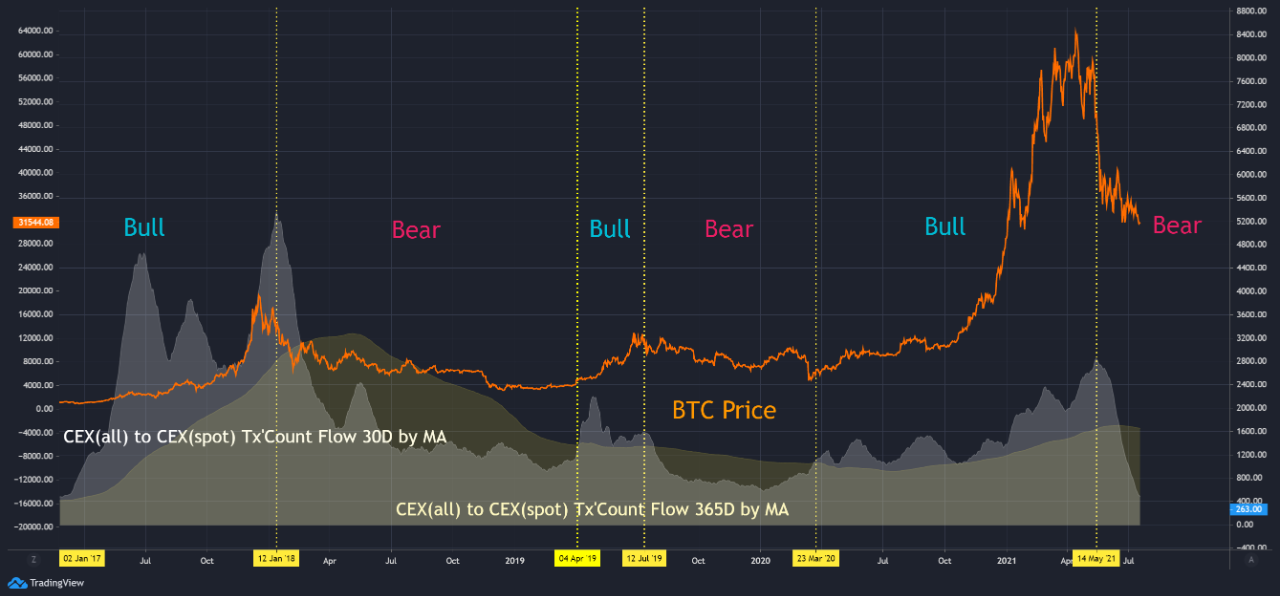
View original →I analyzed the market using CEX(all) to CEX(spot) Tx'Count. as long as the 30D by MA is above the local top, 365D by MA, the market seems to be in a bull market. When this is reversed, the market seems to be in a bear market. In short, I guess we can say that we are in a bull market when the transfer of BTC from all exchanges to the SPOT exchange is very active.

View original →

