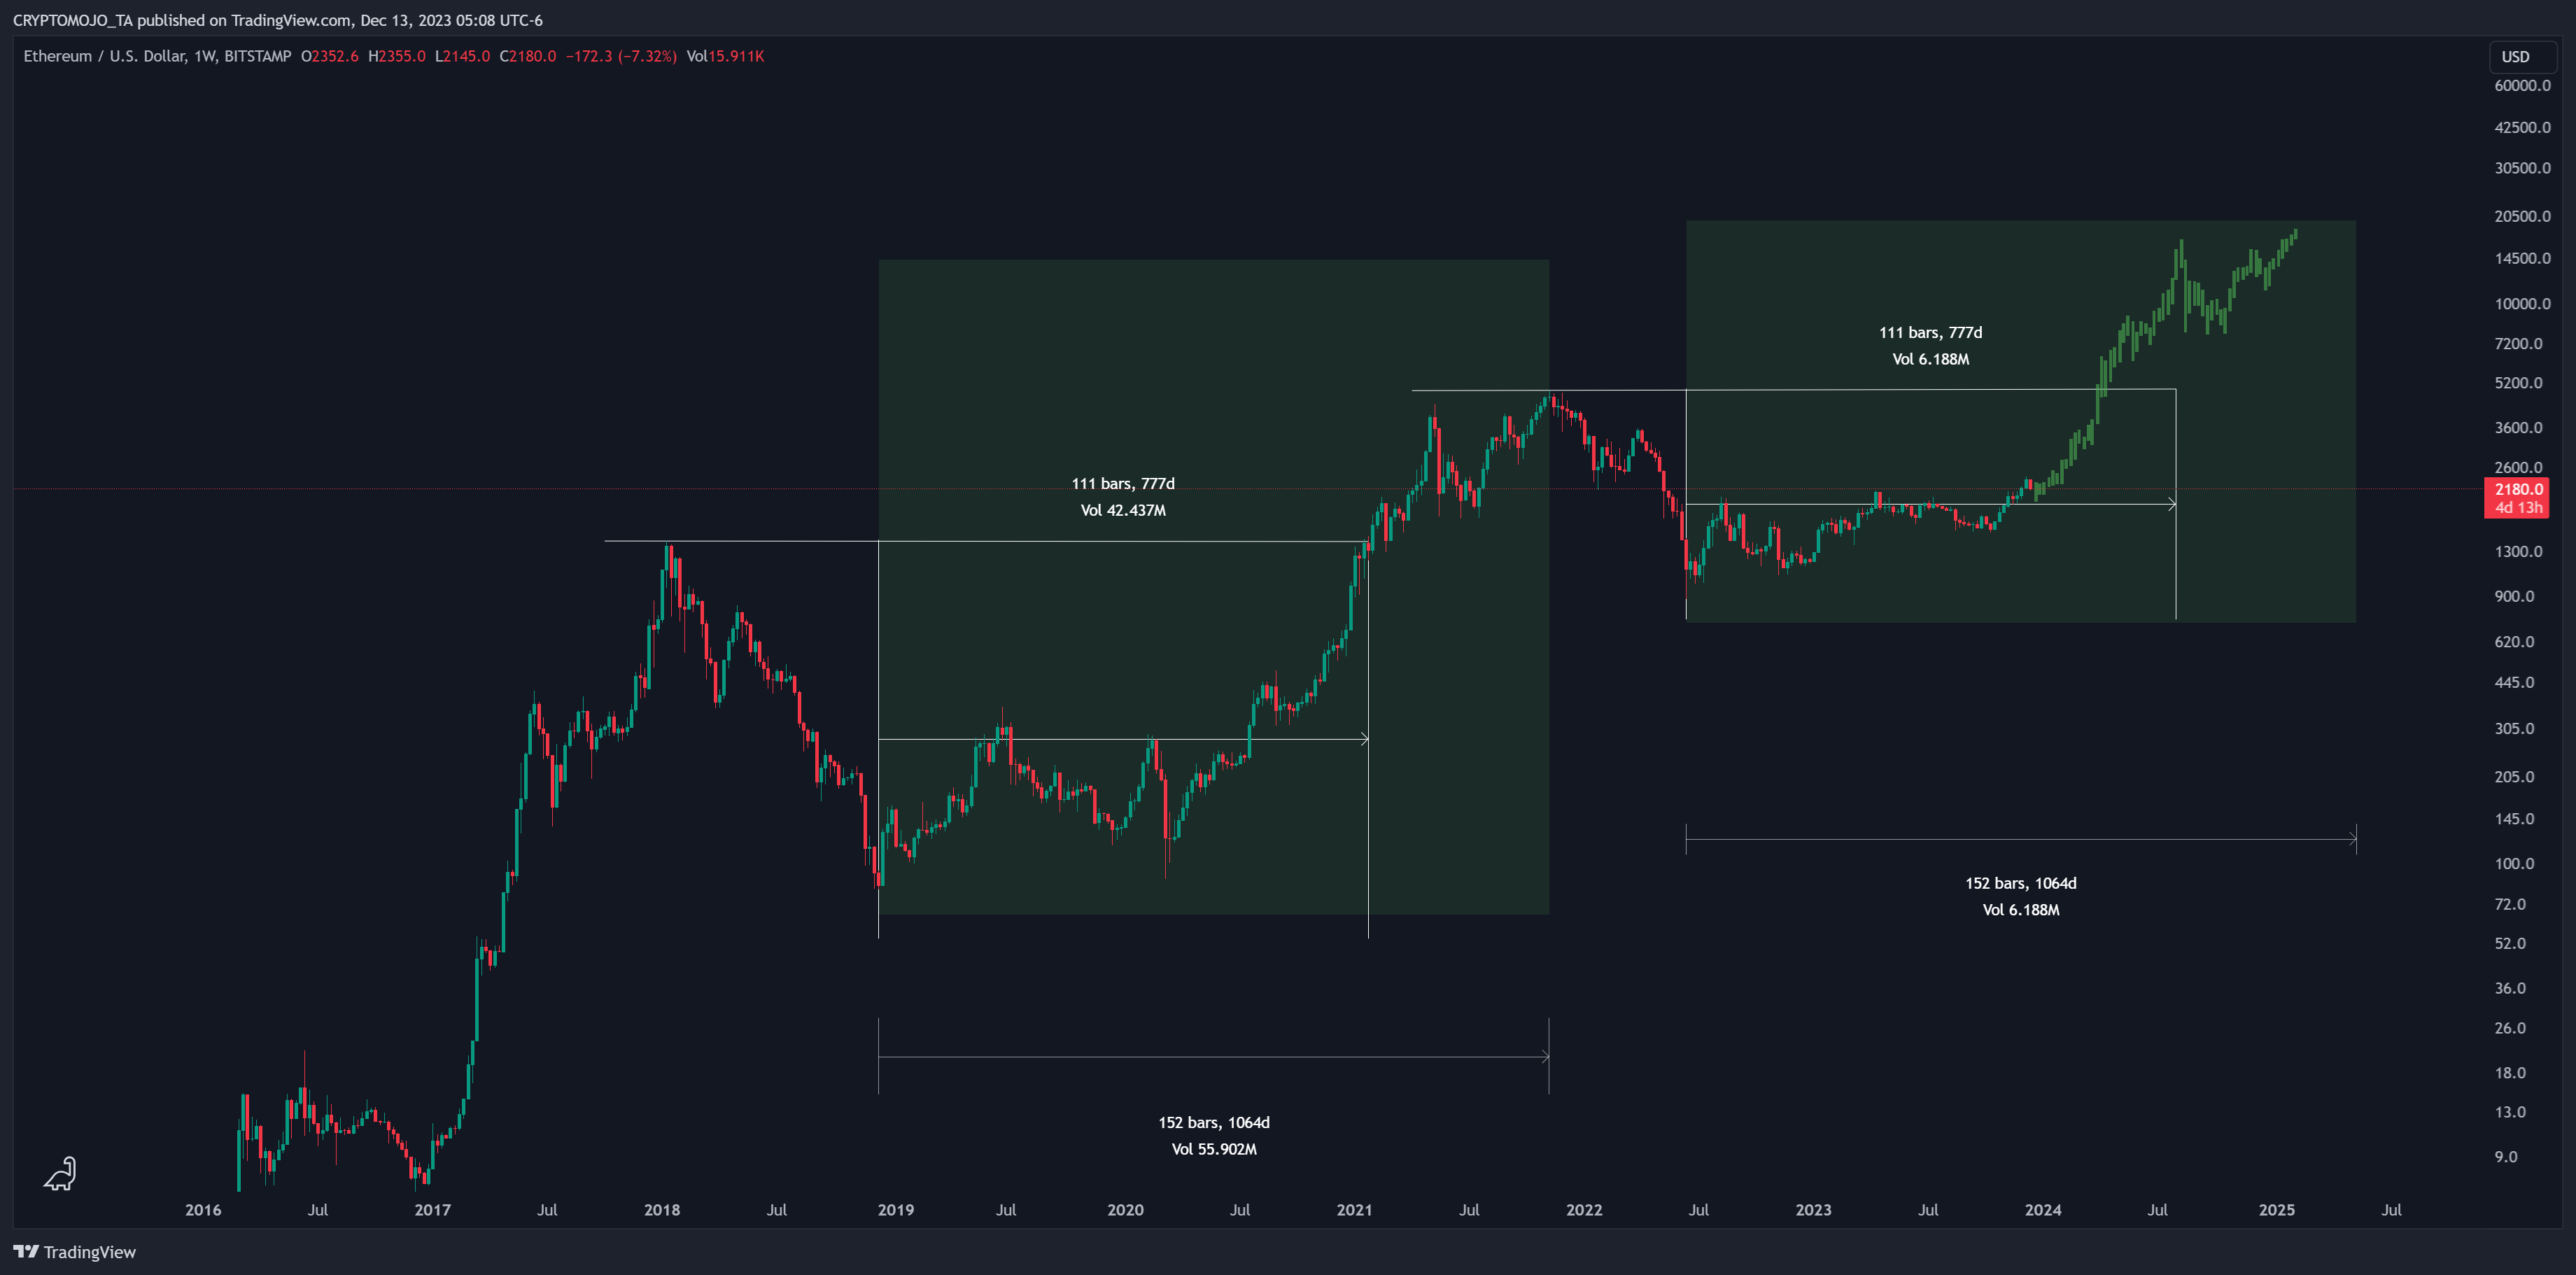
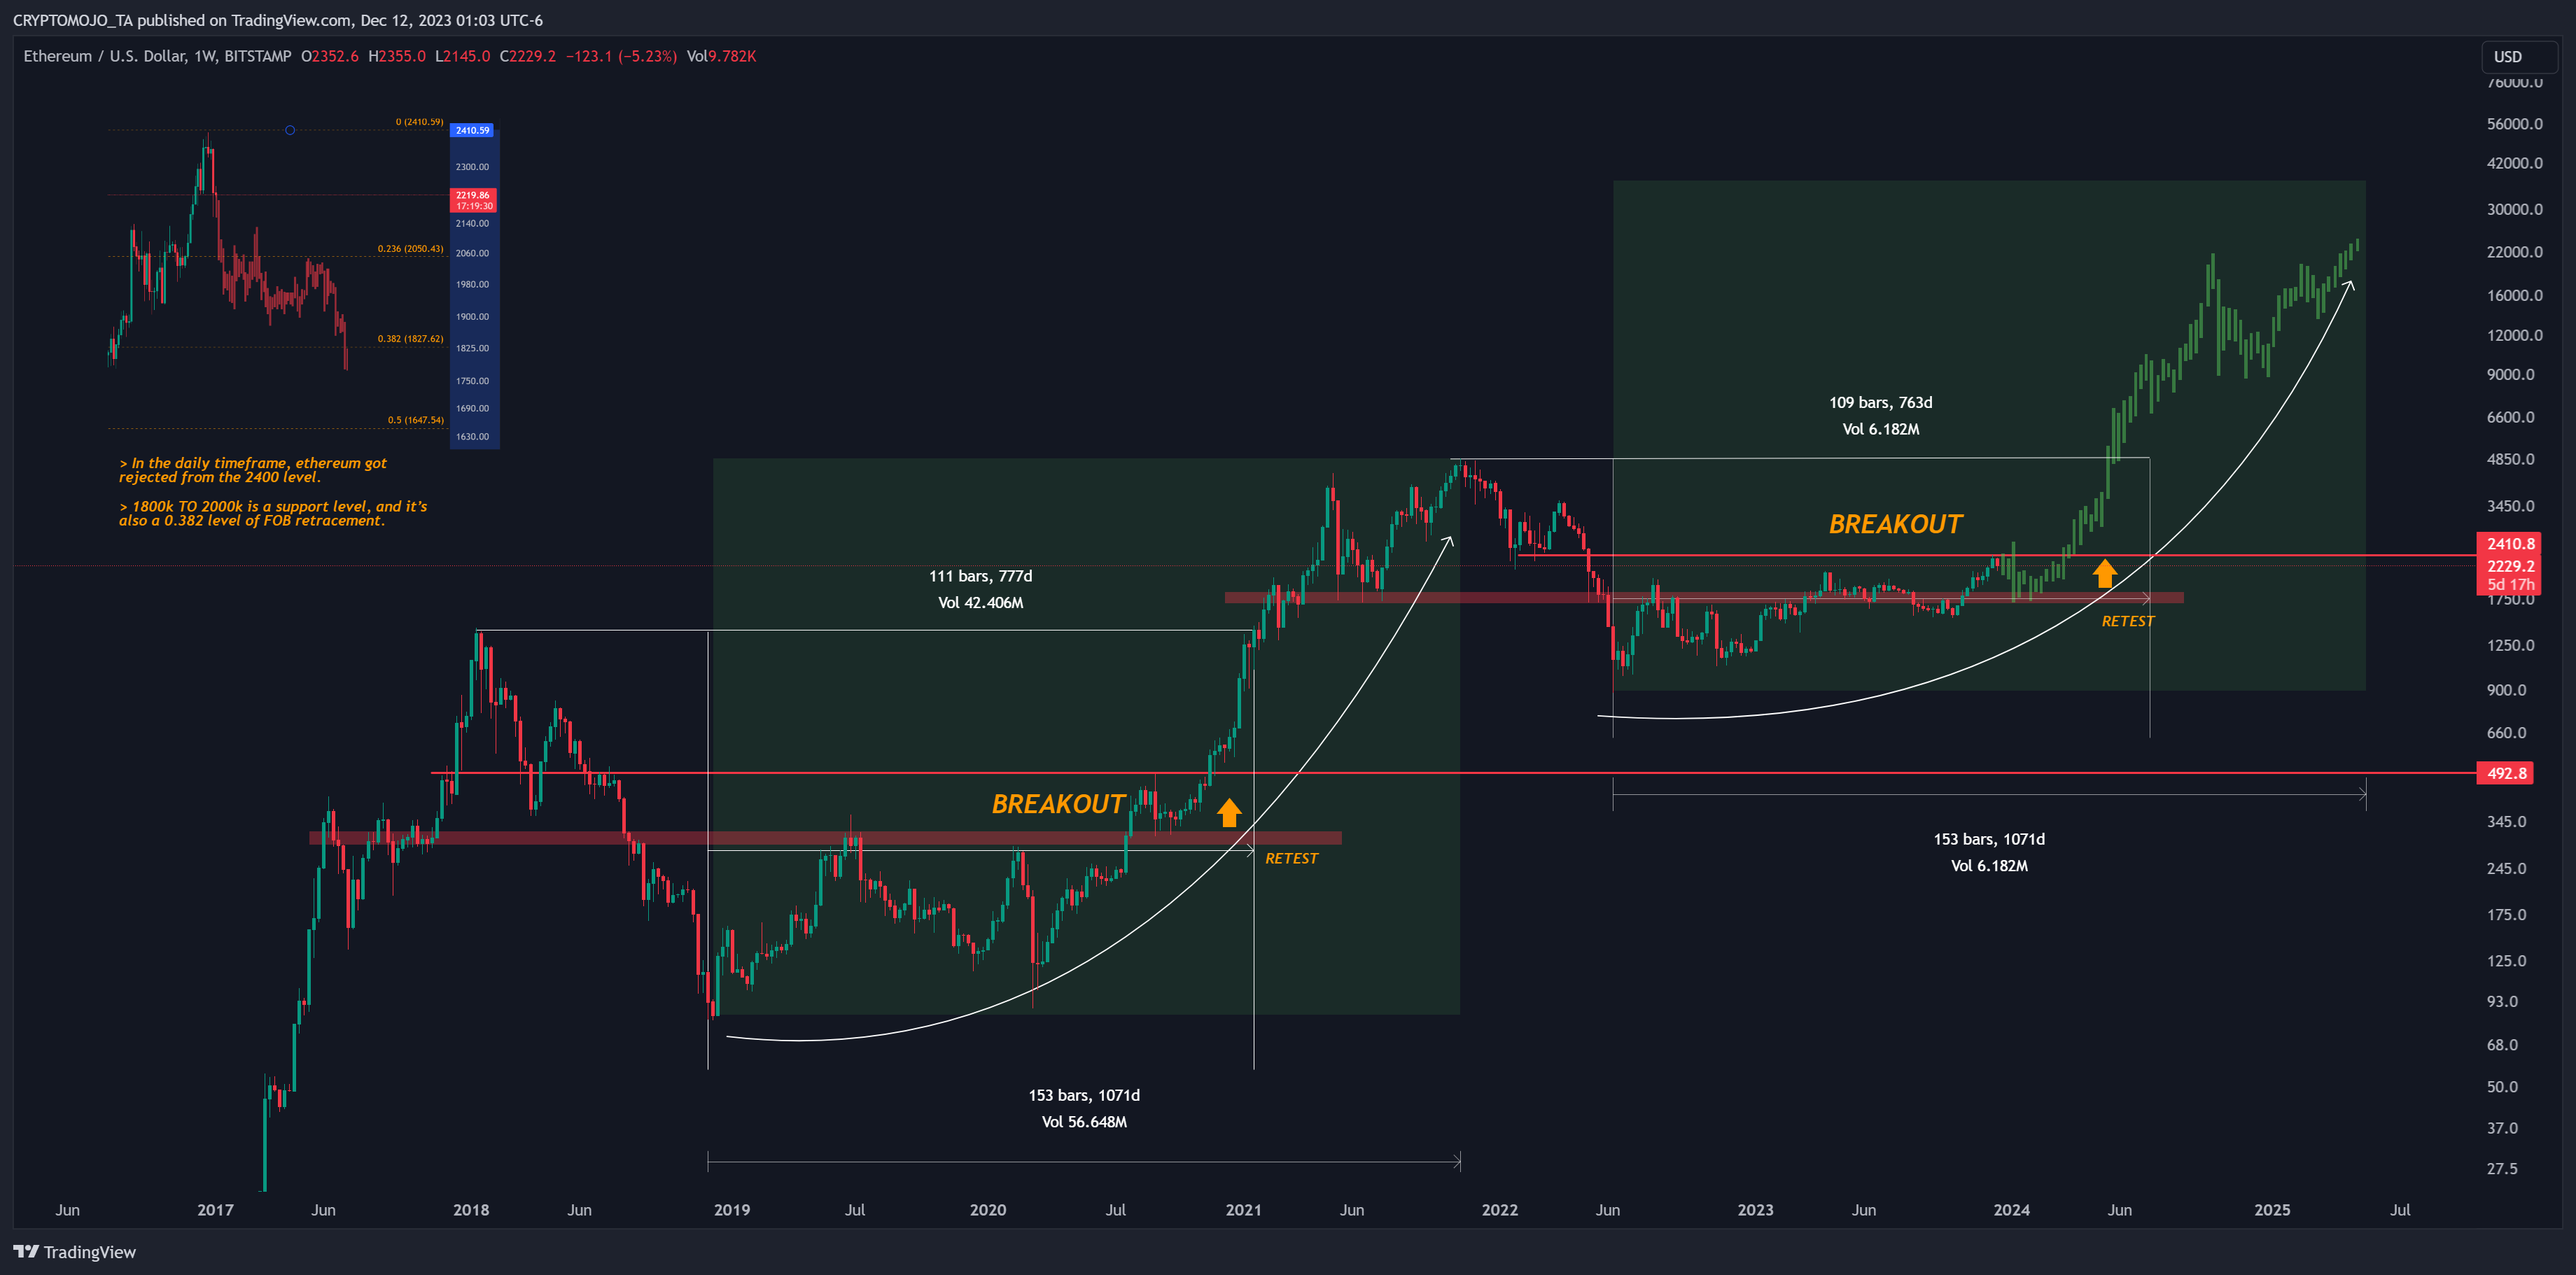
In the first cycle, after the all-time low (ATL), $ETH took 777 days to surpass its previous all-time high (ATH).
- If history repeats itself, a new ATH could potentially be reached around 700 days from today, possibly by July 2024.
- The last bull run lasted around 1071 days. - This time, it is expected to last between 1071 to 1064 days of a bull market.
- If history repeats, new ATH around July 2024 (700 days from now).
Last bull run: 1071 days long.
Expected current bull run: 1064–1071 days.
Based on fractal analysis and chart data, it is anticipated that Ethereum will reach its next bull market peak in May to June 2025.
#Crypto

View original →Bearish(Nuanced)BNB
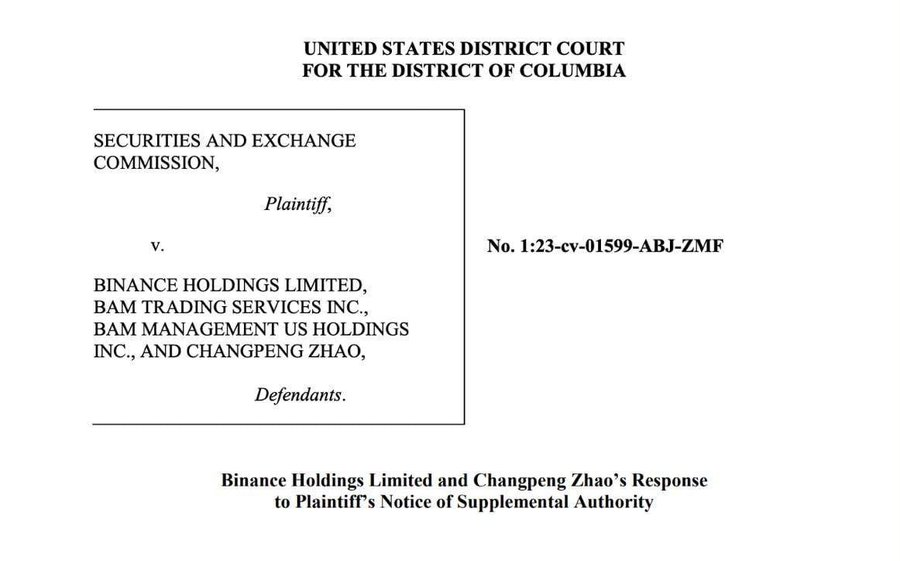
12/13/2023 In the latest legal showdown between Binance and the SEC, Binance fires back, challenging the SEC's claims by questioning the relevance of DOJ and FinCEN resolutions. The SEC, citing Binance's recent settlement
faces resistance as both sides battle it out in court. Stay tuned for updates on this high-stakes legal saga! 💼⚖️ #Binance #SEC #LegalBattle #CryptoNews #StaySafe

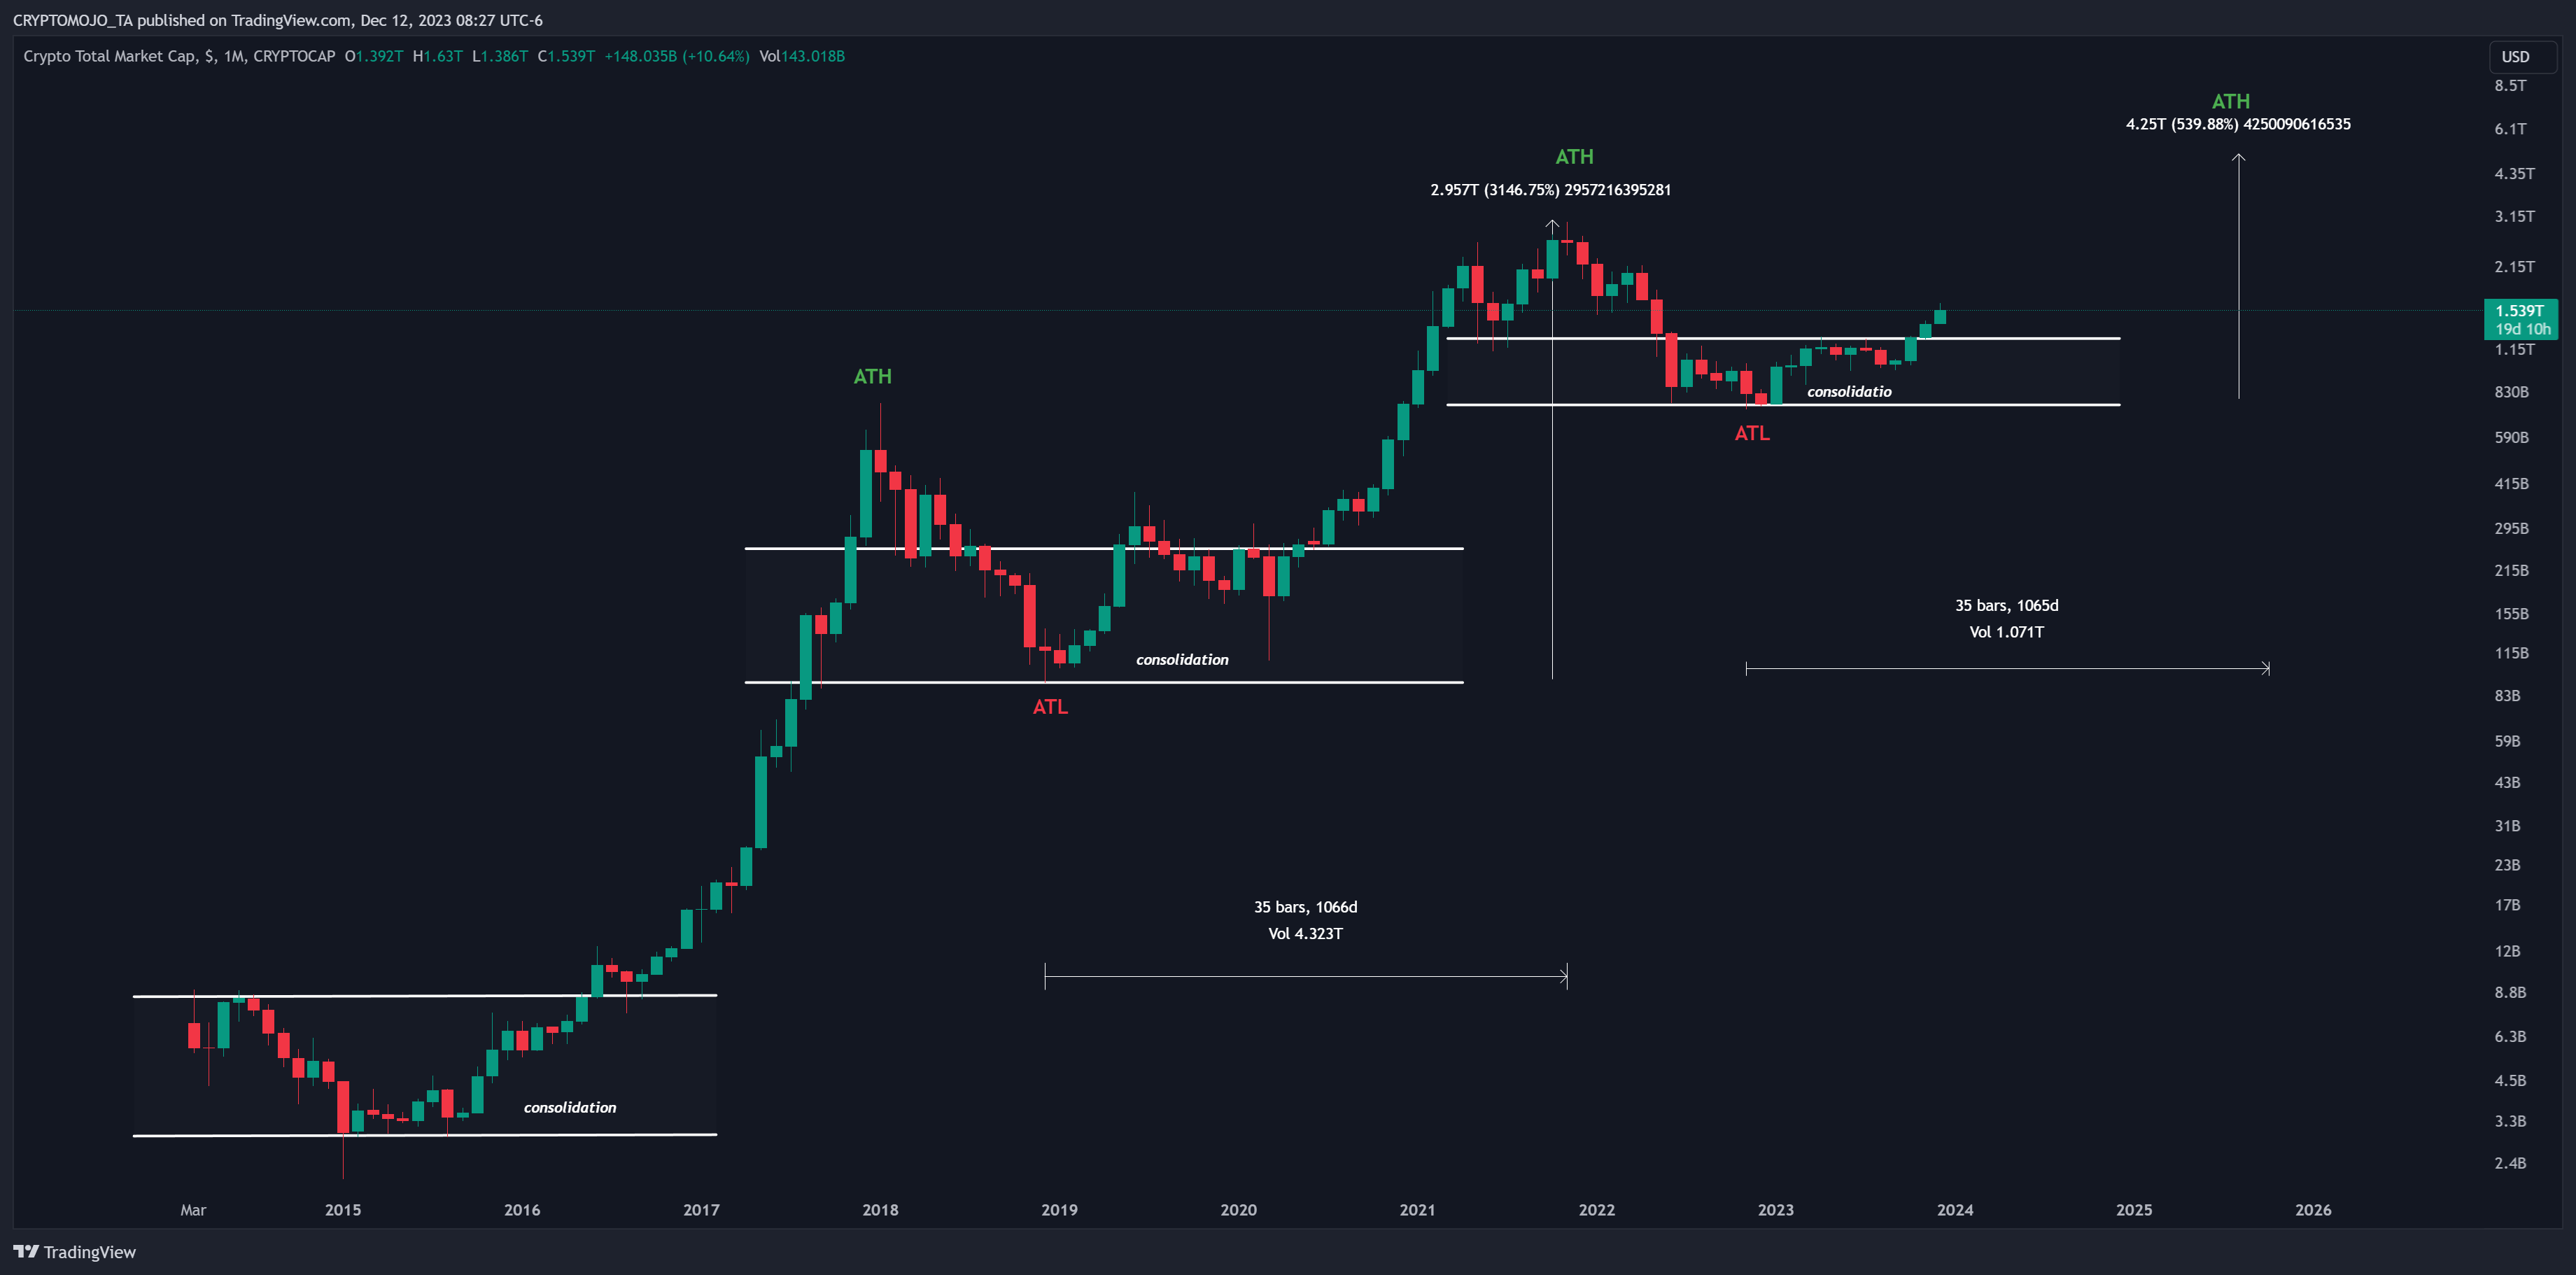
View original →Anticipating an Altcoin market cap soaring to a staggering $5 trillion by 2025. Here's the roadmap:
📊 Historical Timeline:
2014–2015: 610 days of consolidation.
2016-2017: Altcoin MCap went parabolic, hitting Extension 3.168 at $400B.
2018-2019: 609 days consolidation before a breakout.
2020-2021: Altcoin MCap hit Extension 3.168 at $1.65T.
2022-2023: 548 days of consolidation, hinting at an imminent breakout.
2024-2025: Altcoin MCap is projected to skyrocket, hitting Extension 3.168 at a whopping $5T.
Are you still on the fence about the long-term alt game? 👀 #AltSeason #CryptoRevolution 🚀💎
https://x.com/CRYPTOMOJO_TA/status/1734583024749363294?s=20

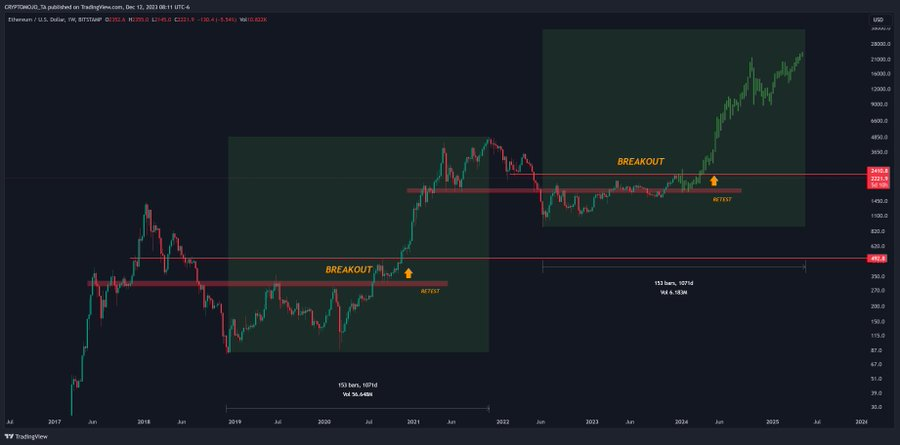
View original →In the weekly timeframe, Ethereum smashes through horizontal resistance, mirroring patterns from the last bull run. Brace yourselves for an imminent retest, echoing the excitement of previous bullish surges! 🌐💎 #Ethereum #CryptoBreakout #BullishJourney 🚀

View original →Bullish12/12/2023
Introduction:
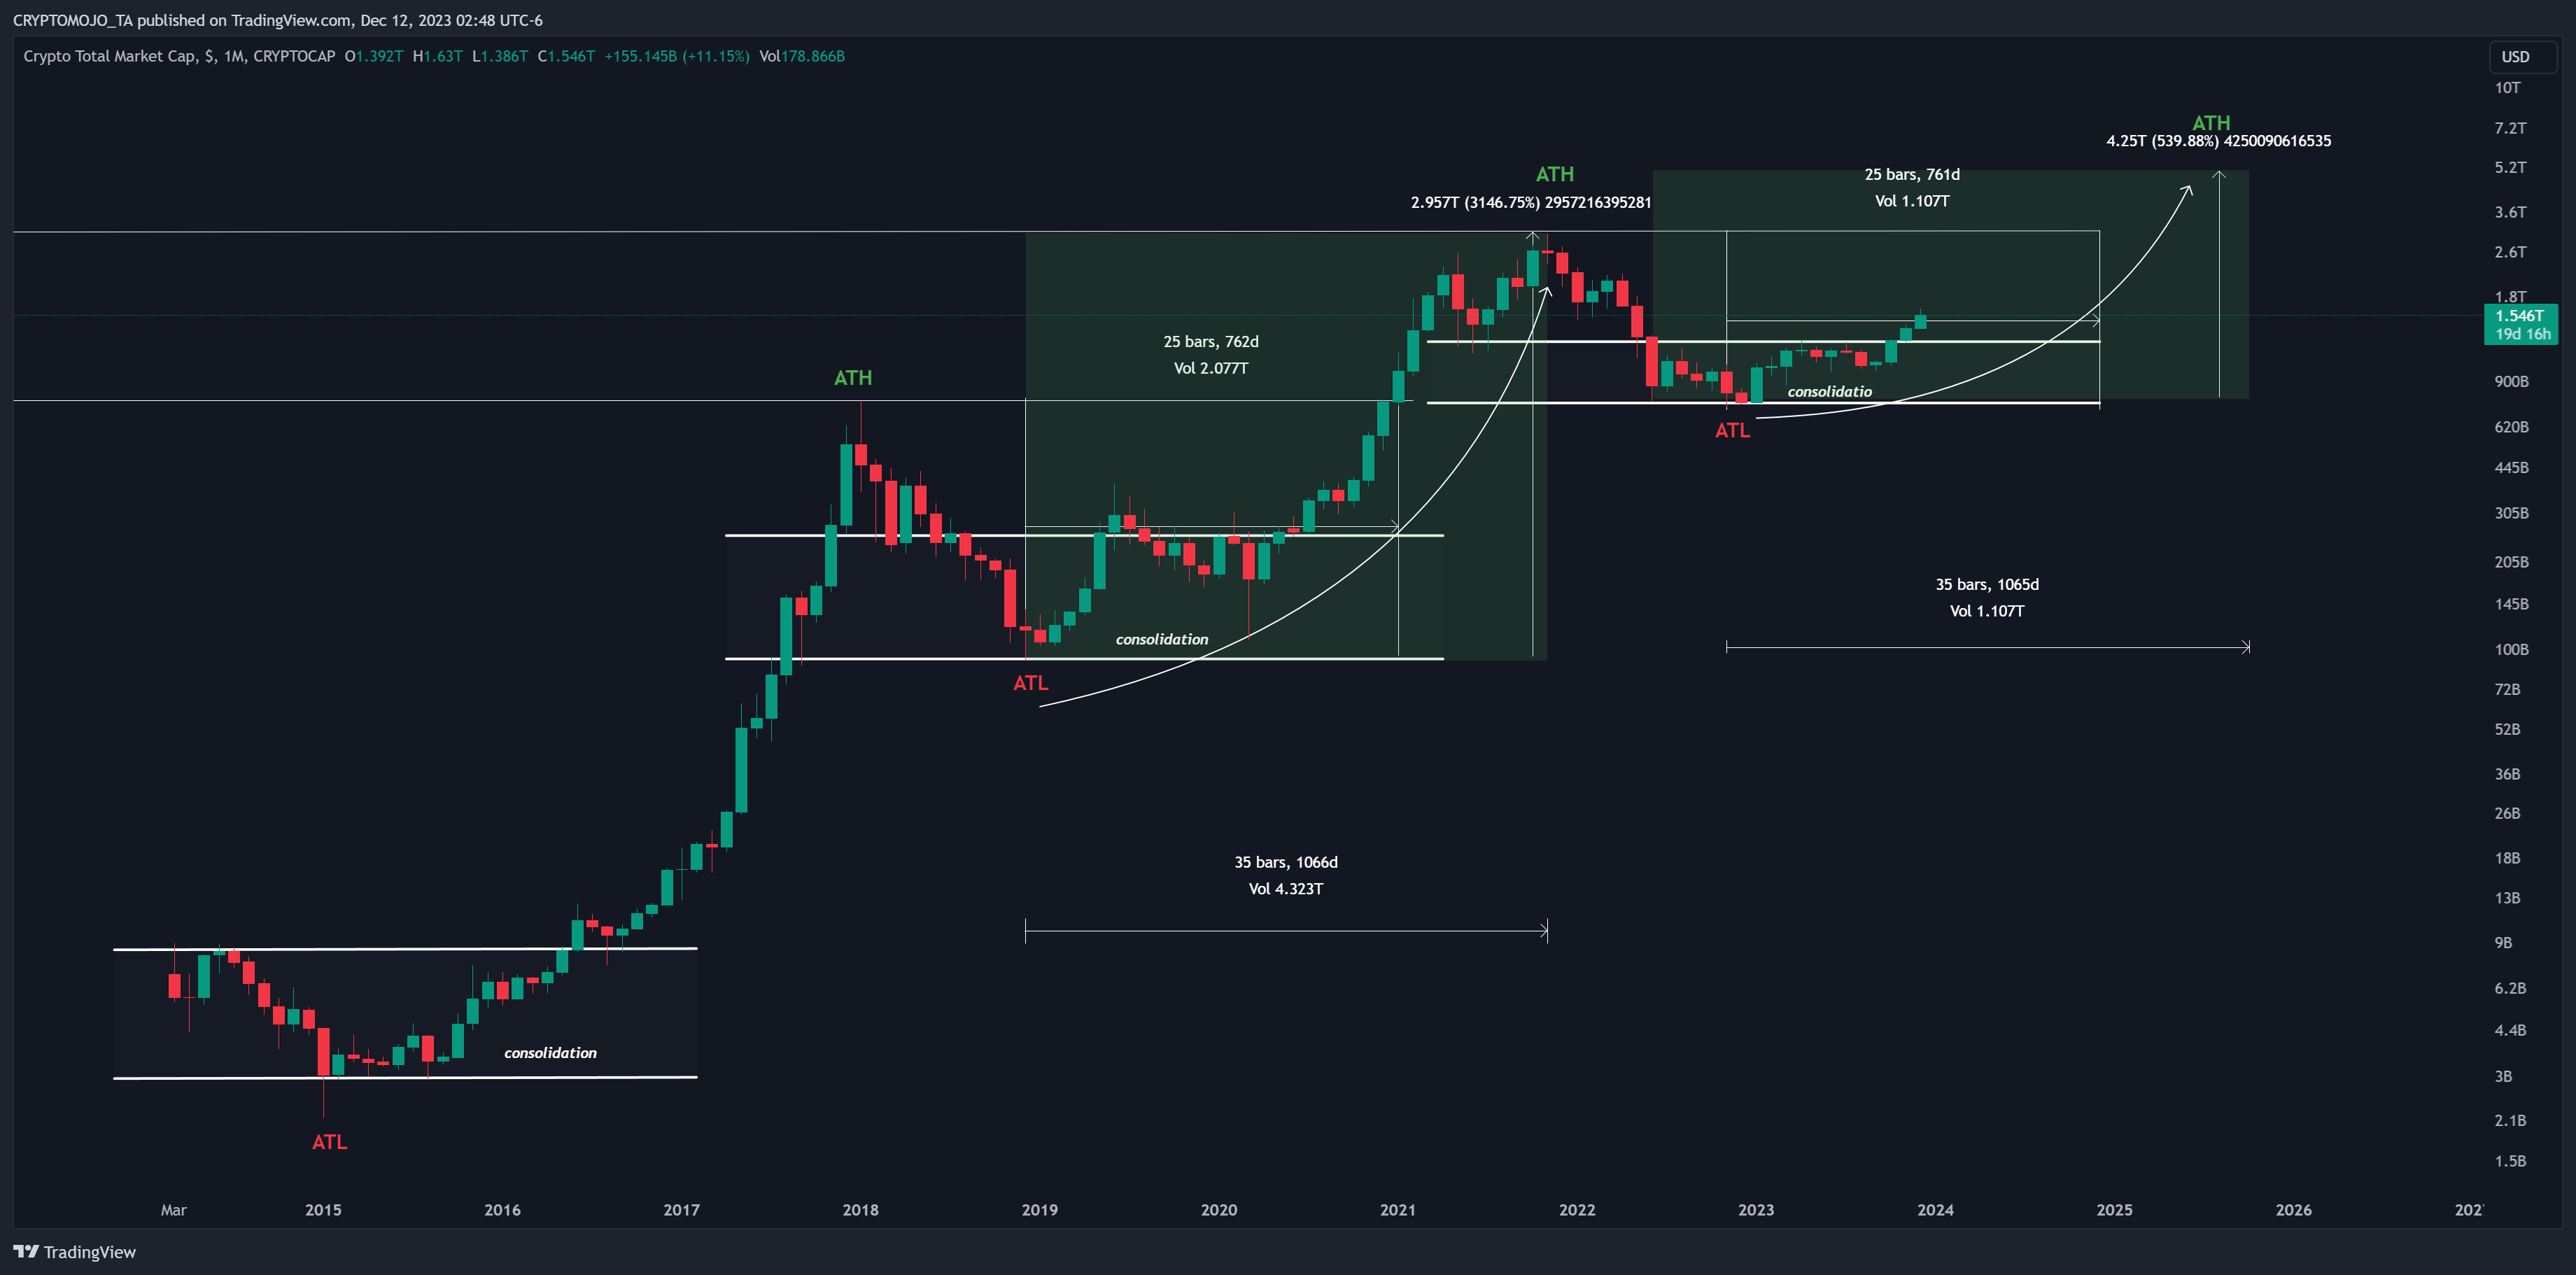
The cryptocurrency market is abuzz with predictions of an impending altcoin season that could lead to a staggering $5 trillion Altcoin MarketCap by 2025. This forecast is grounded in historical data, fractal analysis, and chart patterns, suggesting a pattern reminiscent of previous market cycles.
Historical Context:
Examining the historical data reveals intriguing patterns:
After the all-time low (ATL), it took 762 days for the Total Market Cap to surpass its previous all-time high (ATH).
If history repeats itself, a new ATH could be reached approximately 761 days from today, potentially around December 2024.
The last bull run lasted about 1066 days, and the current one is expected to span between 1071 to 1064 days.
Fractal Analysis:
The fractal analysis unveils a compelling narrative:
In 2014–2015, the market experienced 610 days of consolidation.
2016-2017 witnessed a parabolic rise in Altcoin MarketCap, hitting Extension 3.168 at around $400 billion.
2018-2019 saw another 609 days of consolidation before a breakout.
Currently, in 2022-2023, the market has undergone 548 days of consolidation, hinting at an imminent breakout.
Future Projections:
Building upon the historical context and fractal analysis, the projection for 2024-2025 unfolds:
Anticipating that Altcoin MarketCap will experience a surge, reaching Extension 3.168, estimated at $5 trillion.
The expected timeframe for this extraordinary surge is set for the period of September to October 2025.
Conclusion:
Considering the historical patterns, fractal analysis, and projected timelines, the narrative paints a bullish outlook for altcoins in the long term. The predicted Altcoin MarketCap of $5 trillion by 2025 suggests significant potential for growth and underscores the importance of keeping a keen eye on market dynamics in the coming years. As the cryptocurrency landscape evolves, investors may find compe

View original →Bullish(Nuanced)ETH
12/12/2023 In the weekly time frame, Ethereum broke out of this horizontal resistance, resembling the pattern observed in the last bull run. Following this breakout, a retest similar to the previous bull run is anticipated.
📅 Daily Timeframe:
Rejection at $2400.
$1800-$2000, 0.382 Fibonacci retracement, is a crucial support.
Optimal entry: $1750-$2000 range.
📈 Historical Insights:
First cycle: 777 days from ATL to surpass previous ATH.
If history repeats, new ATH around July 2024 (700 days from now).
Last bull run: 1071 days.
Expected current bull run: 1064–1071 days.
Based on fractal analysis and chart data, it is anticipated that Ethereum will reach its next bull market peak in May to June 2025.
Stay tuned for #ETH updates! 🚀💎 #CryptoNews #EthereumForecast

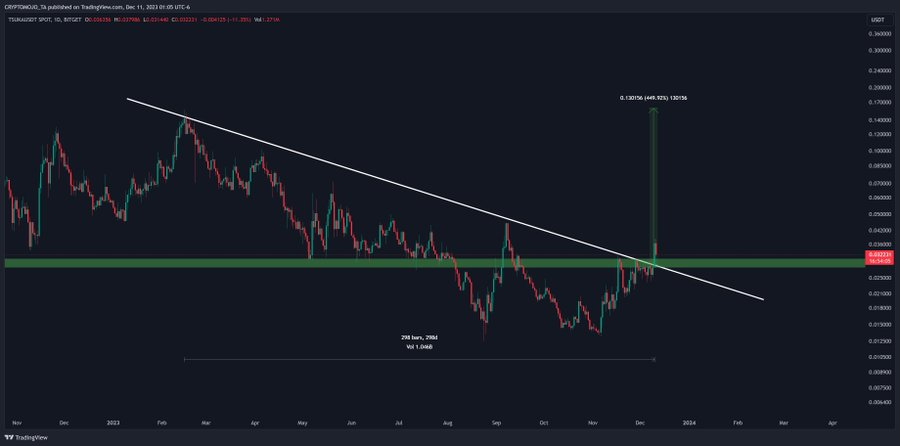
View original →In the daily timeframe, #TSUKA has broken a 298D resistance and is currently in the retest phase. The price is anticipated to sustain its upward trend, aiming for previous highs. Currently trading in the Buy Zone, a bullish momentum is on the horizon.
🔍 Entry: The plan is to buy in this retest
🎯 Targets:
TP1: 0.0637
TP2: 0.082
TP3: ATH
🛑 SL: Close below upper support on a daily candle.
Remember to DYOR! 🚀
#Crypto #TradingAlert

View original →Bullish(Nuanced)12/12/2023
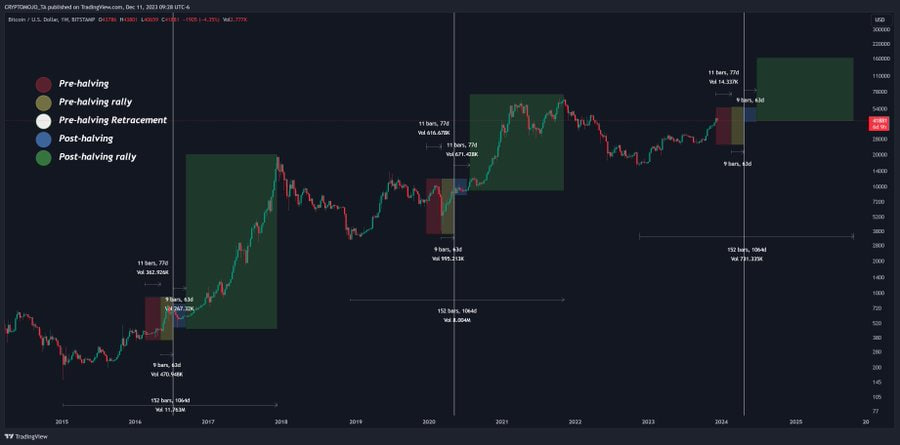
1️⃣ Anticipating the Halving: 4.5 months to go, historical trends predict returns post a deeper retracement.
2️⃣ Hype-driven Rally: 77 days pre-Halving, a yellow-hued rally as investors "Buy the Hype" gearing up to "Sell the News."
3️⃣ Halving-induced Retrace: Around the event, retracement historically hit -38% (2016) and -20% (2020), sparking doubts about the bullish impact.
4️⃣ Post-Retrace Re-Accumulation: A red-dominated, multi-month phase tests patience, battles boredom, and manages disappointment.
5️⃣ Entering the Parabolic Uptrend: From re-accumulation (green), Bitcoin sets sail on a parabolic uptrend, heading to new All-Time Highs.
Stay tuned for more

View original →Bullish(Nuanced)BTC
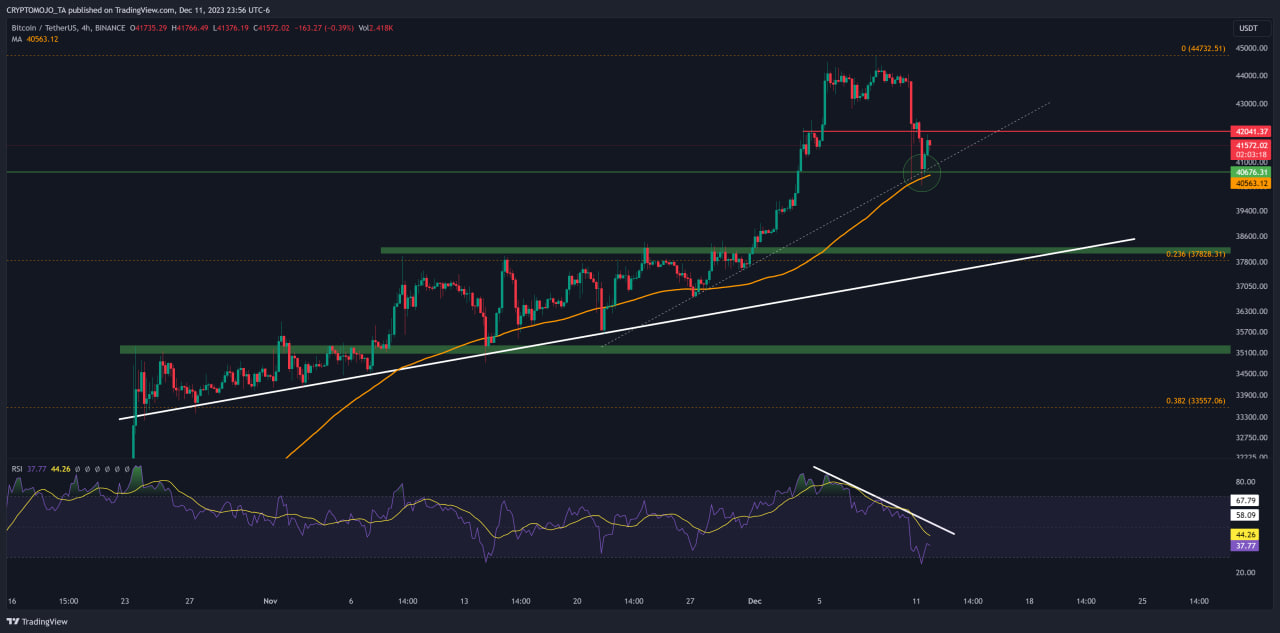
12/12/2023 BTC bounces back, retesting the ascending trendline and finding support at MA 100. 📊 A bullish rally is on the horizon as long as it holds above the trendline. 🚨 Caution: A sustained breakdown might trigger a market correction.

View original →

