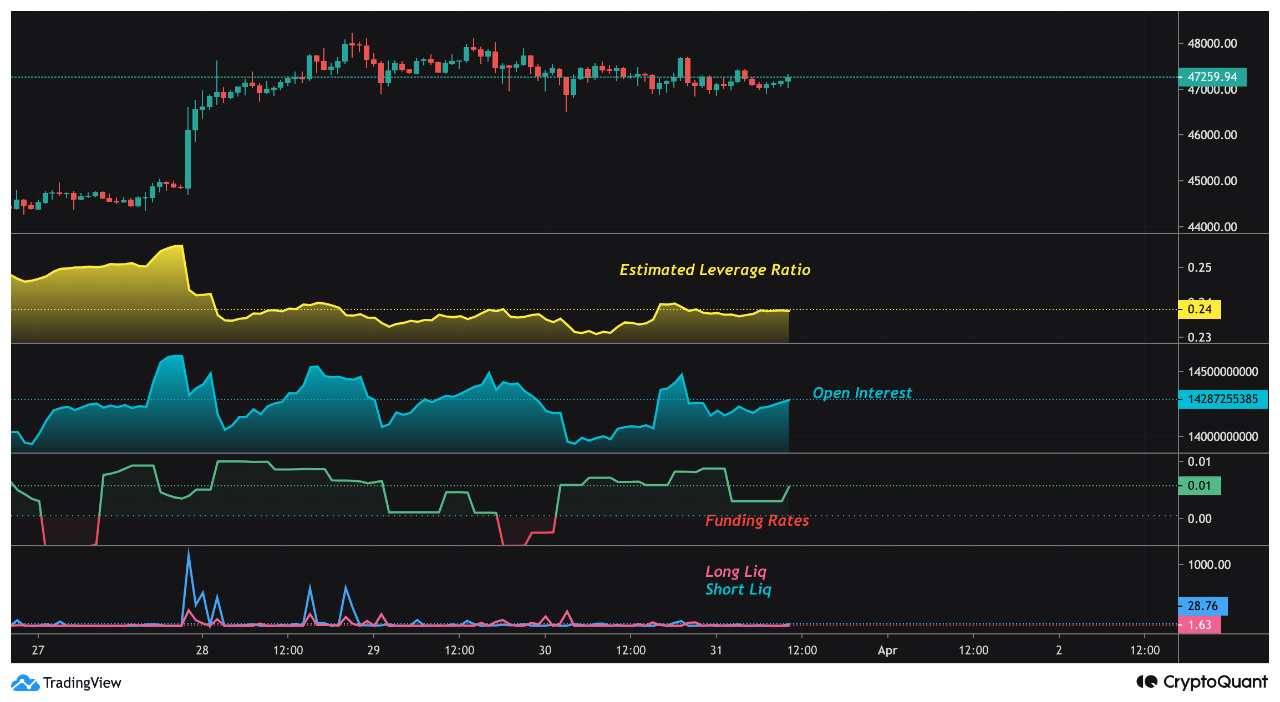
As we can see in my chart, which offers the opportunity to follow derivative metrics from a single screen, although open interest is high, leverage ratios do not increase. What we understand here is that traders can open positions, but they are not very courageous. When we look at the funding rates, we see that bullish investors are dominant. The market is calm in the last few days and there are no hard liquidation moves. Judging by the derivative metrics, it is possible to see a sharp movement in Bitcoin. Chart link is below.

View original →Bullish(Nuanced)BTC
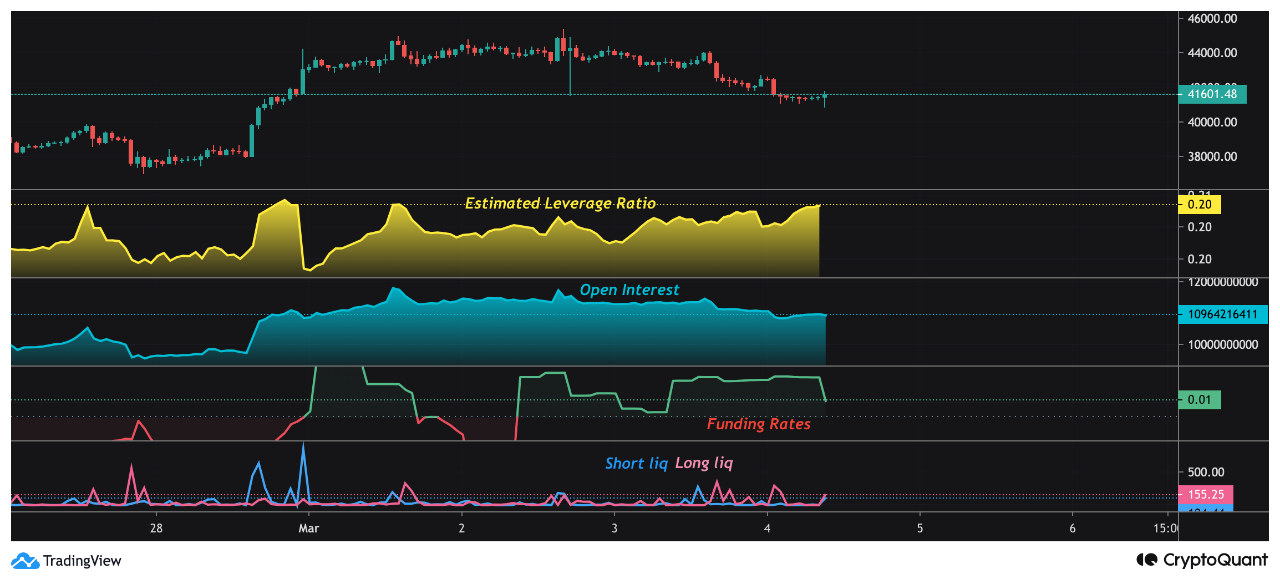
3/4/2022 I have created a chart for you to follow the derivative metrics on a screen. Although the Bitcoin price has been falling since yesterday, there is no decrease in leverage ratios. Although the number of open interest has decreased, the increased leverage ratios show that the market is more courageous than weeks ago. Funding rates fluctuate between neutral and positive. This is positive for us. You can track derivative metrics by saving my chart!

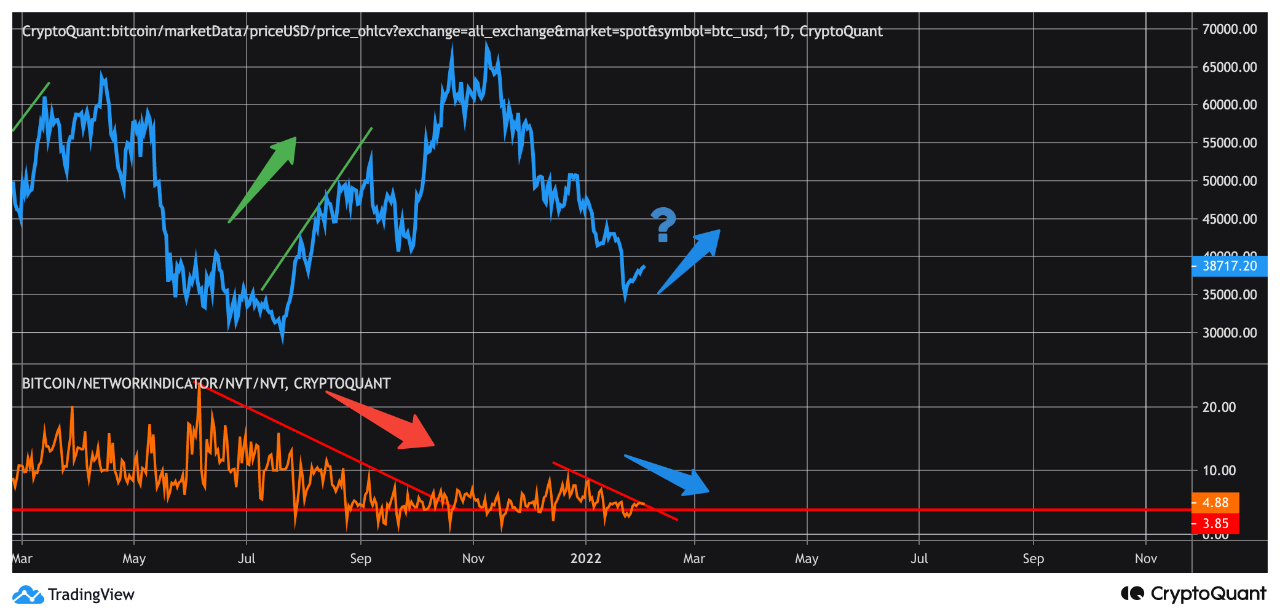
View original →We know that the NVT data shows whether the network value is swelling or not. A downward trend in NVT often heralds a future Bitcoin rally.

View original →Bullish(Nuanced)BTC
1/9/2022 In July, when Bitcoin dropped to the 29.000, the supply in profits had bottomed out by as much as 66%. As of January 7-8, we regressed to 66% for the first time in months. This could be interpreted as a potential bottom.


View original →Stablecoin buying power on exchanges has reached its strongest levels by falling to the support that has been continuing since May. After this time, it is completely 'demand'. Stablecoins that will improve the market are waiting on exchanges. #Bitcoin/Stablecoin reserves are shouting to 'buy'.


View original →Neutral11/27/2021
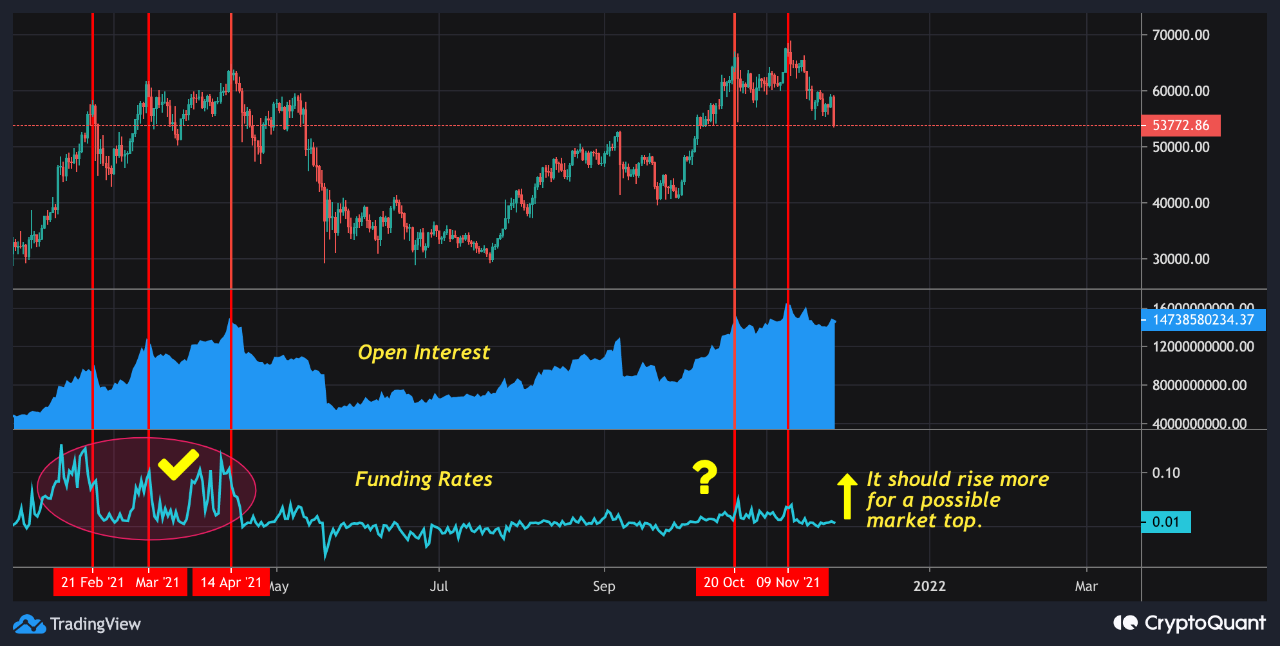
As I showed in the February to April, for a possible market top, we can expect funding rates to peak. Especially in this period when open interest broke records, funding rates did not give enough signals for a possible peak in my opinion. It is not always right to expect this value to 'fly', but a pointed movement may come for a trend reversal.

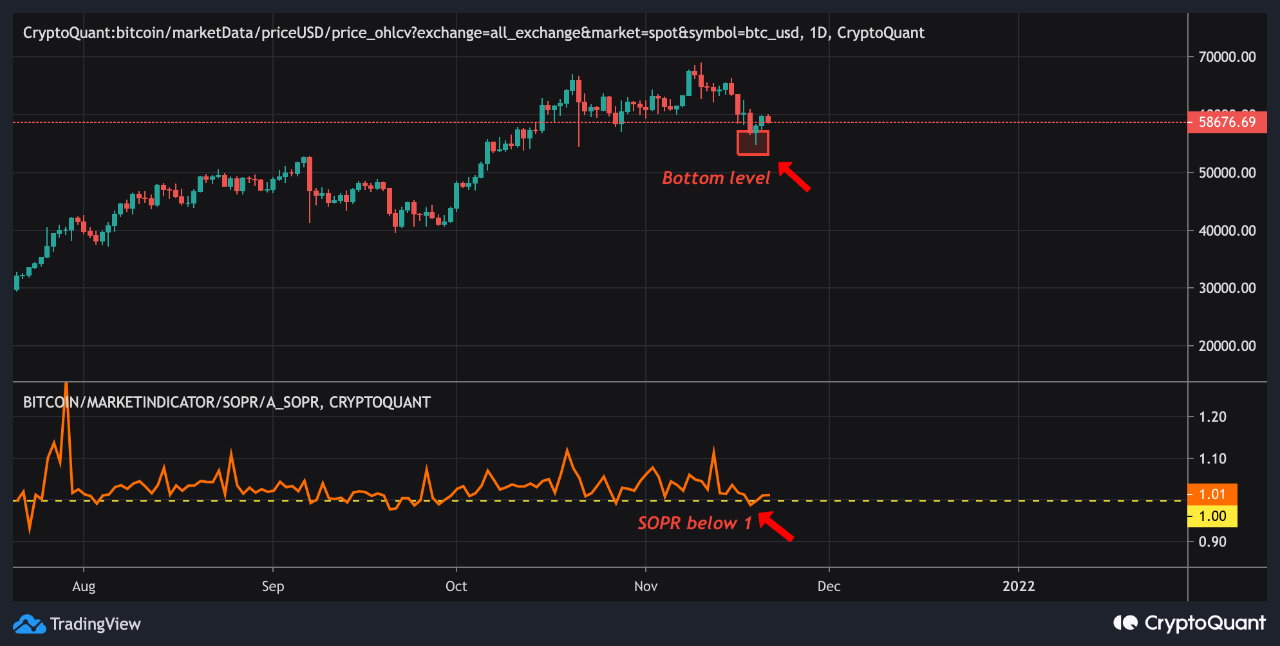
View original →In the on-chain world, we generally interpret SOPR as follows: SOPR, which temporarily drops below 1 in the bull season, means that it has given a buying opportunity. On November 19, when Bitcoin dropped to 55,800, the SOPR value also dropped below 1. And shortly after that, it reached 60,000. If you are into on-chain, this movement should be your favourite.

View original →Bullish(Nuanced)BTC
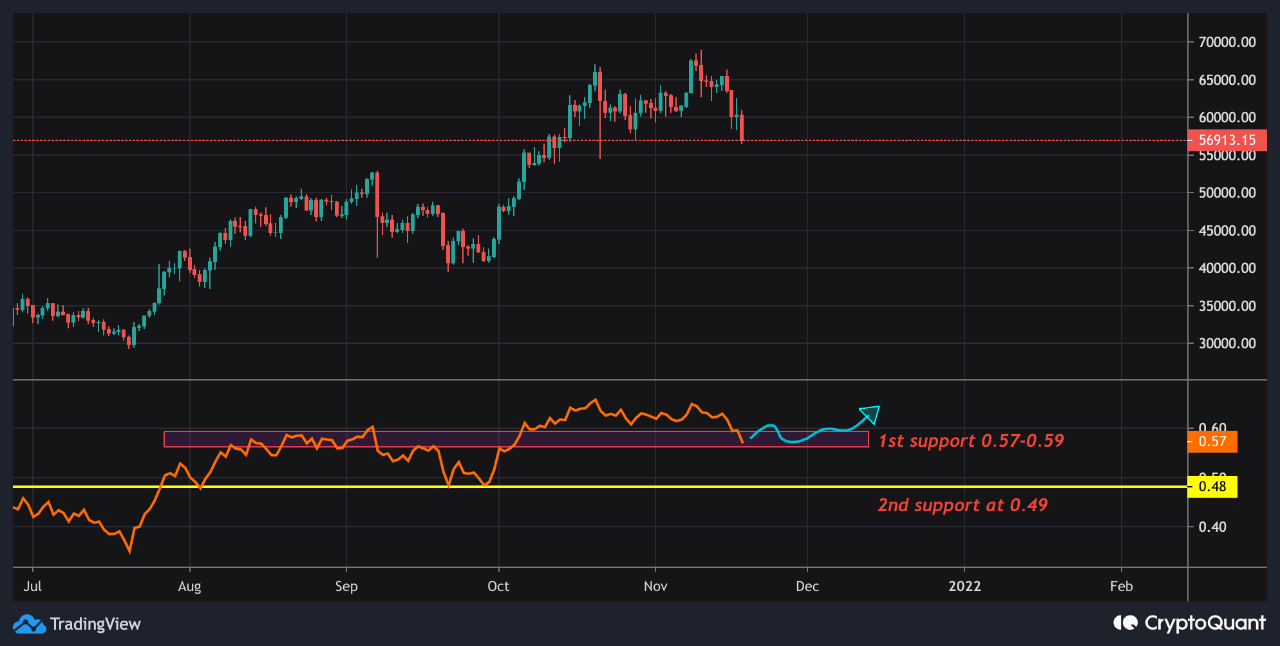
11/19/2021 Looking at the unrealized profit and loss data, there are certain support levels that have been recurring since August. We see that NUPL accumulates between 0.57 and 0.59 from time to time. In addition, 0.49 is strong support. Currently the NUPL data is at 0.57 and can get a reaction. If it reacts, we may see a rise in Bitcoin. Otherwise, if sales continue, NUPL data will likely return 0.49 at worst.

View original →Bearish(Nuanced)BTC
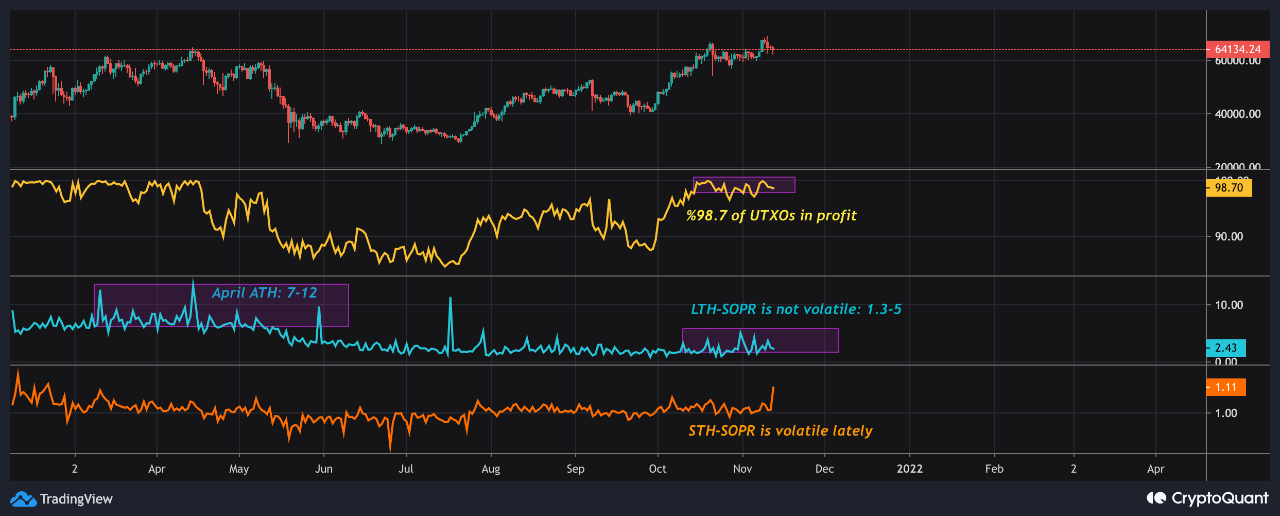
11/13/2021 In the example I indicate from April in the chart, we see that the LTH-SOPR is progressing between 7-12. However, LTH-SOPR is still moving between 1.3-5 despite reaching higher prices in November. The situation is volatile in short-term holders. With 98.7% of UTXOs in profit, it is suspicious that long-term holders are so calm. An idea; long term holders should change hands for the beginning of the altcoin bull.

View original →Neutral11/8/2021
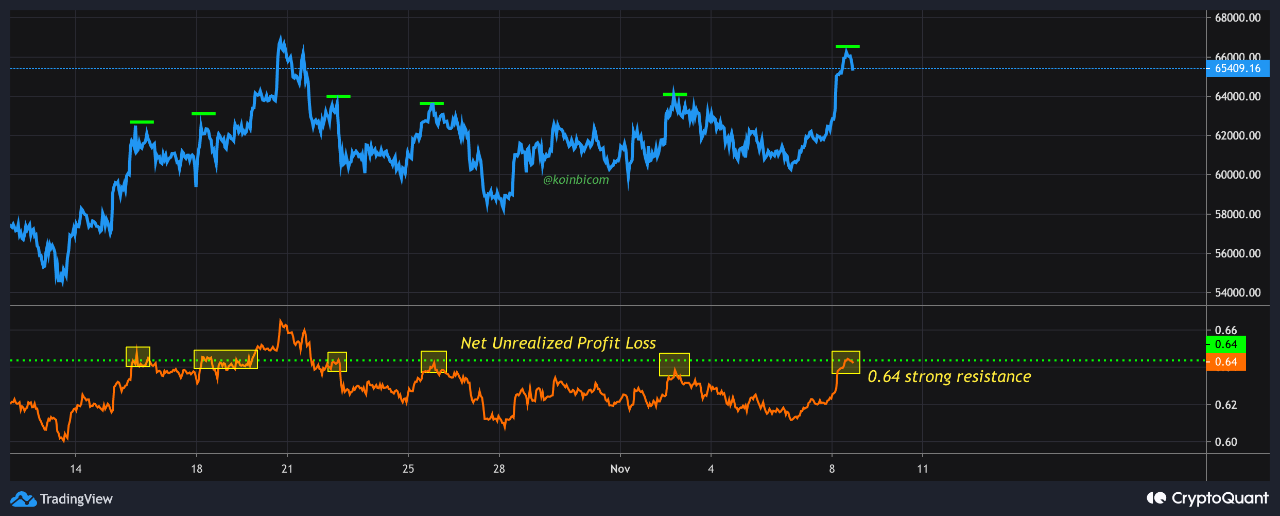
On the Net Unrealized Profit Loss data, we see that the 0.64 level has been a decisive resistance for the past few weeks. We see that when the NUPL value rises above the 0.64 resistance, it experiences a strong jump. The graph that best shows us the squeeze between investors in profit and price is, NUPL. Let's follow 0.64 as resistance!

View original →

